The 3D workspace
The selected compounds of a dataset as an interactive 3D scene: how to fill it, how to draw and measure the molecules, how to add surfaces, and how the mouse and the keyboard move the view.
The 3D workspace is a document of its own, one per dataset, with the viewer on the left and a control panel on the right. It shows the compounds you selected in the spreadsheet, each as one entry of the scene, and it shares its selection with the spreadsheet and every plot of the dataset. It is the place to look at 3D structures before a 3D-QSAR study: to check that an imported alignment is what it should be, that the conformers are sensible, or to measure a distance in a docked pose.
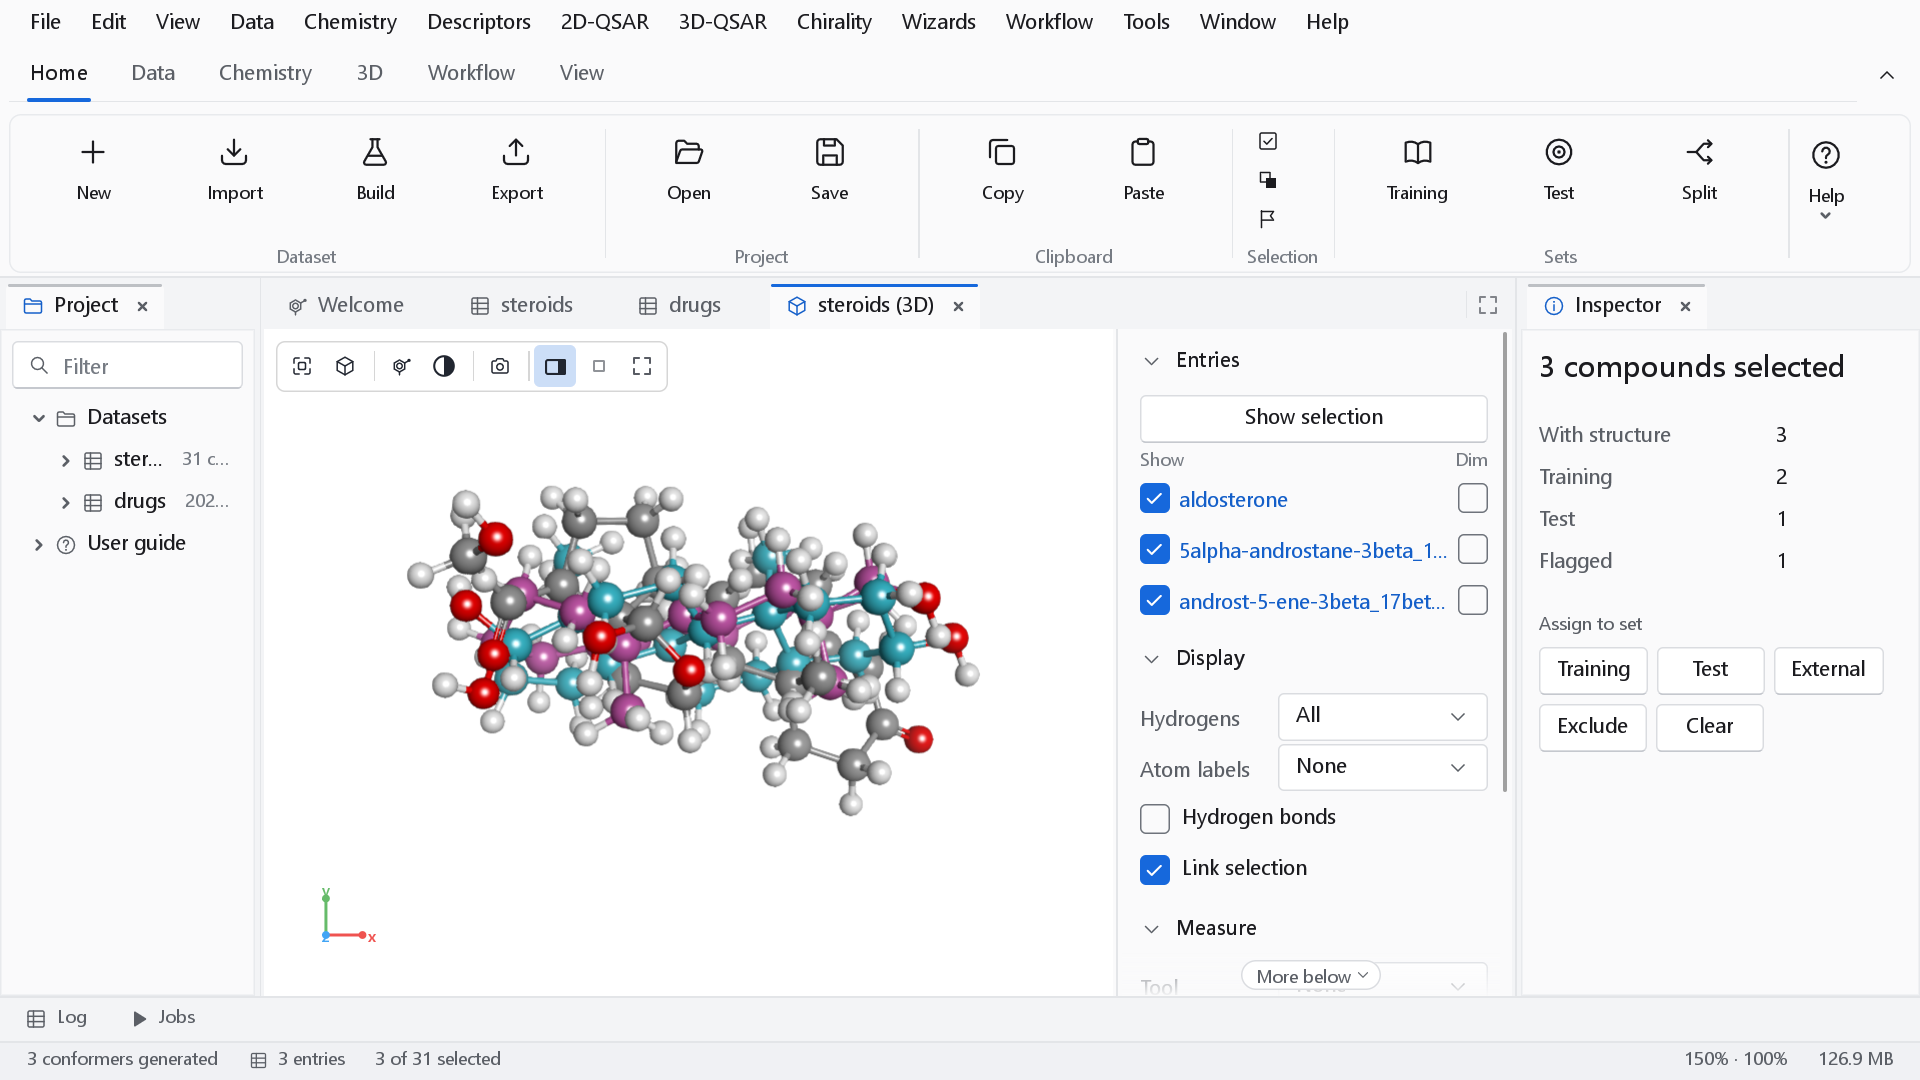
Opening the workspace
| Command | What it does |
|---|---|
| Chemistry > Open 3D workspace, Ctrl+3 | Opens the workspace of the active dataset and shows the rows selected in it. |
| 3D-QSAR > Open the 3D workspace | The same command, from the 3D-QSAR menu and the Workspace button of the 3D tab of the ribbon. |
| 3D-QSAR > Generate conformers for the selection | Shows the selected rows and builds a 3D structure for each that has none (Conformers on the 3D tab). |
| 3D-QSAR > Add a molecular surface | Adds a surface to every visible entry (Surface on the 3D tab). |
| Project explorer | The context menu of a dataset has Open 3D workspace. |
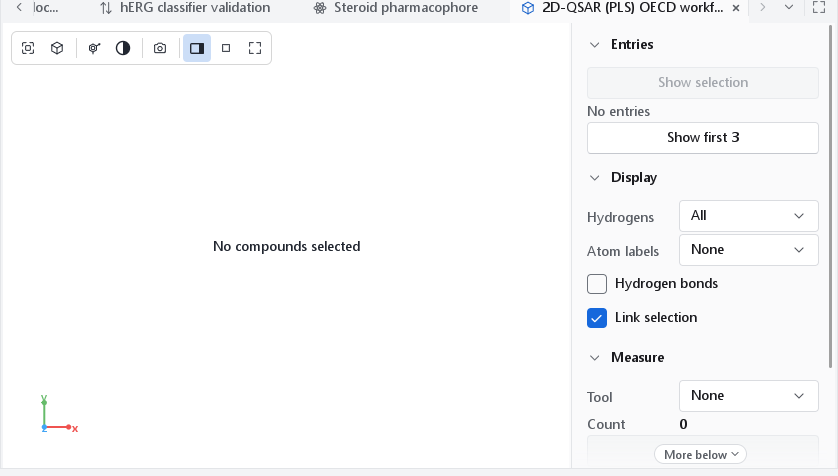
The workspace shows what you selected and nothing else. With no row selected it opens empty, says No compounds selected in the view, and offers Show first in the panel, which shows the first rows of the dataset (at most 200). A workspace never adds rows on your behalf.
A compound whose structure carries 3D coordinates (an SD or MOL2 file of docked poses or of an aligned series) is drawn in those coordinates. A compound without them is embedded on demand by distance geometry with a force-field refinement, on a worker thread; the panel says Generating conformers meanwhile and the status bar reports how many were generated. The embedding is seeded, so the same structure gives the same conformer every time. A structure that cannot be embedded is reported in a notification and left out.
How a molecule is drawn
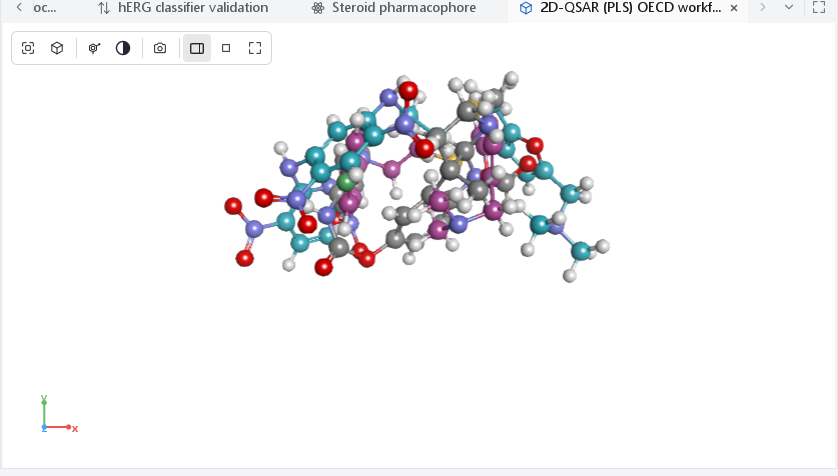
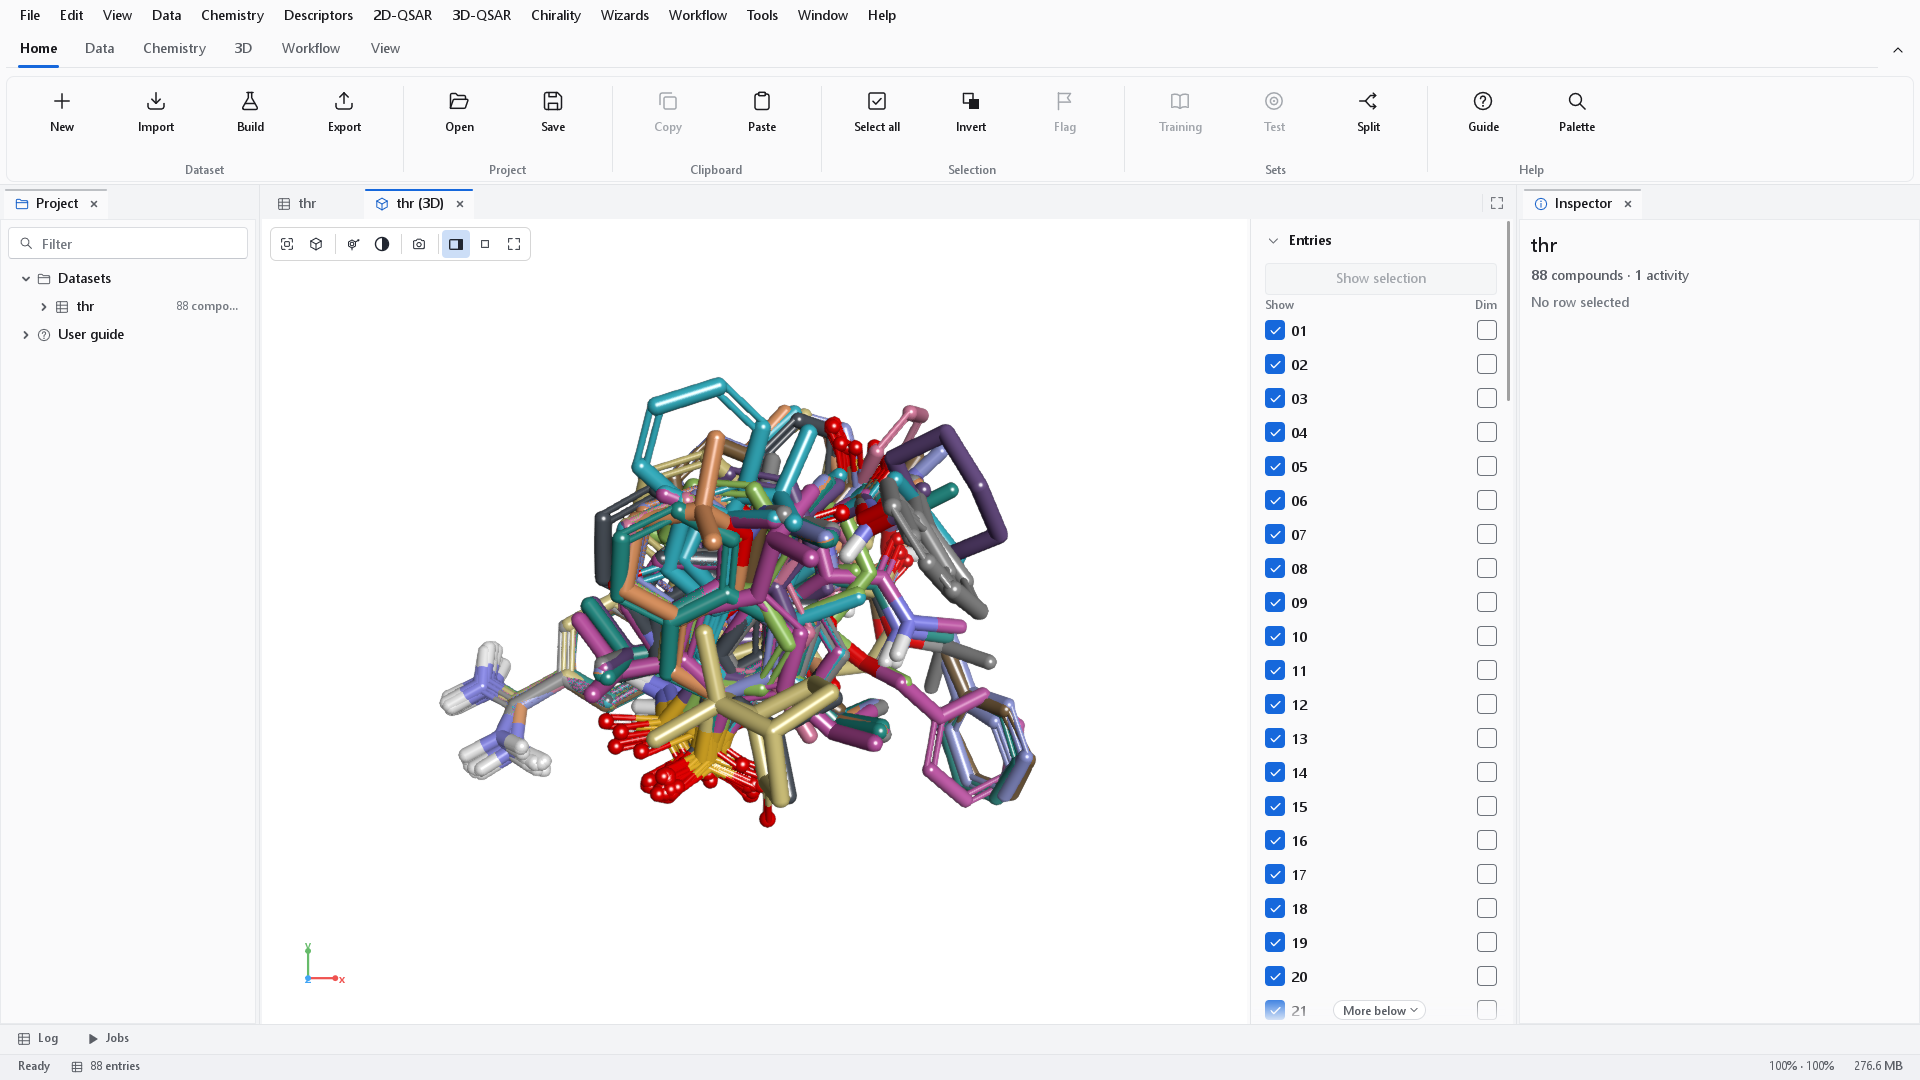
A 3D view opens on a white background, with the atoms in element colours: mid grey carbon, white hydrogen, blue nitrogen, red oxygen, gold sulfur. Each stick takes the colour of the atom at its own end and changes colour half-way along the bond, double and aromatic bonds are drawn as a main stick with a thinner one beside it, and the lighting is bright and even with one clear highlight. There are no outlines around the atoms: the shading separates the sticks on its own. That is the look a printed figure wants, so what is on the screen is what the figure will be.
The look of earlier versions is still available, as Lighting Soft, Element colours Classic and Background Dark in the control panel, with Silhouette outlines switched on in Settings. It reproduces the pictures of version 1.1.0 exactly.
The control panel
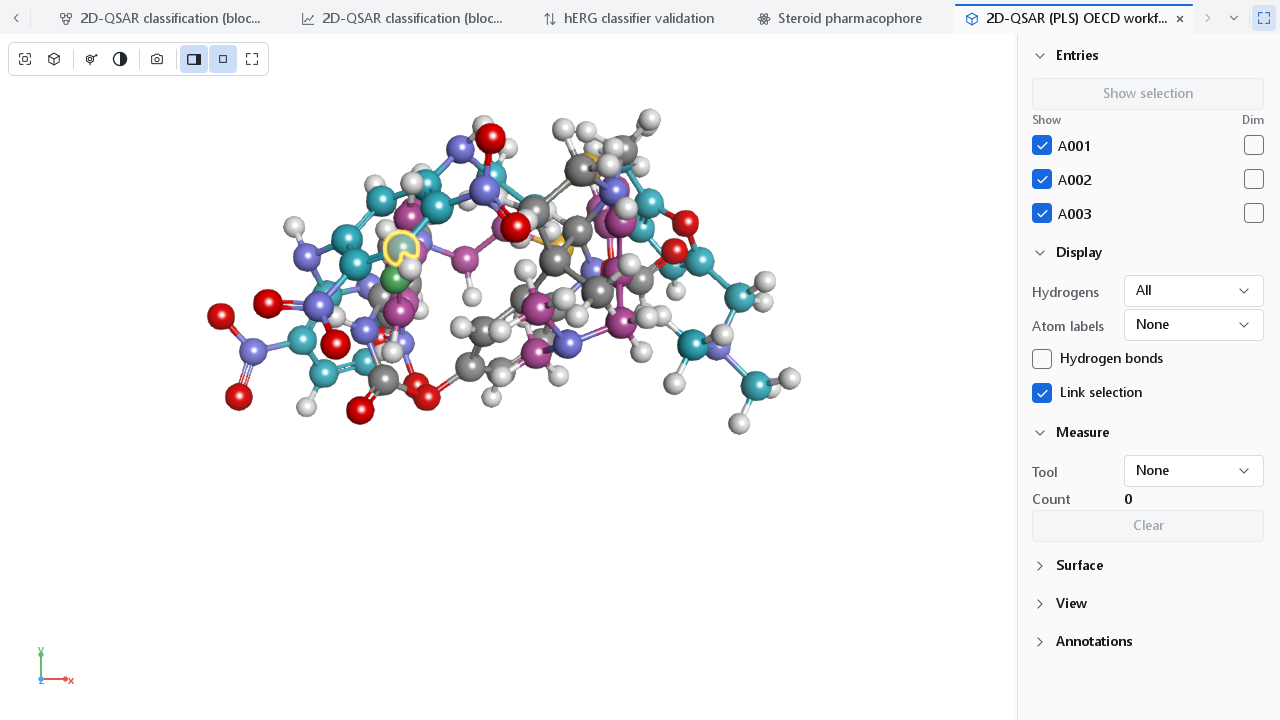
Each section opens and closes by its heading, and the program remembers which ones were open, the width of the panel (drag the divider) and the background. The Controls button of the viewer toolbar hides the whole panel.
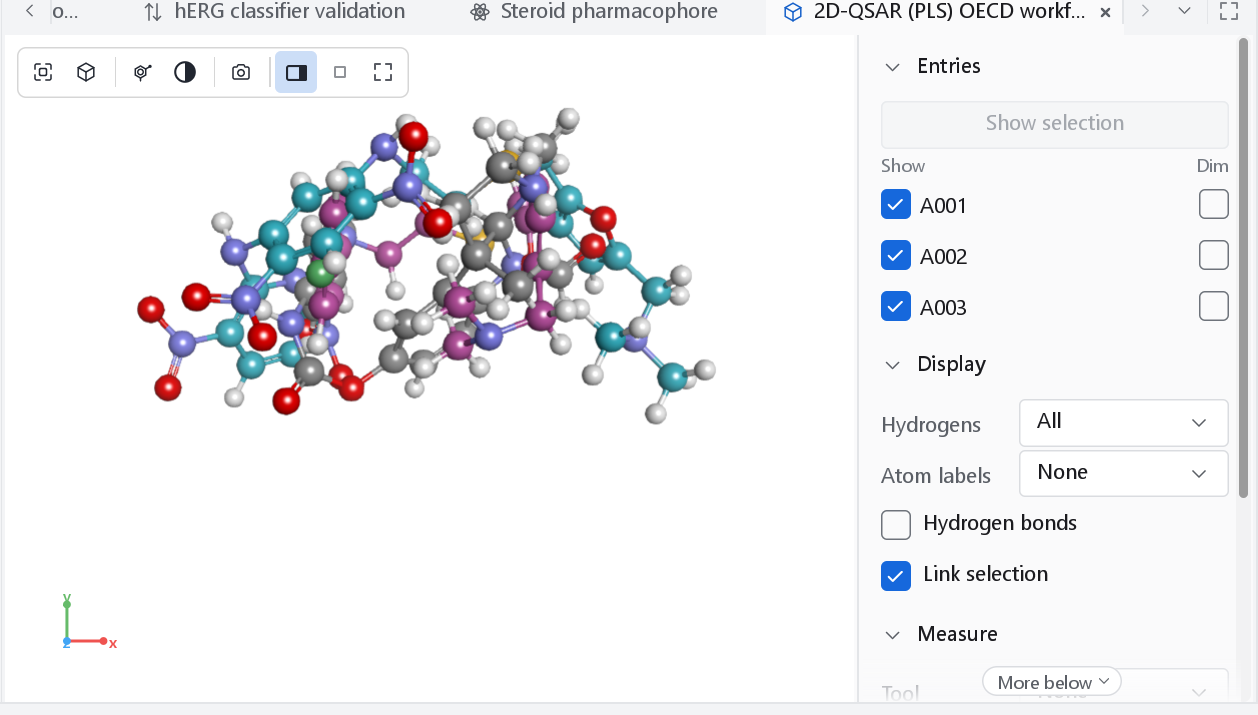
Entries
| Control | What it does | When to use it |
|---|---|---|
| Show selection | Replaces the entries by the rows now selected in the dataset (at most 200). | After selecting a different set of rows in the spreadsheet or a plot. |
| Show first n | Only in an empty workspace: shows the first rows of the dataset. | For a quick look at a file you have just imported. |
| Show box | Shows or hides the entry. | To take one molecule out of a crowded overlay without losing it. |
| Entry name | Clicking it selects the compound in the dataset and in the scene. The name of a selected compound is drawn in the accent colour. | To find the spreadsheet row of a molecule. |
| Dim | Draws the entry greyed out, so the others stand out. | To compare two molecules against the rest of a series. |
Display
| Control | Choices | Default and reason |
|---|---|---|
| Hydrogens | All, Polar only, None | All. Polar only keeps the hydrogens on nitrogen, oxygen and sulfur, which are the ones that matter for hydrogen bonding and for donor fields; it removes most of the clutter of a large overlay. |
| Atom labels | None, Element, Index, Element and index | None. Index labels are the atom numbers of the structure, which is what a core definition or a per-atom property refers to. |
| Hydrogen bonds | On or off | Off. Draws dashed lines between donor and acceptor atoms within 3.5 Å (Baker and Hubbard 1984), between all entries, which is how a ligand pair or a ligand and a water network is checked. |
| Link selection | On or off | On. Selecting atoms selects the compound in the spreadsheet and the plots, and the other way round. Switch it off to select atoms for a measurement without changing the selection of the dataset. |
Measure
Choose Tool: Distance, Angle or Dihedral, then click two, three or four atoms in the view. The measurement is drawn with its value in the scene and Count says how many there are; Clear removes them all. A click on a surface or a lobe instead of an atom uses the point under the cursor. Esc abandons a measurement that is half picked. Set the tool back to None to select atoms by clicking again.
Surface
| Control | Meaning |
|---|---|
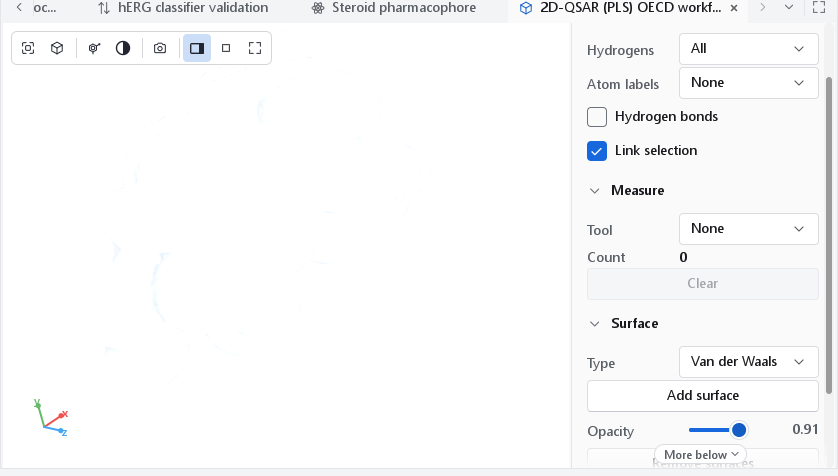
| Type | Van der Waals: the union of the atom spheres. Solvent accessible: the same spheres grown by a 1.4 Å probe, the surface the centre of a water molecule can reach. Solvent excluded: the surface a rolling 1.4 Å probe leaves (the Connolly surface), which follows the contact surface of the molecule more closely. |
| Add surface | Builds the chosen surface for every visible entry, replacing the surfaces that were there. The work runs as a job; the status bar reports how many surfaces were added. |
| Opacity | From 0.10 to 1.00, 0.45 when the workspace opens. A translucent surface leaves the skeleton readable. |
| Remove surfaces | Removes every surface. |
View and Annotations
These two sections are the same in every 3D view of the program: the workspace, the maps of the 3D-QSAR dashboard and the pharmacophore view.
| Control | Meaning |
|---|---|
| Direction | Turns the camera to the best view, front, back, left, right, top or bottom, and frames the content. |
| Projection | Perspective or orthographic. Orthographic keeps parallel lines parallel and sizes comparable across the picture, as most published figures do. |
| Motion | Still, Spin (about the vertical axis) or Rock (back and forth). Motion helps the eye read depth in a dense overlay. |
| Clip slab, Thickness | Draws only a slab around the centre of the view, from 1 to 30 Å thick, to look inside a crowded scene. |
| Depth cue | Fades the back of the scene towards the background, from 0 (off) to 1. |
| Shadows | Ambient occlusion: soft contact shadows where atoms meet, from 0 (off) to 2.5. |
| Lighting | Bright (the default), Soft, Studio, Glossy, Flat or Toon. Bright for everyday work and for figures, Soft for the look of earlier versions, Glossy for the look of classic contour-map figures, Flat for schematics. |
| Element colours | Standard (the default): mid grey carbon, white hydrogen, blue nitrogen, red oxygen, gold sulfur, the colours of the usual stick picture. Classic: the dark carbon and the colours of the 2D drawings, the palette of earlier versions. |
| Background | White (the default), Dark, Light or Black. White is the background of a printed figure; the choice is remembered for each kind of view. |
| Save view, Load view | Writes the camera, the lighting and the annotation settings to a file and reads them back, so a figure can be made again from the same angle. |
| Legend | Corner, Bottom strip or Off. |
| Title, Scale bar, Axes, Labels | The title of the scene in the top-left corner, a bar of a round length in Å, the x, y and z axes of the model frame, and atom, feature and measurement labels. |
The viewer toolbar
The toolbar in the top-left corner of the view has the frequent actions. When the view is narrow, the buttons that do not fit move into a More menu at its end.
| Button | Action |
|---|---|
| Fit to view (F) | Frames what is drawn. |
| View direction | Best view, front, back, left, right, top, bottom. The best view looks along the direction in which the content is widest and tallest. |
| Representation | Wire, Stick, Ball and stick, CPK or Licorice, for every entry. |
| Background | Dark, Light, White, Black. |
| Export figure (camera) | Opens the 3D figure dialog, which renders the scene off screen at a stated size and resolution. See Publication figures. |
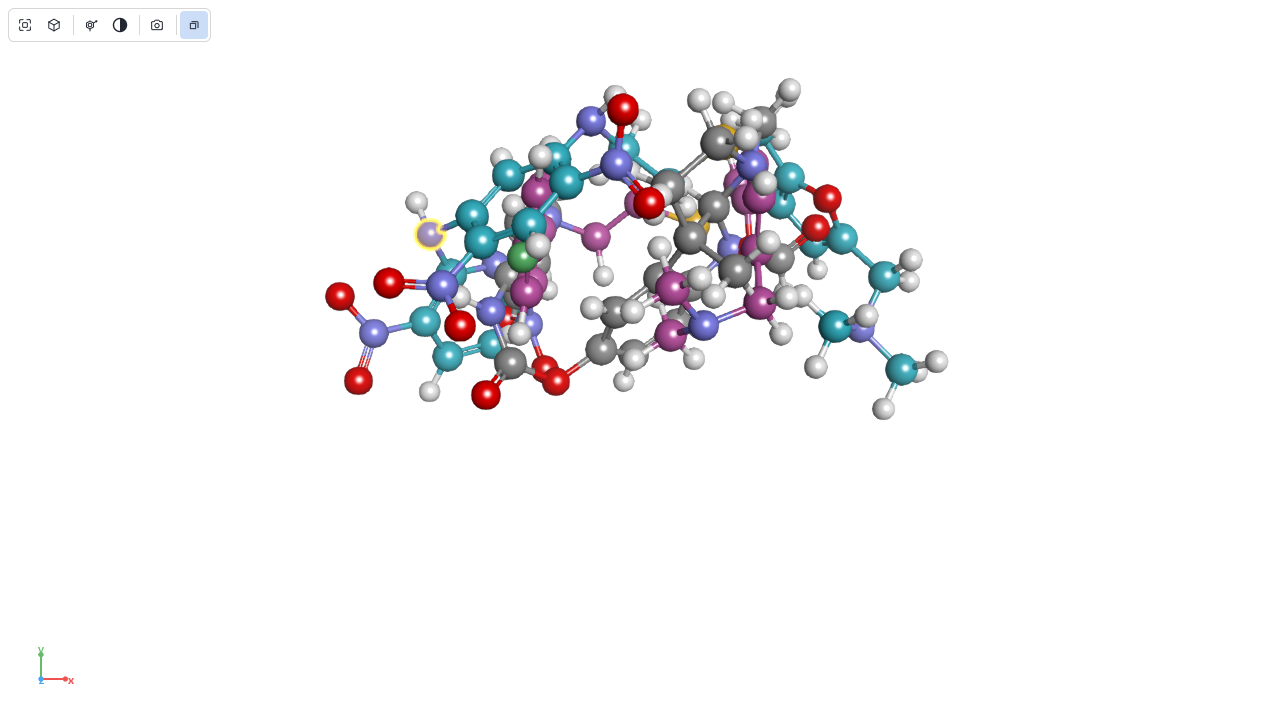
| Display | Only in views without a control panel, such as the preview of a wizard page: projection, motion, depth cue, shadows and the annotations as one menu. |
| Controls | Shows or hides the control panel. |
| Focus mode (F11) | Hides the side panels of the window so the document has the whole window. Esc leaves it. |
| Full screen (Ctrl+F11) | Draws the view alone over the whole window. The same button or Esc leaves it. |
A view frames its content when it opens. As long as you have not rotated, moved or zoomed it, it frames the content again whenever its size changes (the window is resized, the panel is hidden, focus mode is switched on). Once you move the camera it stays where you put it until you press Fit to view or choose a direction.
Mouse and keyboard
| Input | Action |
|---|---|
| Left drag | Rotate (a virtual trackball about the centre of the view). |
| Middle drag, or Shift + left drag | Move the scene. |
| Right drag, or the wheel | Zoom. The wheel zooms towards the point under the cursor. |
| Ctrl + left drag | Select the atoms inside a rectangle. |
| Alt + left drag | Select the atoms inside a freehand outline (lasso). |
| Click on an atom | Select it (and with Link selection its compound). Shift+click adds, Ctrl+click toggles, Alt+click removes. A click on empty space clears the selection. |
| Double click | On a molecule: frame that entry. On empty space: frame everything. |
| 1 to 6 | Thin lines, wire, stick, ball and stick, CPK, licorice. |
| H | Cycle the hydrogens: all, polar only, none. |
| F, Shift+F | Frame everything; frame the selection. |
| O | Switch between perspective and orthographic projection. |
| S | Start or stop spinning. |
| Ctrl+A | Select every atom of the scene. |
| Esc | Abandon a half-picked measurement; otherwise clear the selection. |
Selection is shared
The workspace, the spreadsheet and the plots of a dataset share one selection. Picking an atom selects its row, and selecting rows elsewhere highlights the corresponding entries. A selection that arrives from the spreadsheet is not echoed back, so rows that are not shown in the workspace stay selected. Nothing is selected, shown or hidden on your behalf.
Rendering quality
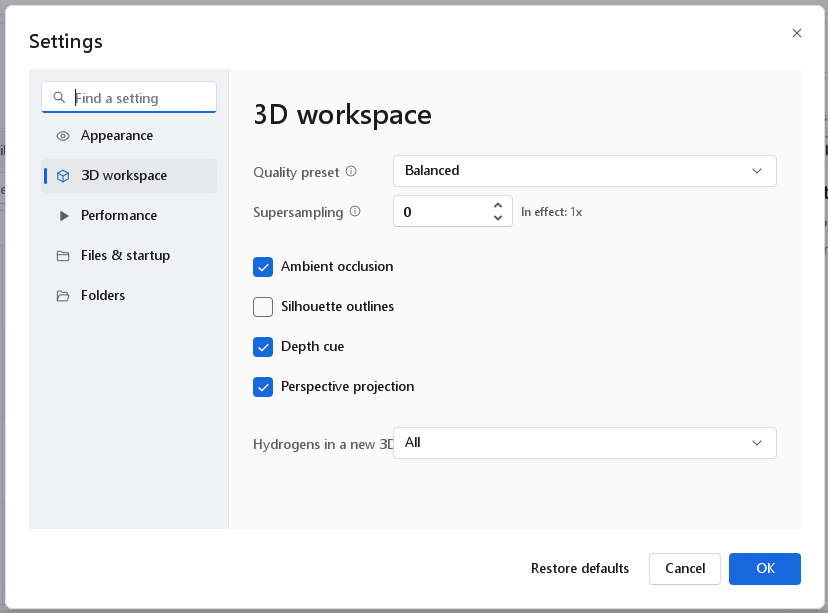
The look of the workspace is set in Tools > Settings > 3D workspace (Ctrl+,). The settings apply to new views and to the workspace at once; the lighting, the background and the annotations of a workspace are its own and are kept.
| Setting | Meaning | When to change it |
|---|---|---|
| Quality preset | Draft, Balanced (default), High, Publication. Draft renders at 1x without contact shadows, Balanced at 1x with them, High at 2x with finer shadows and Publication at 3x with the finest. | Draft on an integrated graphics adapter or a remote desktop; High or Publication on a fast card for sharper edges on screen. |
| Supersampling | 0 (default) takes the value of the preset; 1 to 4 sets it. The row shows the factor in effect. | Only to override the preset. |
| Ambient occlusion | Contact shadows. The Draft preset turns them off whatever this box says. | Off on slow hardware. |
| Silhouette outlines | Dark outlines around atoms and bonds. Off by default: the standard look separates sticks by their shading alone. | On for a dense overlay of an aligned series, or for a figure printed small. |
| Depth cue | Fading towards the back of the scene. | Off for flat schematics. |
| Perspective projection | Perspective when ticked, orthographic otherwise. | Untick it if you prefer every new view orthographic. |
| Hydrogens in a new 3D view | All (the default), Polar only or None. The view's own control changes that view alone. | Polar only when you work mostly with hydrogen-bonding patterns in crowded structures. |
Exported figures are rendered off screen at their own size and resolution, independent of these settings; see Publication figures.