Pharmacophore hypotheses
A search for the arrangements of features that the actives of a series share and the inactives do not: the wizard, the ranked hypotheses, their geometry, the fit of each active, and the 3D view.
A pharmacophore hypothesis is a set of three to six feature points (acceptor, donor, hydrophobe, positive or negative ionisable group, aromatic ring) with fixed distances between them that the active molecules can all present at once. A hypothesis that the actives share and the inactives cannot present is a candidate for the features the binding site recognises. It is also an alignment rule: the actives superposed on their best hypothesis are an aligned set that can go into a 3D-QSAR study.
The search is GeinQSAR's formulation of the variant-tree approach of Dixon et al. (J. Comput.-Aided Mol. Des. 2006, 20, 647). Open it with Wizards > Pharmacophore hypotheses, or Pharmacophore in the Wizards group of the Workflow tab. Like every wizard it builds a workflow and runs it; the dashboard opens when the search finishes.
The wizard
1 Data
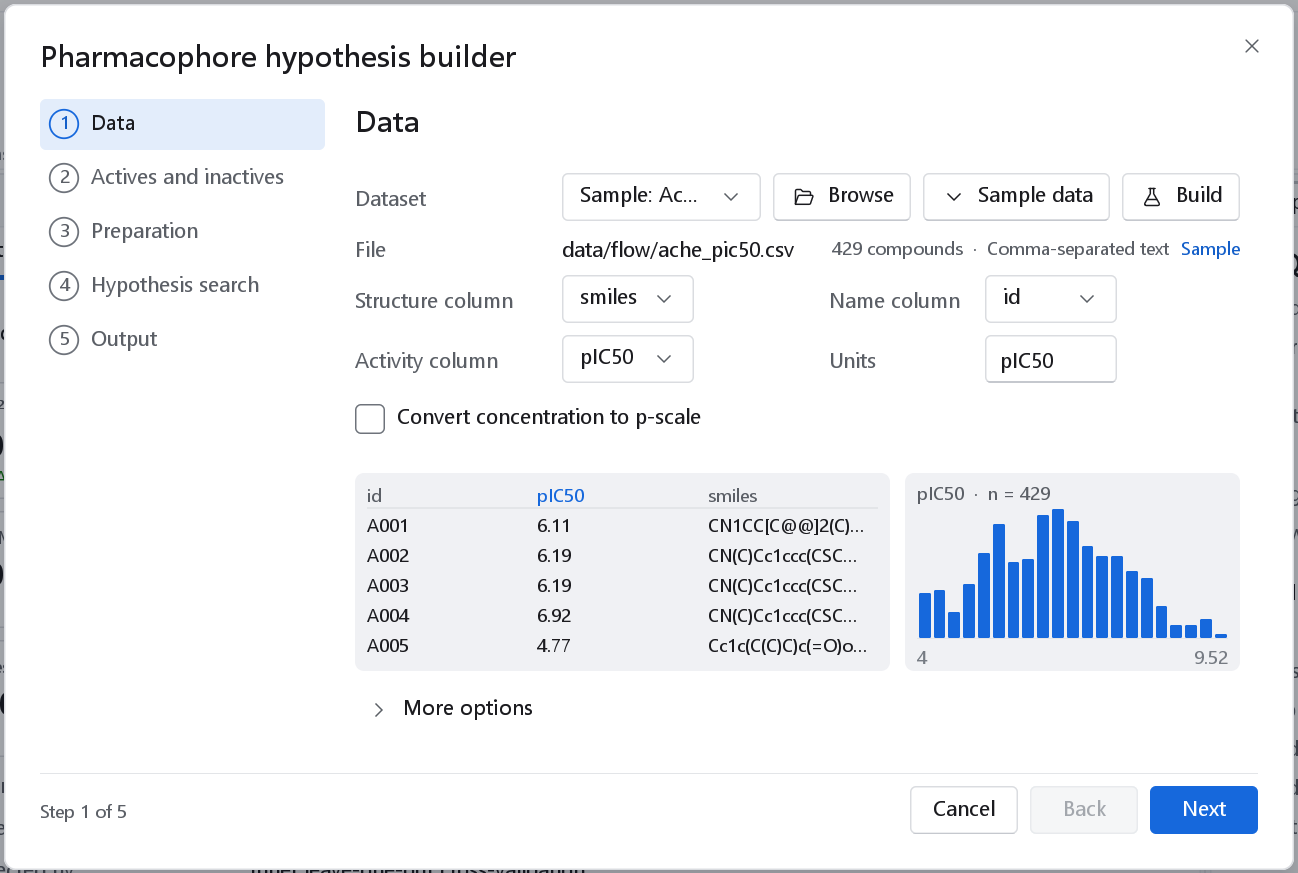
data/flow/ache_pic50.csv, 429 compounds, activity pIC50).The same data page as every wizard (see The 2D-QSAR wizard). The activity must be on a logarithmic scale or be converted with Convert concentration to p-scale.
2 Actives and inactives
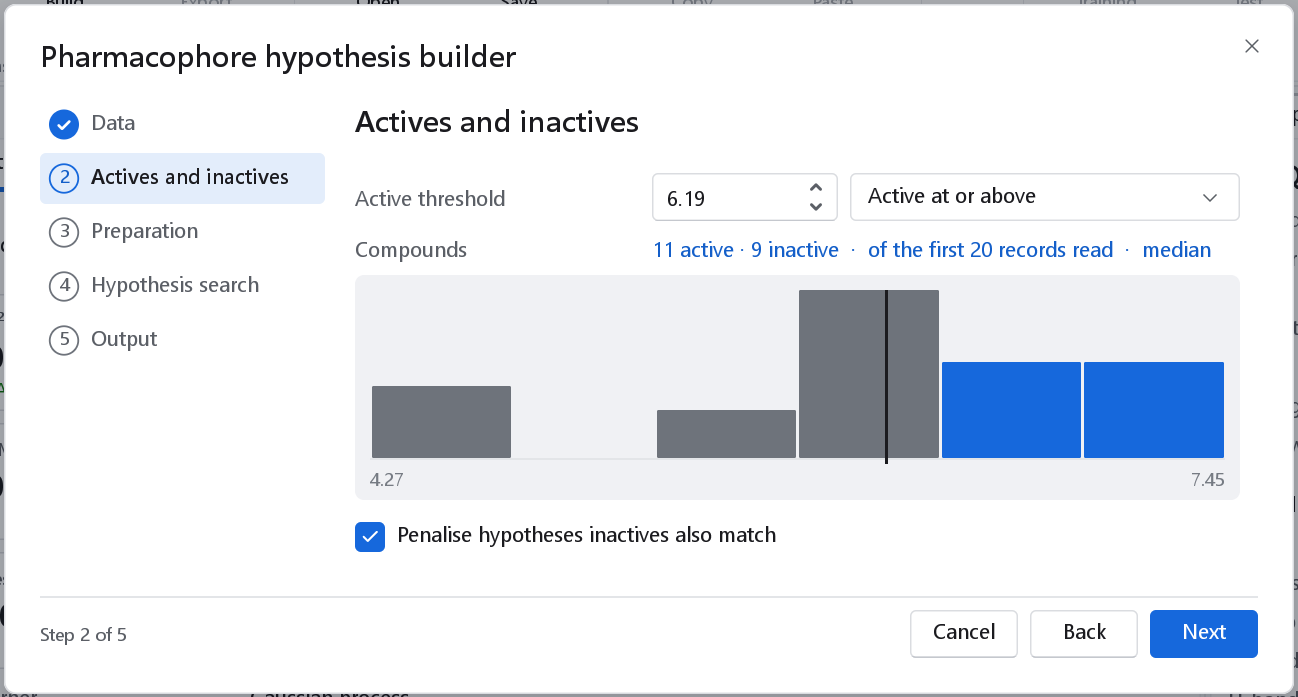
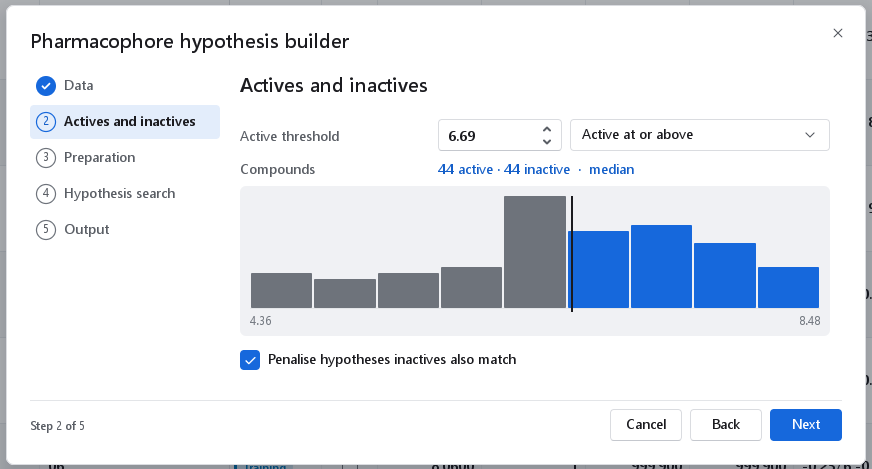
The series is divided at a threshold. The median of the activity column is offered as a suggestion, marked median, together with the resulting counts and a histogram in which the actives are blue and the inactives grey; set the value your assay calls active.
| Control | Default | Meaning |
|---|---|---|
| Active threshold | The median | Compounds at or beyond it are the actives the hypothesis must explain; the other measured compounds are the inactives. |
| Sense | Active at or above | At or above for a p-scale (pIC50, pKi); at or below for a concentration (IC50, Ki). |
| Penalise hypotheses inactives also match | On | A hypothesis the inactives match just as well explains nothing, so a weighted score of the inactives is subtracted from the survival score. Switch it off only when the inactives are not trustworthy (for example inactive for a reason unrelated to binding). |
The page refuses a threshold that leaves fewer than two actives or no inactive compound.
3 Preparation
| Option | Default | Meaning and when to change it |
|---|---|---|
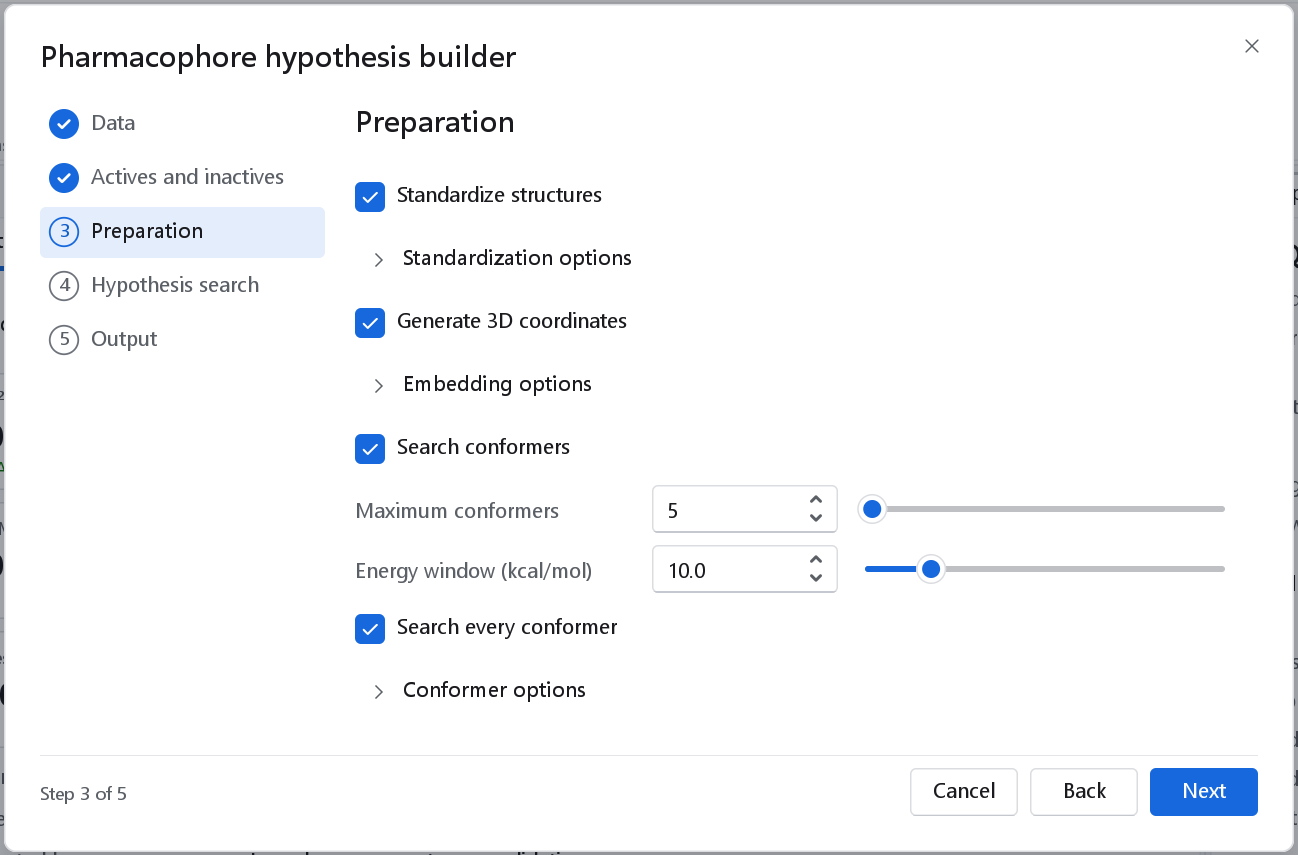
| Standardize structures | On | Strips salts and solvents, keeps the largest fragment and neutralises charges; the stereochemistry is kept. |
| Generate 3D coordinates | On | Embeds one 3D structure per molecule; molecules that carry coordinates keep them unless the embedding options say otherwise. |
| Search conformers | On | A flexible ligand needs a fair chance to present the pharmacophore, and the bioactive conformer is unknown. |
| Maximum conformers | 20 | Conformers kept per molecule, lowest energy first (1 to 200). The cost of the search grows with their number. |
| Energy window (kcal/mol) | 10.0 | Conformers more than this above the lowest are discarded. |
| Search every conformer | On | Enumerates the sites of every stored conformer instead of the lowest-energy one only. This is the honest option, and it multiplies the cost of the enumeration. |
4 Hypothesis search
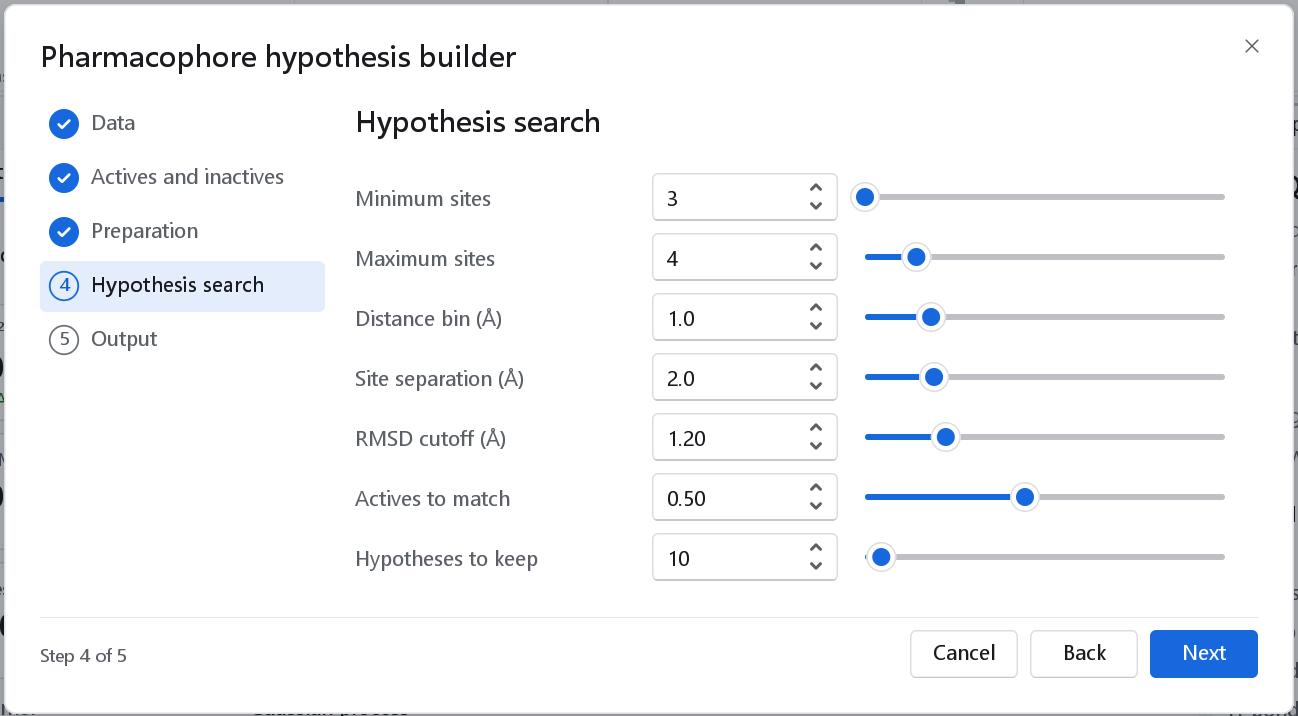
| Option | Default | Meaning and when to change it |
|---|---|---|
| Minimum sites, Maximum sites | 3, 5 | Three points fix a rigid body. More sites are more specific but harder for every active to present at once, and the cost grows quickly with the count (3 to 10). |
| Distance bin (Å) | 1.0 | Tolerance of the inter-site distances: two arrangements whose distances fall into the same bins are one candidate. A larger bin merges more arrangements and finds more common hypotheses that are less precise. |
| Site separation (Å) | 2.0 | The smallest distance between two sites of one hypothesis; sites closer than this are not used together. |
| RMSD cutoff (Å) | 1.2 | An active matches a hypothesis when its sites superpose within this RMSD. |
| Actives to match | 0.50 | A hypothesis is kept when at least this fraction of the actives can present it. Raise it for a tight congeneric series, lower it when the actives belong to several chemotypes. |
| Hypotheses to keep | 20 | The best-ranked hypotheses that are listed and reported (1 to 200). |
5 Output
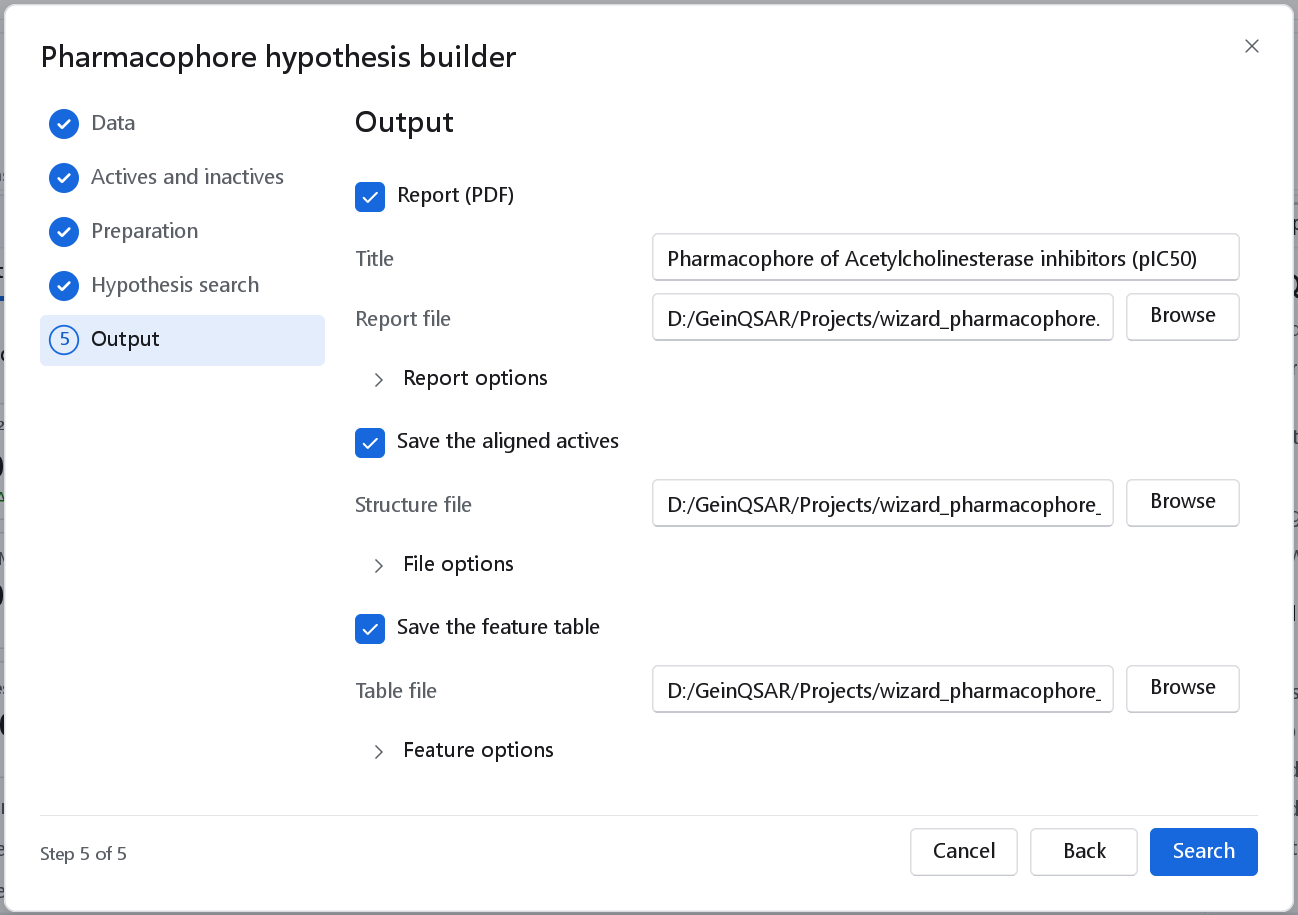
| Output | Default | Result |
|---|---|---|
| Report (PDF) | On | The ranked hypotheses with their site geometry, how every active fits the best hypothesis, and the fit table. |
| Save the aligned actives | Off | The actives as the search aligned them onto the best hypothesis, as a structure file. An SD file keeps their activities and data fields. Open it in the 3D-QSAR builder with the alignment As supplied to build a model on the alignment the hypothesis implies. An active that does not match is left out. |
| Save the feature table | Off | The pharmacophore features of every active, one per row: the molecule, the feature letter and type, the atoms that define it and its position. The dashboard then also shows the number of features of each type per active. |
The dashboard
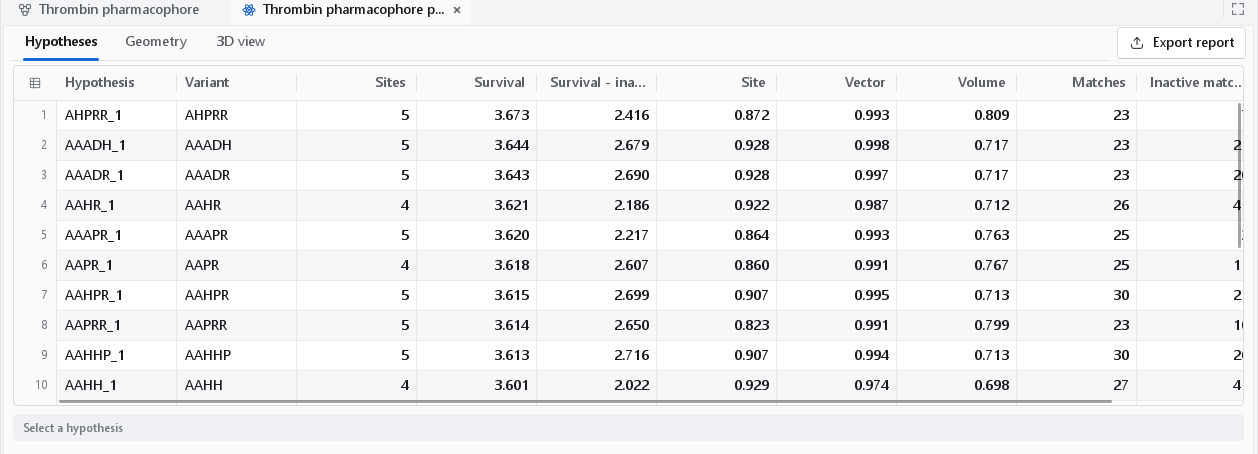
The dashboard has three tabs: Hypotheses, Geometry and 3D view. No hypothesis is selected when it opens; select one in the table or in the Hypothesis drop-down of the 3D view, and it becomes the subject of all three tabs.
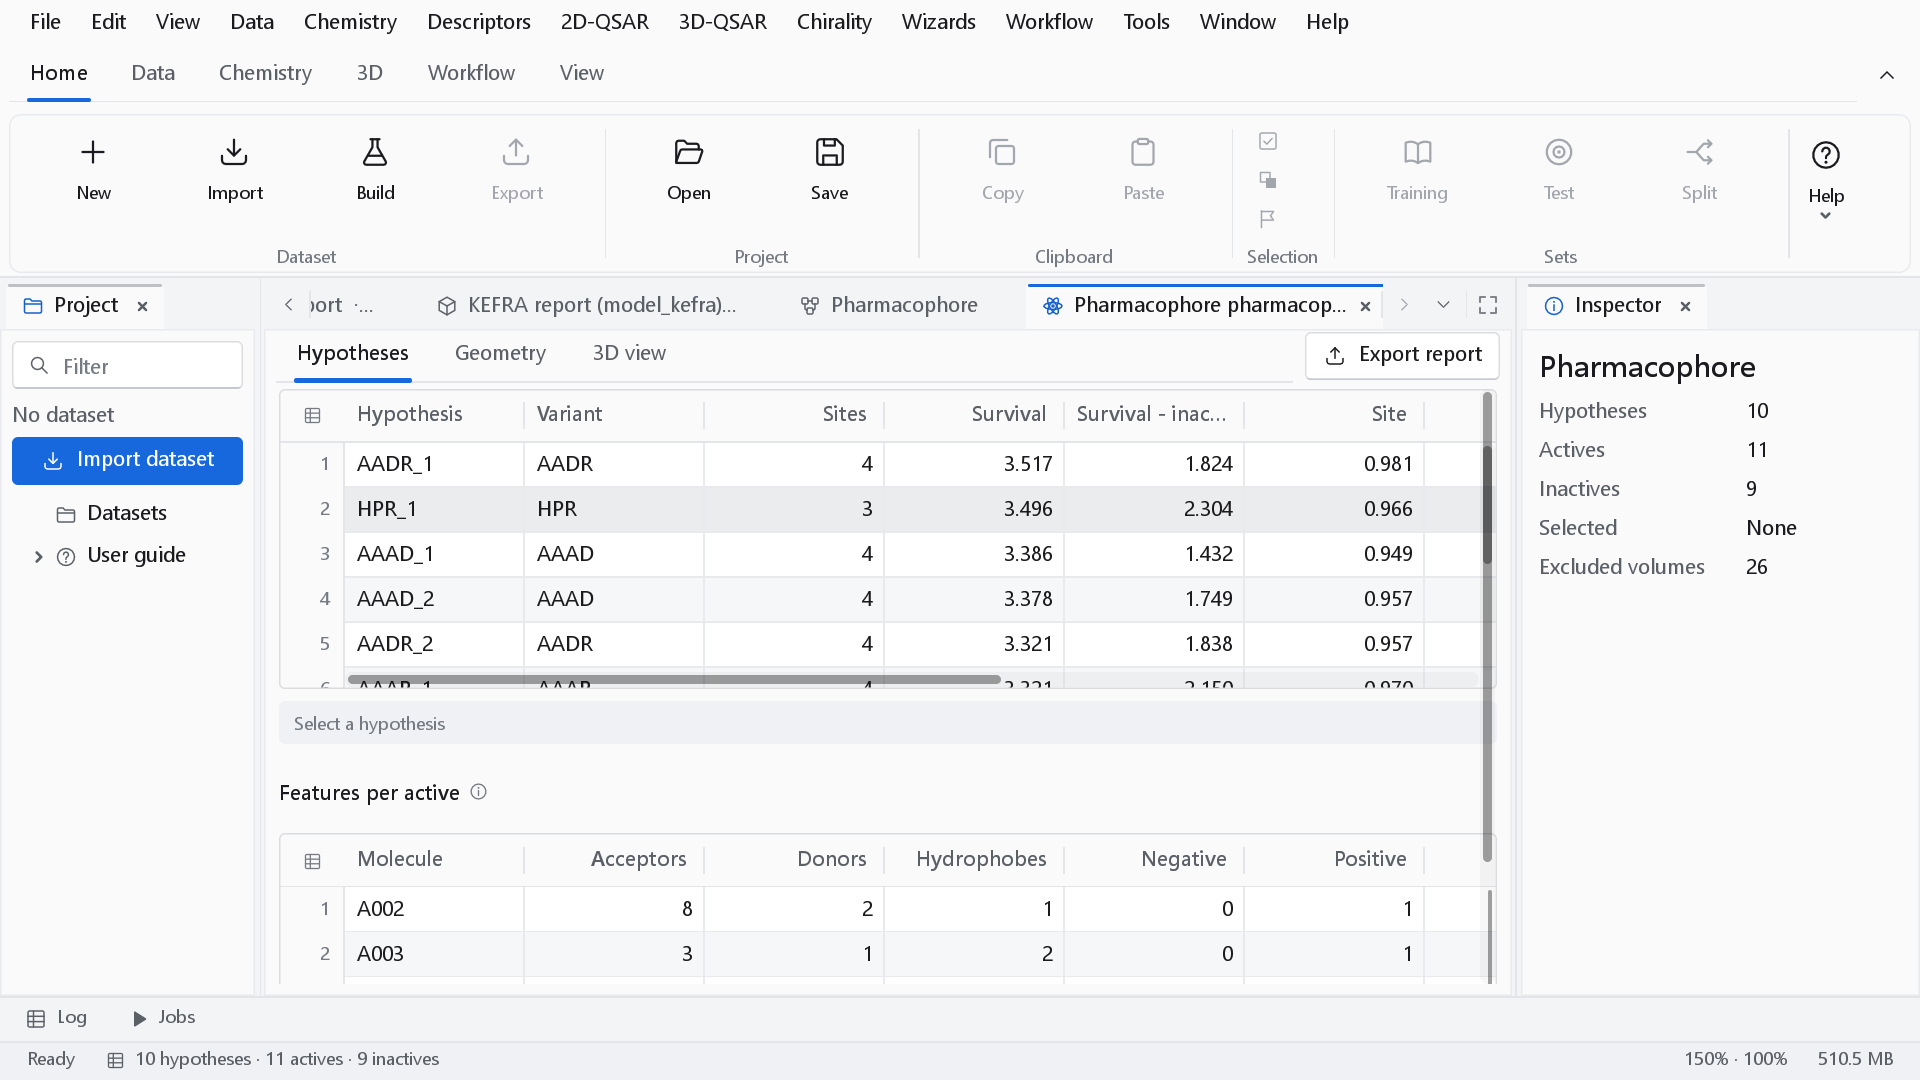
The ranking
The terms of the score are reported separately, so that a ranking can always be explained.
| Column | Definition |
|---|---|
| Variant | The feature letters of the hypothesis: A acceptor, D donor, H hydrophobe, N negative, P positive, R aromatic ring. A suffix (_1, _2) distinguishes hypotheses with the same letters and different geometry. |
| Sites | The number of feature points. |
| Site | 1 - RMSD / 1.2 Å of the matched sites, averaged over the matched actives. |
| Vector | The mean agreement of the matched direction vectors (cosine; absolute cosine for ring normals). |
| Volume | The mean Gaussian shape Tanimoto of each aligned active with the reference active. |
| Matches | The number of actives that present the hypothesis. |
| Survival | w(site) x Site + w(vector) x Vector + w(volume) x Volume + W(match)^(matches - 1). |
| Survival - inactive | Survival minus a weighted survival evaluated on the inactives. A hypothesis the inactives present equally well loses rank. |
| Mean RMSD | The mean RMSD of the matched sites over the matched actives, in Å. |
The weights are GeinQSAR defaults and are parameters of the search step of the workflow. Compare Survival with Survival - inactive: a hypothesis near the top by survival and low by the second column is common to the whole series, actives and inactives alike.
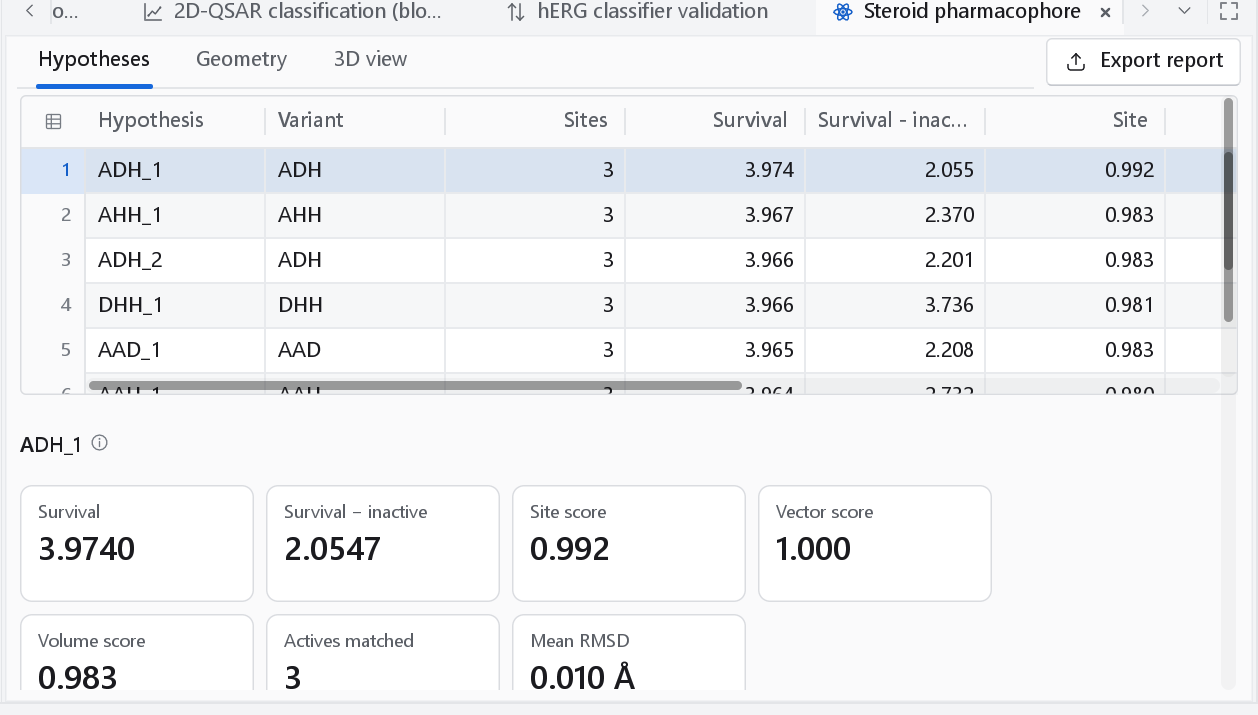
Geometry
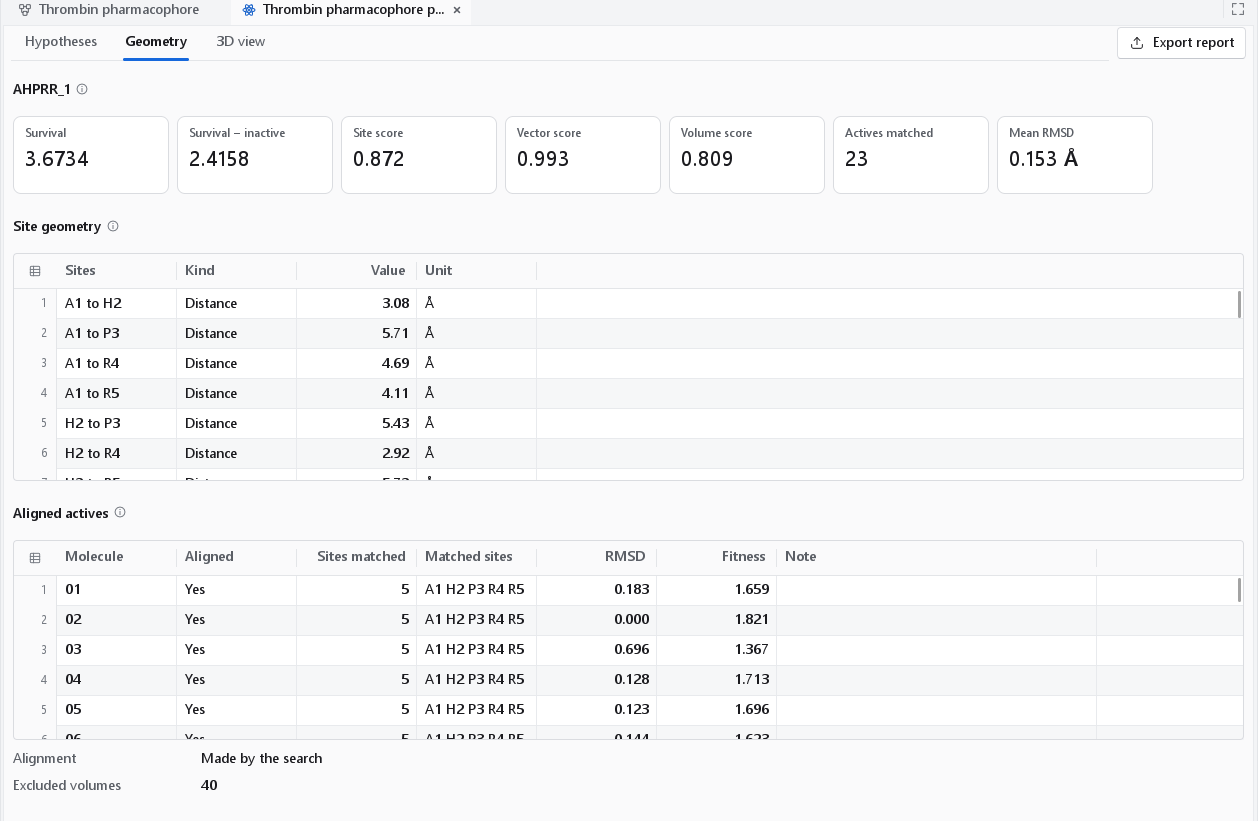
The Geometry tab gives every inter-site distance and every angle of the selected hypothesis, with the score cards above. Below them, Aligned actives lists how each active fits the hypothesis: whether it was placed, the number and the letters of the sites it matches, the site RMSD, the fitness and a note.
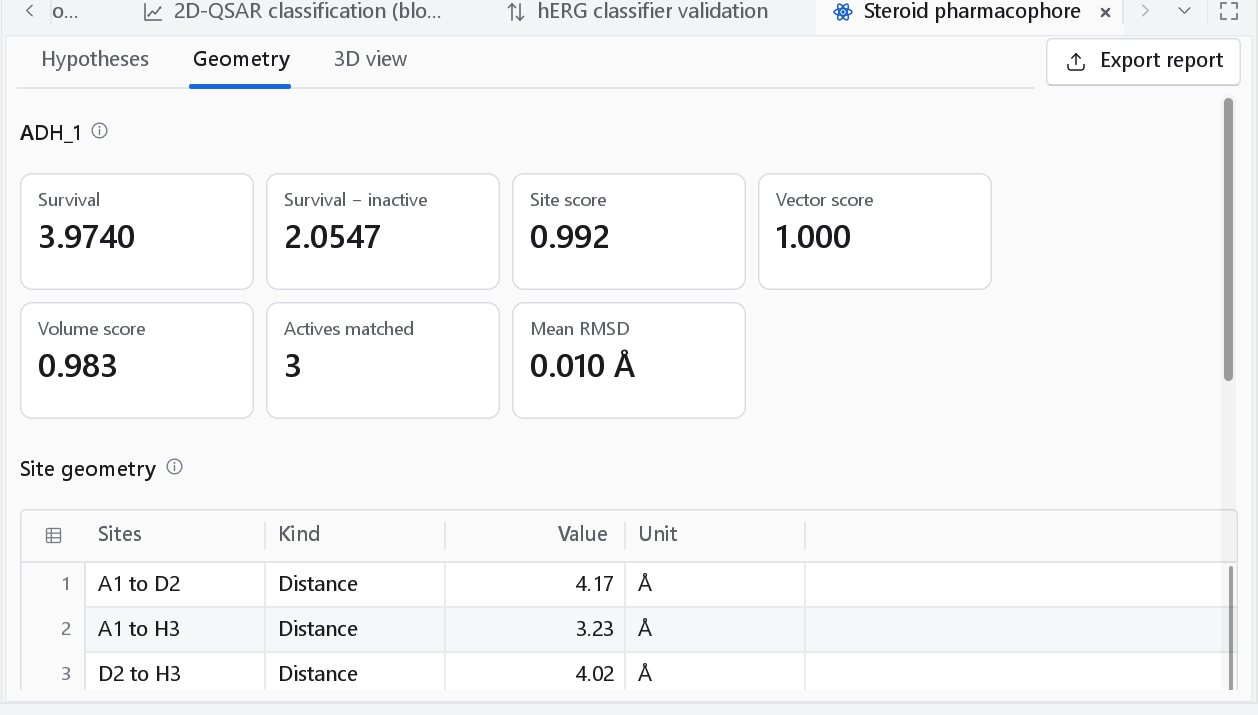
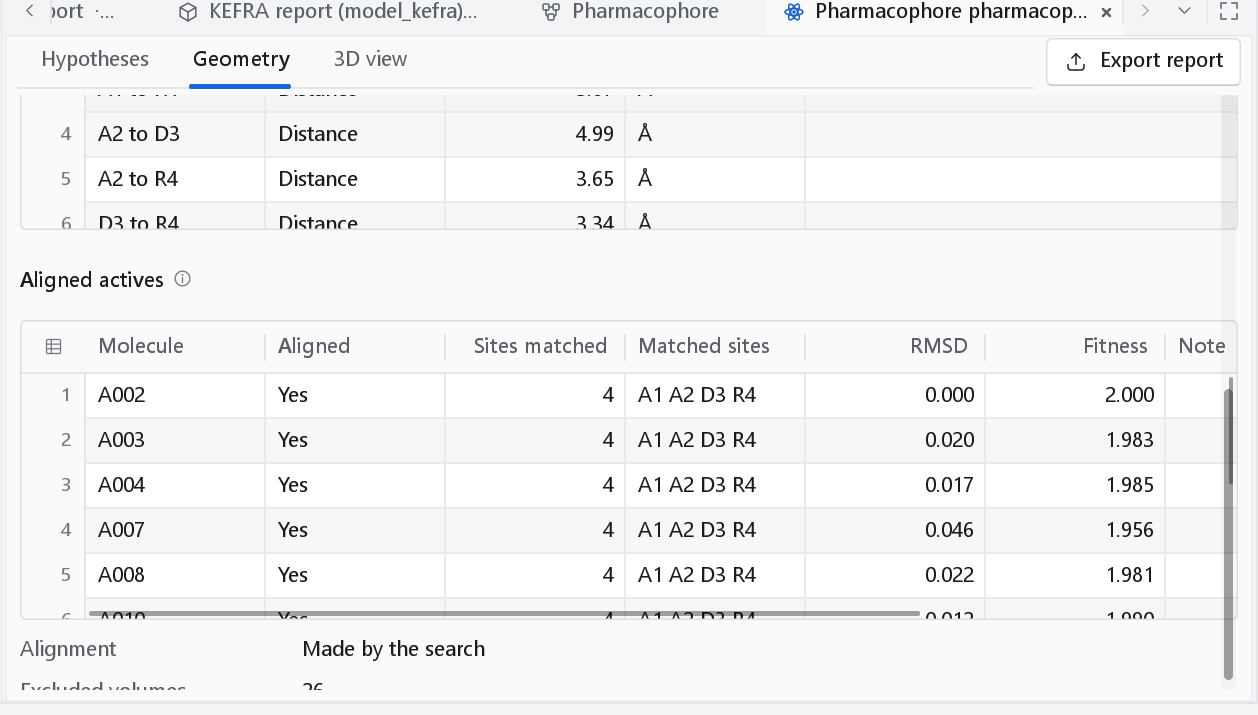
Fitness of an aligned active is w(site) x (1 - RMSD / 1.2 Å) + w(vector) x vector + w(volume) x volume: the score a screening run would give that compound. For the best hypothesis the table and the molecules of the 3D view are the alignment the search itself made. The search publishes that alignment for its best hypothesis only, so for any other hypothesis the actives are superposed in the dashboard; the line Alignment under the table says which of the two is shown.
Features per active
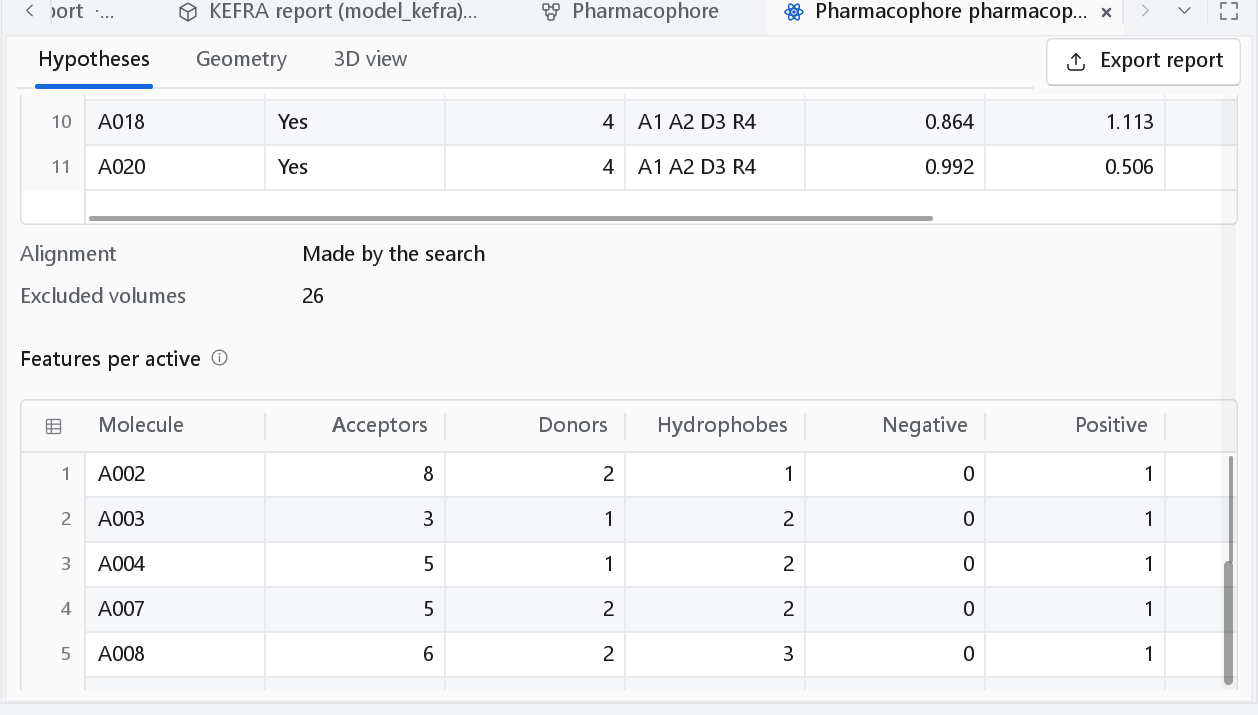
A hypothesis can only use features that every matching active has, so this table explains why a compound with no donor never matches a hypothesis with a D in it.
Excluded volumes
An excluded volume marks a region that inactive compounds occupy and active compounds leave empty: space the receptor is presumed to fill. The search itself does not produce them; the dashboard derives them from the aligned molecules by a rule of its own, after the idea of Dixon et al. (2006):
- The candidates are the heavy atoms of the aligned inactives that are at least 2.2 Å from every heavy atom of every aligned active.
- The candidates are grouped by leader clustering with a radius of 1.6 Å, in a fixed order, so the result is deterministic.
- Each cluster becomes a sphere at its centroid, with a radius equal to the distance to the nearest active heavy atom minus 1.2 Å, limited to 0.9 to 1.6 Å. A sphere therefore never reaches into the actives.
- The clusters are ranked by the number of inactives that support them, and at most 40 are kept.
Without inactives, or when every inactive atom lies close to an active, there are none and the panel says so.
The 3D view
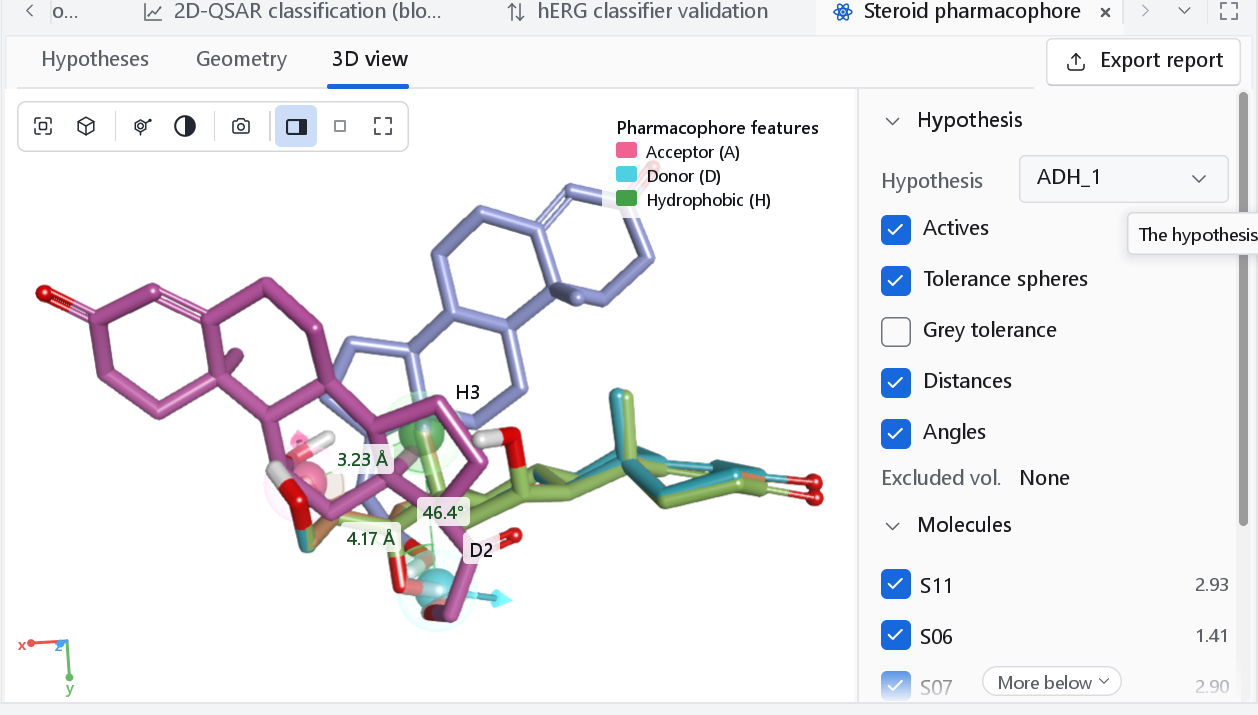
| Glyph | Feature |
|---|---|
| Pink-red sphere with an arrow | Hydrogen-bond acceptor and its direction |
| Cyan sphere with an arrow | Hydrogen-bond donor and its direction |
| Green sphere | Hydrophobe |
| Red sphere | Negative ionic |
| Blue sphere | Positive ionic |
| Orange ring | Aromatic ring, drawn in the ring plane |
| Translucent sphere around a site | The matching tolerance of the site |
| Teal sphere | Excluded volume |
| Control | Meaning |
|---|---|
| Hypothesis | The hypothesis shown, the same selection as the table. |
| Actives | The actives aligned onto the hypothesis. |
| Tolerance spheres, Grey tolerance | The tolerance of each site as a translucent sphere; grey tolerance draws them in neutral grey, which leaves the colour to the feature glyphs and reads better in print. |
| Distances, Angles | Lines and values of every inter-site distance; the first three inter-site angles. |
| Excluded volumes | The spheres described above; Excluded vol.: None when there are none. |
| Molecules | One box per aligned active, with its fitness, to show or hide it. |
| View, Annotations | As in every 3D view; see The 3D workspace. |
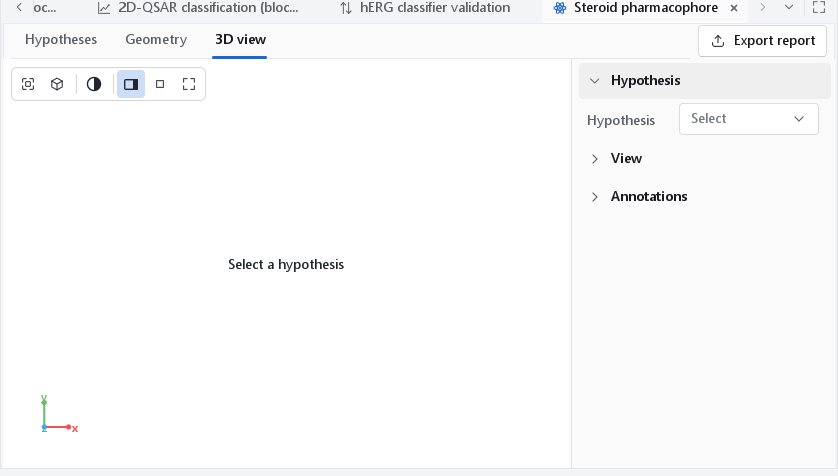
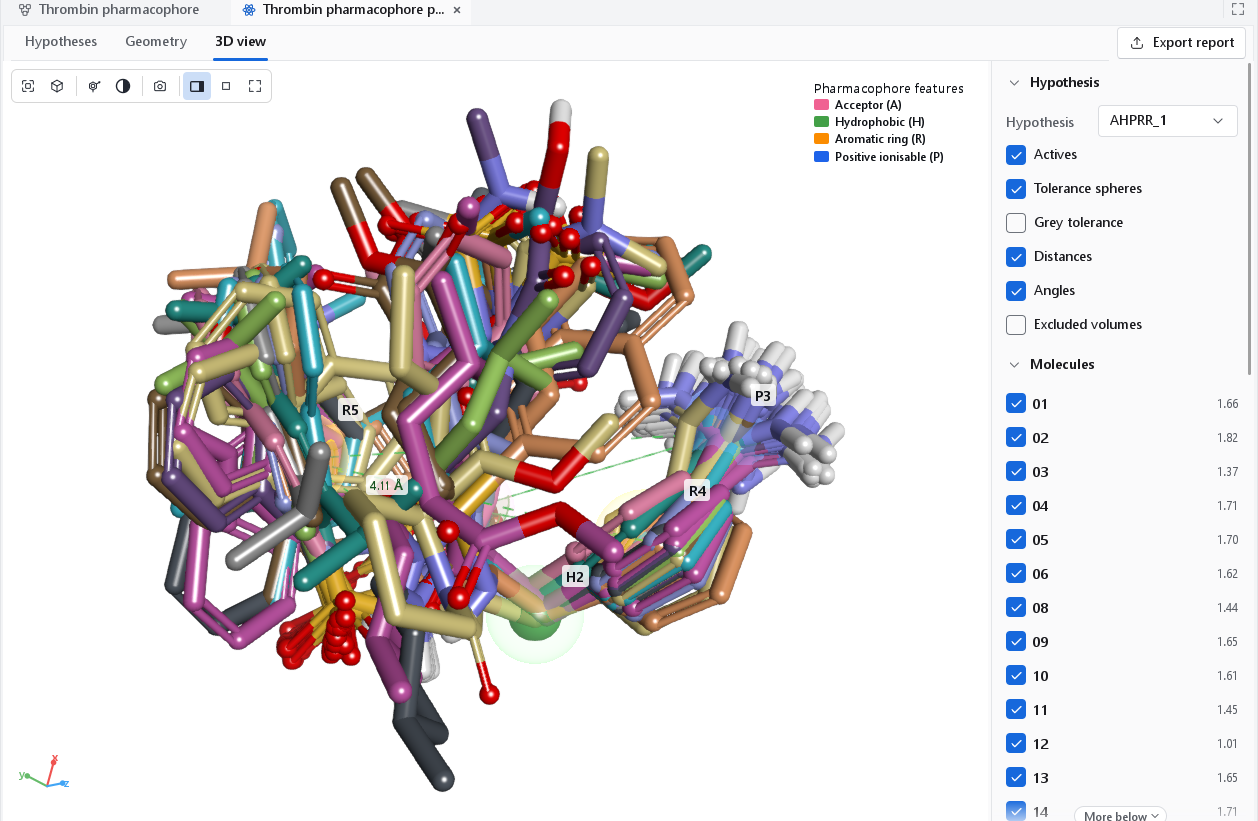
Figures
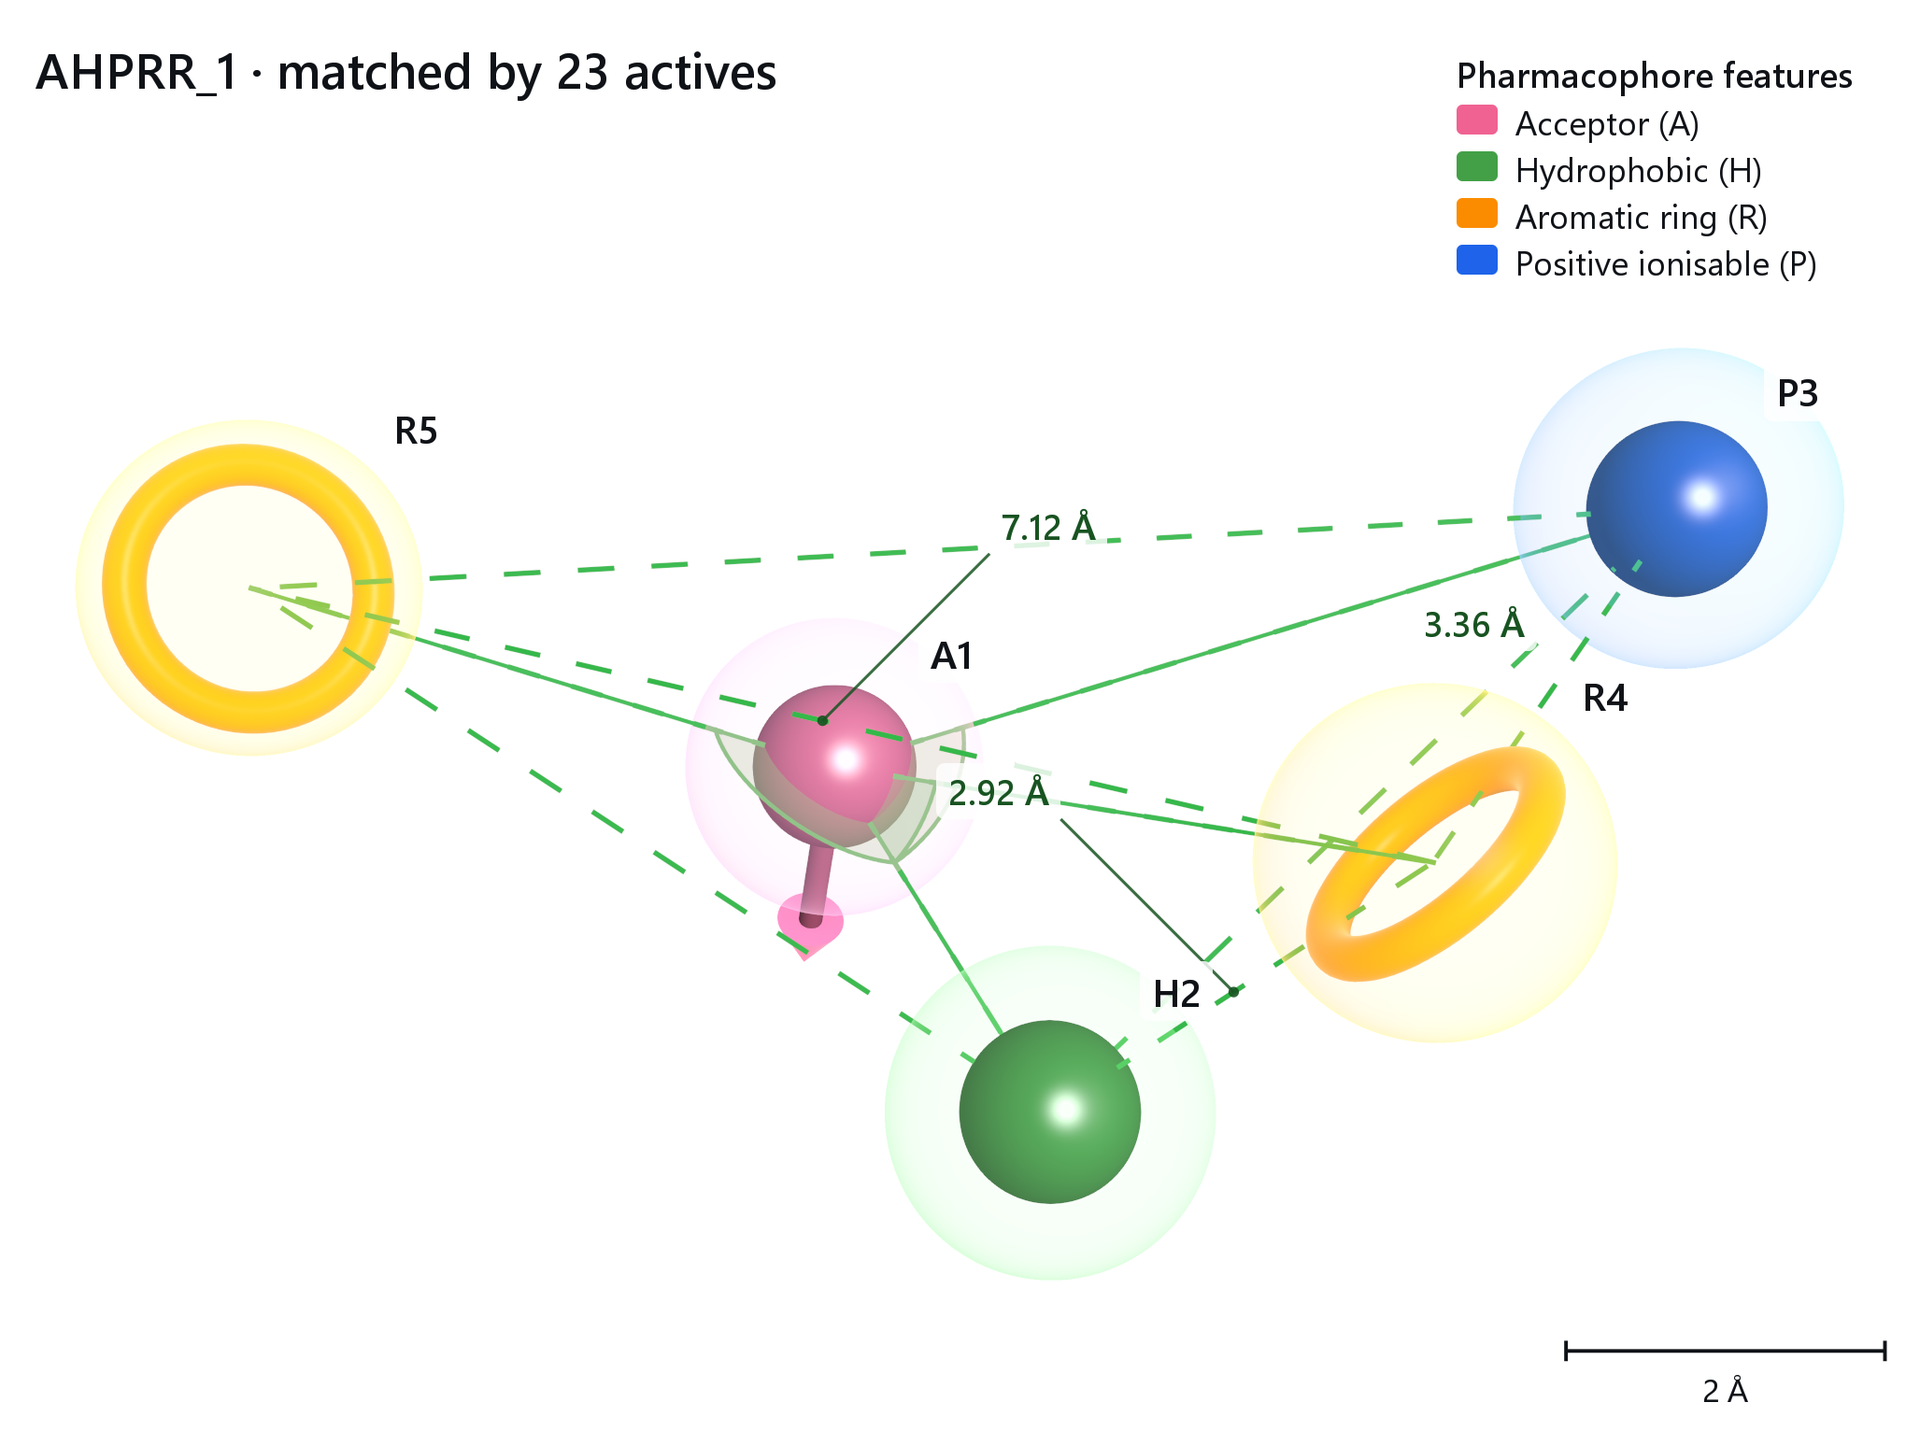
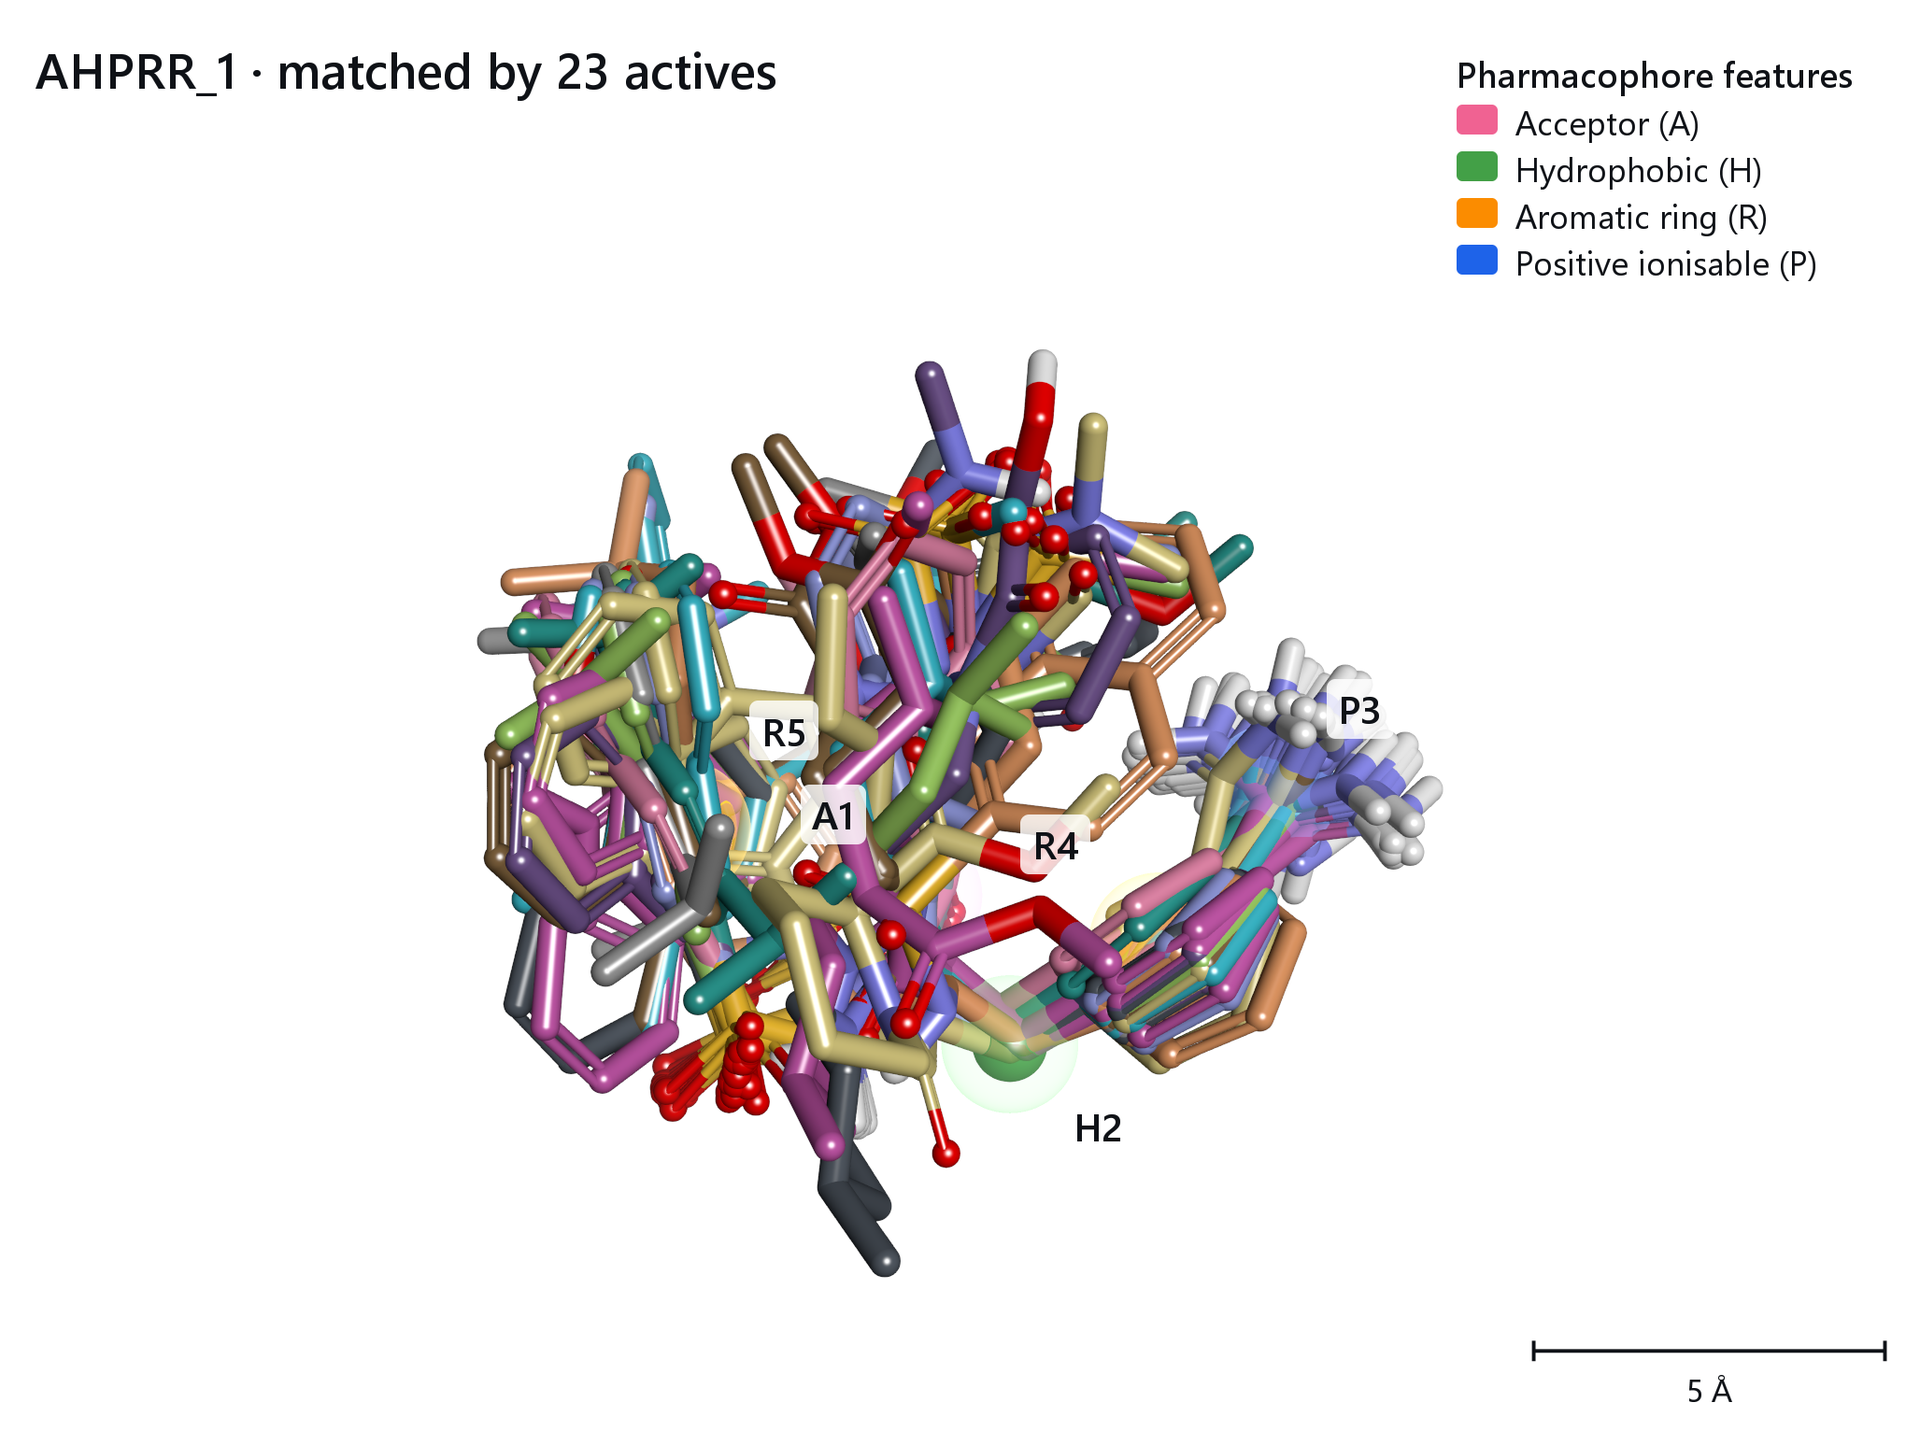
Both were made with the camera button of the 3D view (see Publication figures). A figure of the hypothesis alone, with its distances, is what a reader needs to use the hypothesis; the overlay of the actives shows how well it is supported.