Comparing models
The automated model search and its leaderboard: what is compared, on which statistic, and why the figures to quote come from a test set the search never saw.
There are two ways to compare models. Custom on the Model page of the 2D-QSAR wizard fits several models you choose on the same descriptors and the same split, each with its own dashboard, so their acceptance criteria can be read side by side (see The 2D-QSAR wizard). Automatic model search chooses for you: it fits many candidates, model families combined with descriptor subsets, over several internal training and test splits, ranks them and validates the winner. Its result opens in the model comparison dashboard described here.
What the search does
Choose the recipe Automatic model search on the Model page of the wizard (regression only), or open the Automatic model search workflow template. The workflow first sets a test set aside with its own split node (a stratified fifth of the compounds in the wizard). Only the remaining training compounds enter the search:
- The training compounds are divided into an internal training and test part, three times by default (Training/test splits), with a quarter held out each time and the splits stratified by activity.
- In every split, every descriptor subset is computed on the internal training part only: all descriptors, the correlation-filtered block (one of every pair above r = 0.95 removed) and the 20 descriptors with the highest mutual information with the response.
- For every subset, every model family is tuned by cross-validation on the internal training part (Tuning iterations settings tried), refitted with the best setting and scored on the internal test part. A forest is tuned with 100 trees and refitted with 500.
- The statistics of each candidate are averaged over the splits and the candidates are ranked by a composite score. With Stop dominated candidates only the better half continues after each split.
- The best candidate is refitted on all training compounds; the best three also form a consensus model (Consensus members).
- The winner is validated once on the test set that was set aside in the first step.
| Task | Model families searched |
|---|---|
| Regression | PLS, ridge regression, random forest, gradient boosting, support vector regression (RBF kernel), k nearest neighbours |
| Classification | Logistic regression (L2), linear discriminant analysis, random forest, gradient boosting, support vector classifier (RBF kernel), k nearest neighbours |
Six families and three subsets give 18 candidates. The search spaces of the hyper-parameters are scaled to the number of compounds and descriptors.
The composite score
The candidates are ranked by
S = 0.4 mean(test score) + 0.3 mean(CV score)
    - 0.1 |mean(training score) - mean(test score)|
    - 0.1 sd(test score) + 0.1 (1 - mean(normalised test error))
where the scores are R2 for regression (with the normalised error RMSE(test) / SD(training response)) and MCC for classification (normalised error 1 - balanced accuracy). The score rewards a candidate that predicts its internal test parts well, cross-validates well, does not overfit and is stable from split to split. The formula and its weights are GeinQSAR definitions, in the spirit of published automated QSAR builders (Dixon et al., Future Med. Chem. 8:1825, 2016) but not a published method; they are written into the provenance of every run, so a result can always be re-ranked.
Why the test set is not used for choosing
The internal test parts of the splits take part in ranking the candidates. The mean test score of the winner is therefore one picked from 18 noisy estimates, and it is optimistic by construction: it was selected for being high (Cawley and Talbot, J. Mach. Learn. Res. 11:2079, 2010). An honest estimate of how the winner predicts new compounds needs compounds that played no part in the search. That is the test set set aside before it.
Rows marked Test or External therefore never enter the search or the final fit. The Automatic model search node has a parameter Fit on test rows too, off by default, under Search options. Switched on, the test rows are searched and fitted like training rows; they are then no external set, every statistic computed on them describes compounds the model was fitted on, and the node, the leaderboard, the validation, the prediction and the report say so in capitals. Leave it off. The rows the search and the final model were fitted on are stated in the log, in the last column of the leaderboard table and in the model bundle.
The model comparison dashboard
The dashboard has two tabs, Leaderboard and Charts, and Export report. The inspector shows the number of candidates, the statistic the chart ranks by, the winner and its held-out statistics.
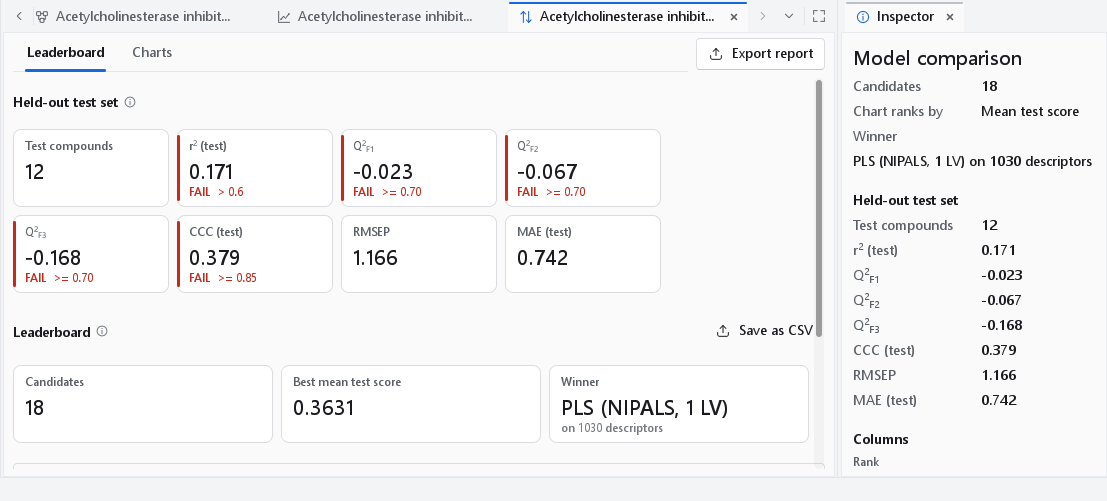
Held-out test set shows the statistics of the winner on the compounds set aside before the search: the number of test compounds, R2 (test), Q2F1, Q2F2, Q2F3, CCC, RMSEP and MAE for regression; accuracy, balanced accuracy, MCC, Cohen kappa and ROC AUC for a classifier. They come from the validation node that follows the search. A workflow that runs the search on all its compounds has no such figures, and the section says "No held-out test set: set one aside before the search to validate the winner".
| Leaderboard column | Meaning |
|---|---|
| Rank, Model | The place of the candidate and its model family. |
| Composite score | The score the candidates are ranked by, as defined above. |
| Mean test score, SD of test score | Mean and standard deviation of the score on the internal test parts over the splits. |
| Mean CV score | Mean cross-validated score inside the internal training parts. |
| Mean training score | Mean score on the internal training parts. A large gap to the test score is overfitting. |
| Descriptor subset, Descriptors | How the descriptors of the candidate were chosen, and how many it uses. |
| Splits, Fits, Time (s) | The splits the candidate was scored on (fewer when it was stopped early), the number of model fits, and the time it took. |
| Fitted on | The last column: which rows the search and the final model were fitted on. |
Save as CSV at the right of the leaderboard heading writes every candidate with all its columns.
Charts
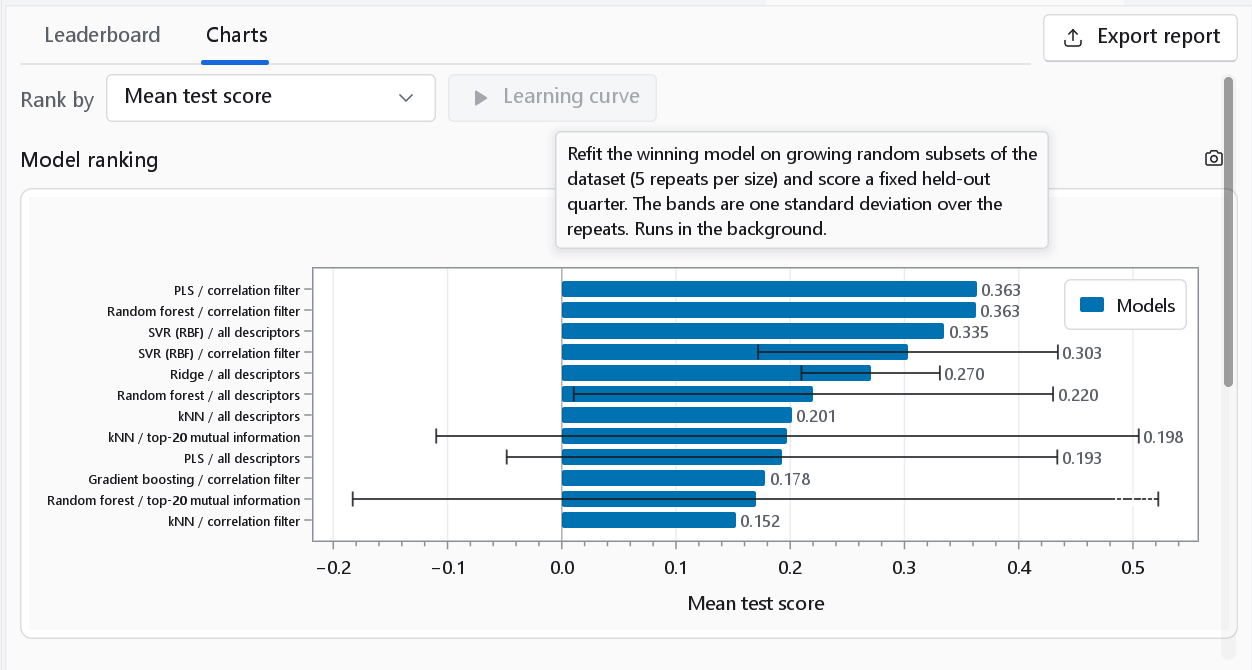
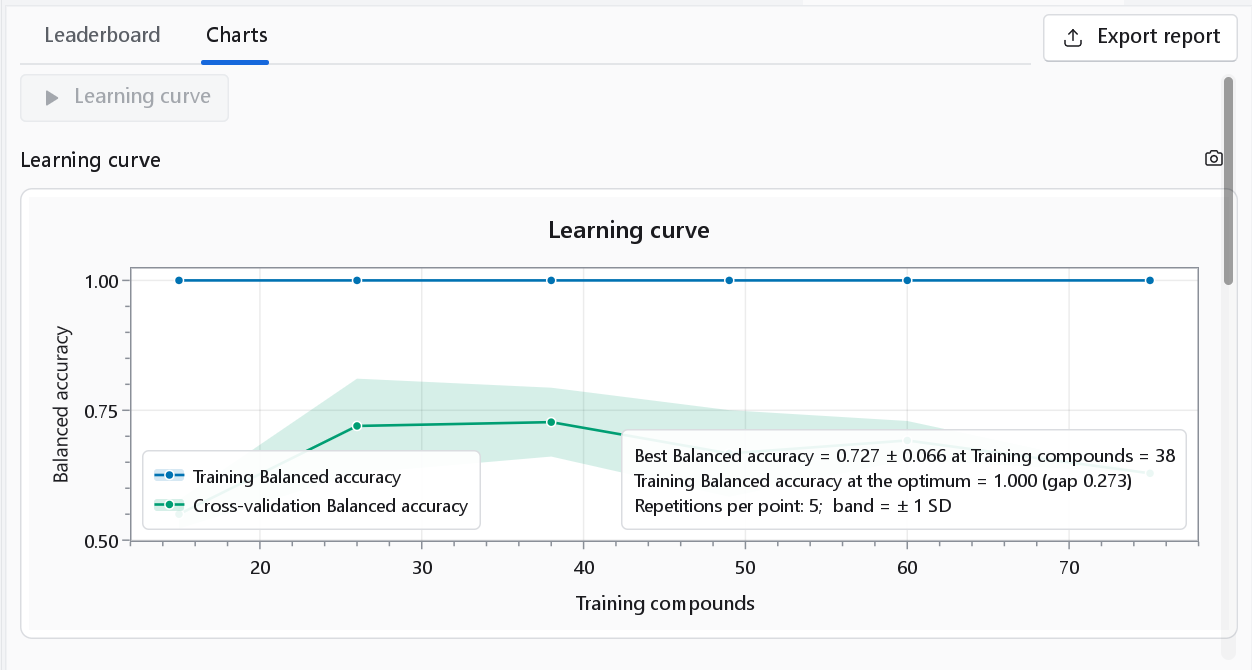
Rank by chooses the statistic of the Model ranking chart: one bar per candidate with its spread over the splits. Learning curve computes the learning curve of the winning model when you press it; it runs in the background. For a classifier the tab also shows the ROC curve and the confusion matrix.
Learning curve
- A quarter of the rows is held out once, with a fixed seed. These rows are never used for fitting.
- For each training fraction (20 %, 35 %, 50 %, 65 %, 80 % and 100 % of the remaining rows), five random subsets of that size are drawn.
- The model is refitted on each subset and scored on the subset itself (training score) and on the held-out quarter (validation score).
- The chart shows the mean and the spread of both scores against the training-set size.
The score is R2 about the mean of the held-out rows for regression and balanced accuracy for classification. A validation curve that still rises at the right edge says that more compounds would help; a large, persistent gap between the two curves says that the model overfits (Perlich, "Learning Curves in Machine Learning", Encyclopedia of Machine Learning, Springer 2010). At least 12 usable rows are needed.
How to use the comparison
- Set a test set aside before the search, as the wizard and the template do, and quote its statistics.
- Treat the ranking as a short list. Candidates whose mean test scores lie within one standard deviation of each other are not distinguishable on this data.
- When a simpler candidate is close to the winner, prefer it: rebuild it with the Custom recipe of the wizard, which gives it the full validation of a single model, Y-randomisation and applicability domain included.
- On a small set the search adds little and costs much; one recipe with honest cross-validation is the better use of the compounds.