The library dashboard
The designed molecules as structures, as a scatter of activity against a property, as Pareto fronts, and as the ranked table behind all three.
The dashboard opens when a design finishes, and again whenever the workflow is run. It has four tabs, Library, Chart, Pareto and Table, and one Export report button at the right of the tab row. Every view reads the same ranked table, so the structure grid, the charts, the exported files and the report cannot disagree.
The status bar counts the molecules, how many lie inside the applicability domain and how many were selected for diversity. The inspector on the right names the scaffold, the predicted response, whether the interval is calibrated or not calibrated, the two domain counts, the number of Pareto fronts and the number of diverse picks.
Library
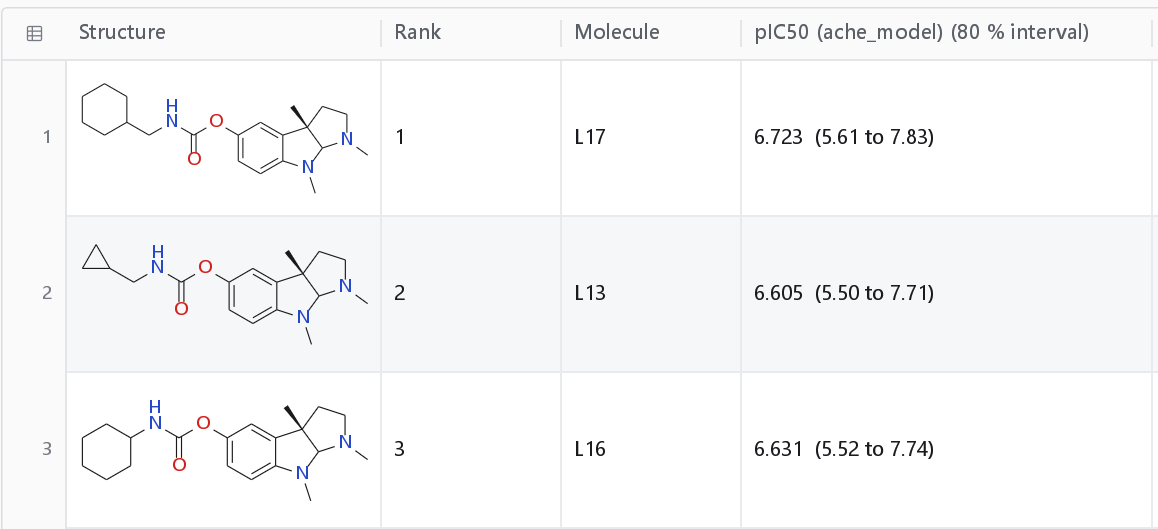
The structure grid shows the molecules in the order of the ranking, with the rank, the identifier, the prediction and the domain verdict under each structure. The heading of the prediction column is the column the model writes, followed by the coverage of the interval when one was calibrated, and each cell then reads as the value with its interval, for example 7.12 (6.01 to 8.23). The domain column reads In domain or Outside domain.
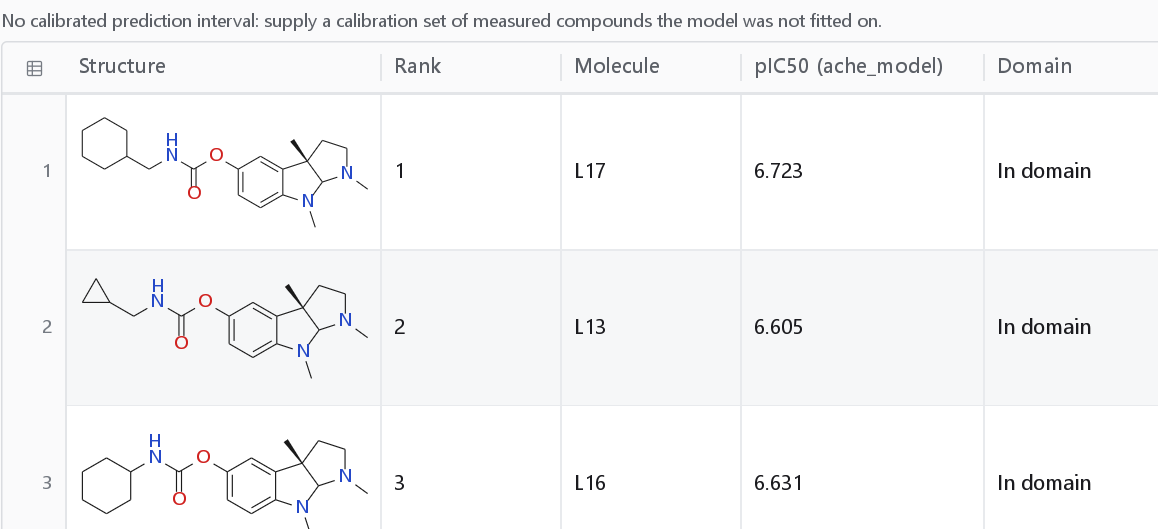
Without a calibration set the tab states it: No calibrated prediction interval: supply a calibration set of measured compounds the model was not fitted on. A design that produced no molecule says that too, rather than showing an empty grid.
Chart
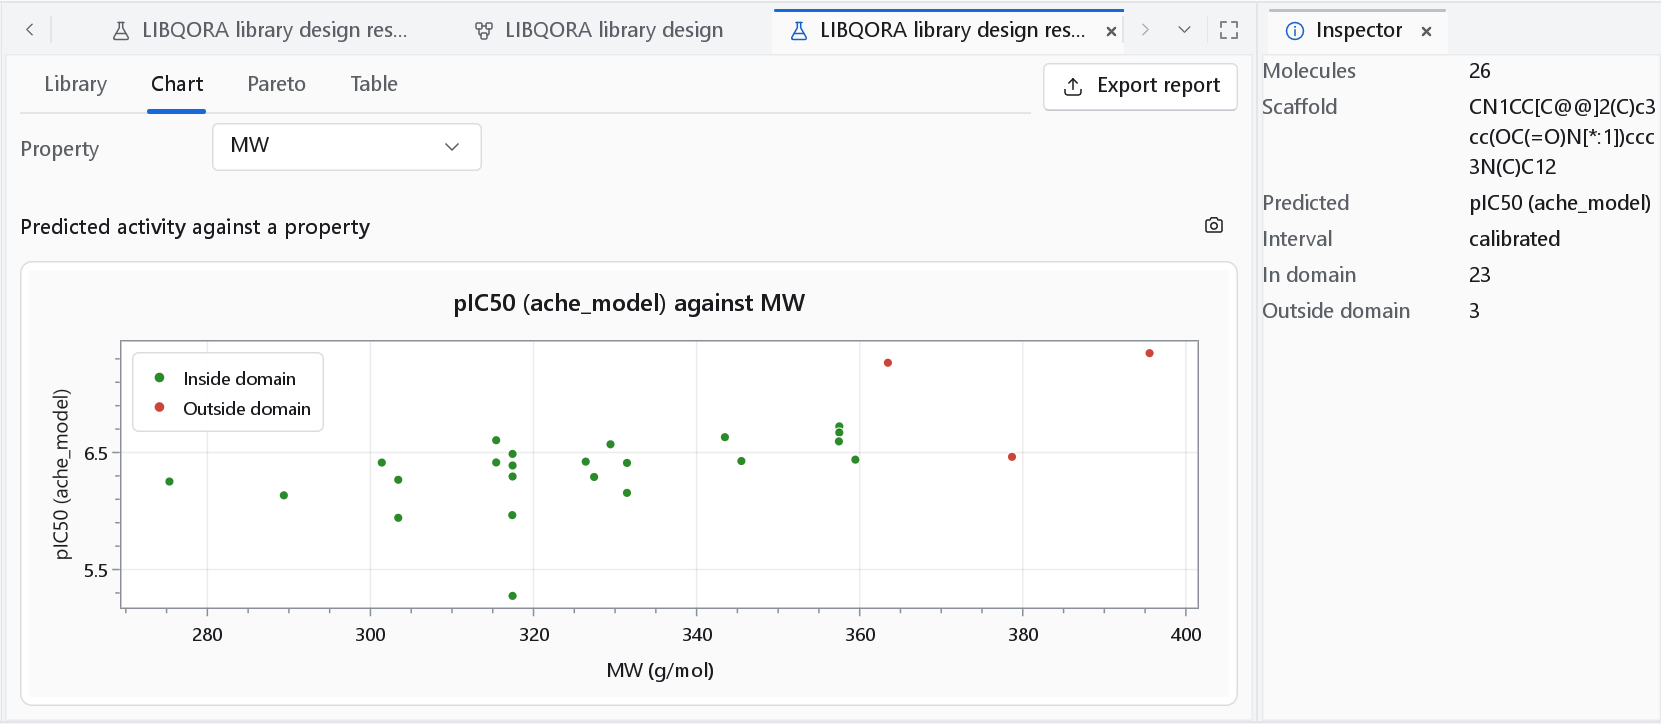
Property chooses what the predicted activity is plotted against, from every computed property of the library. The two series are Inside domain in green and Outside domain in red, the colour convention used throughout the program: green for favourable, red for unfavourable. A selection in the chart is a selection in the other tabs.
A design ranked on computed properties alone has no predicted activity to plot, and the tab says so rather than drawing an empty pair of axes.
Pareto
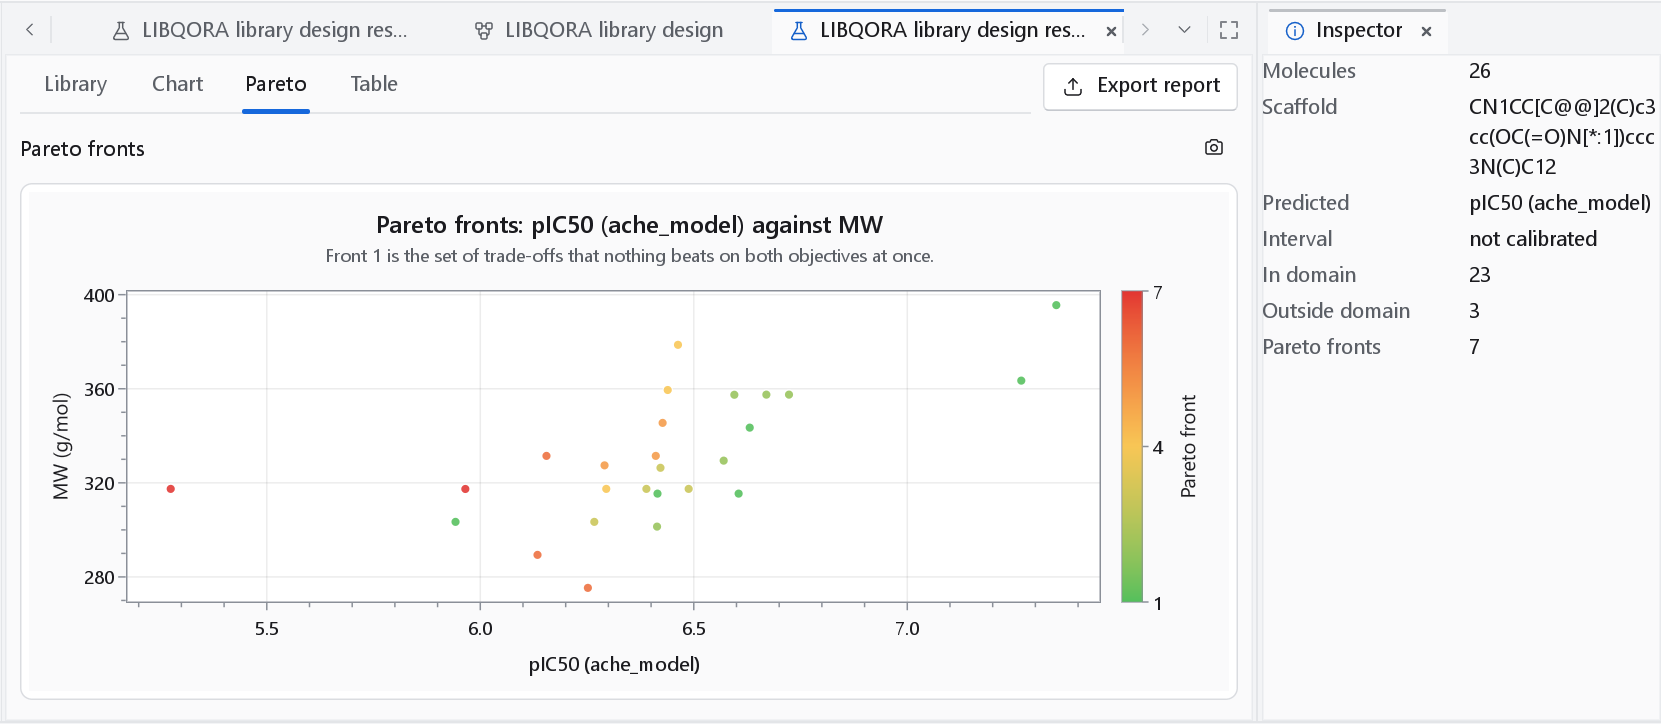
The tab is drawn when the ranking was by Pareto fronts and at least two objectives vary. The colour bar is the front number, and the subtitle says what a front is. A library ranked by desirability, or with one objective only, says so instead: the fronts of a single objective are its sort order.
Table
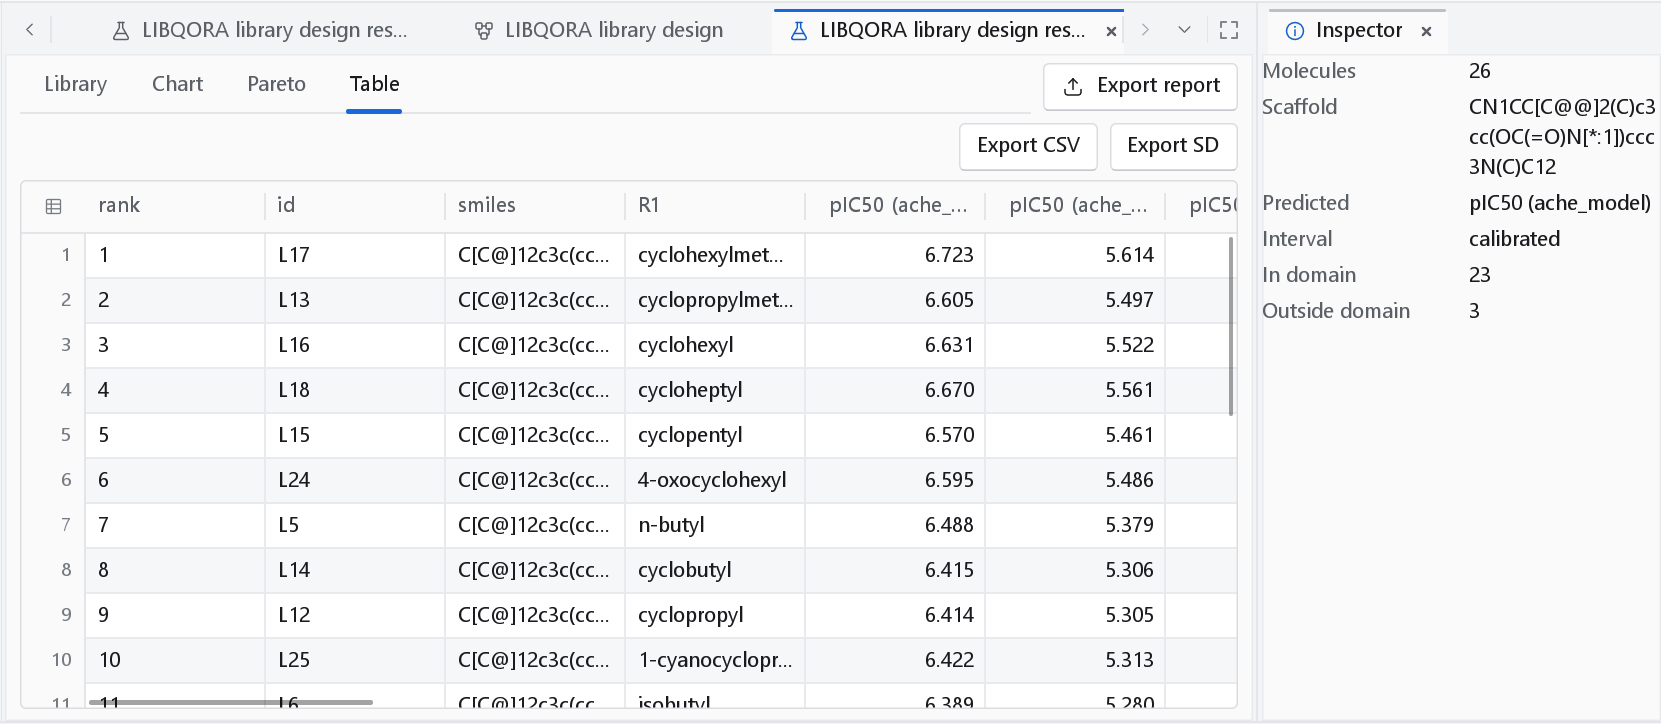
The table holds, in this order: the rank, the identifier and the SMILES; one column per attachment point, headed R1, R2 and so on, naming the substituent that was put there; for each model the predicted value, the two ends of its prediction interval, its standard error, whether the compound is in the domain and the reasons when it is not; the computed properties QED, synthetic accessibility, molecular weight, log P, polar surface area, rotatable bonds, donors, acceptors, heavy atoms, the fraction of sp3 carbon and the similarity to the training set; the PAINS and unwanted-group verdicts; the desirability; the Pareto front and the crowding distance when the ranking used fronts; whether the molecule is in the domain overall; and the diverse pick when a selection was made.
Export CSV and Export SD write the table and the structures. The CSV holds every column at round-trip precision; the SD file carries the results as data fields.
The report
Export report writes the report of the library as PDF, Word or Excel, through the dialog described in Reports and export. Besides the usual sections it carries a Designed library chapter with the whole ranked table, the verdict of every filter on every compound, the two charts, and a structure grid of the designed compounds in the order of the ranking, each with its rank, its predicted value and its interval, coloured green inside the applicability domain and red outside it. The grid shows the first 120 compounds and says so; the Excel workbook and the ranked table hold them all.
What the report does not do is turn a prediction into a measurement. The honest reading of a designed library is in Accuracy and validation: a model that predicts a measured test set to within a few tenths of a log unit predicts a designed analogue no better than that, and often worse, because the analogue is further from the training set than any test compound was.