The molecule spreadsheet
The central view of a dataset: one row per compound with its structure, identity, set and values, and the tools to sort, filter, search, edit and select.
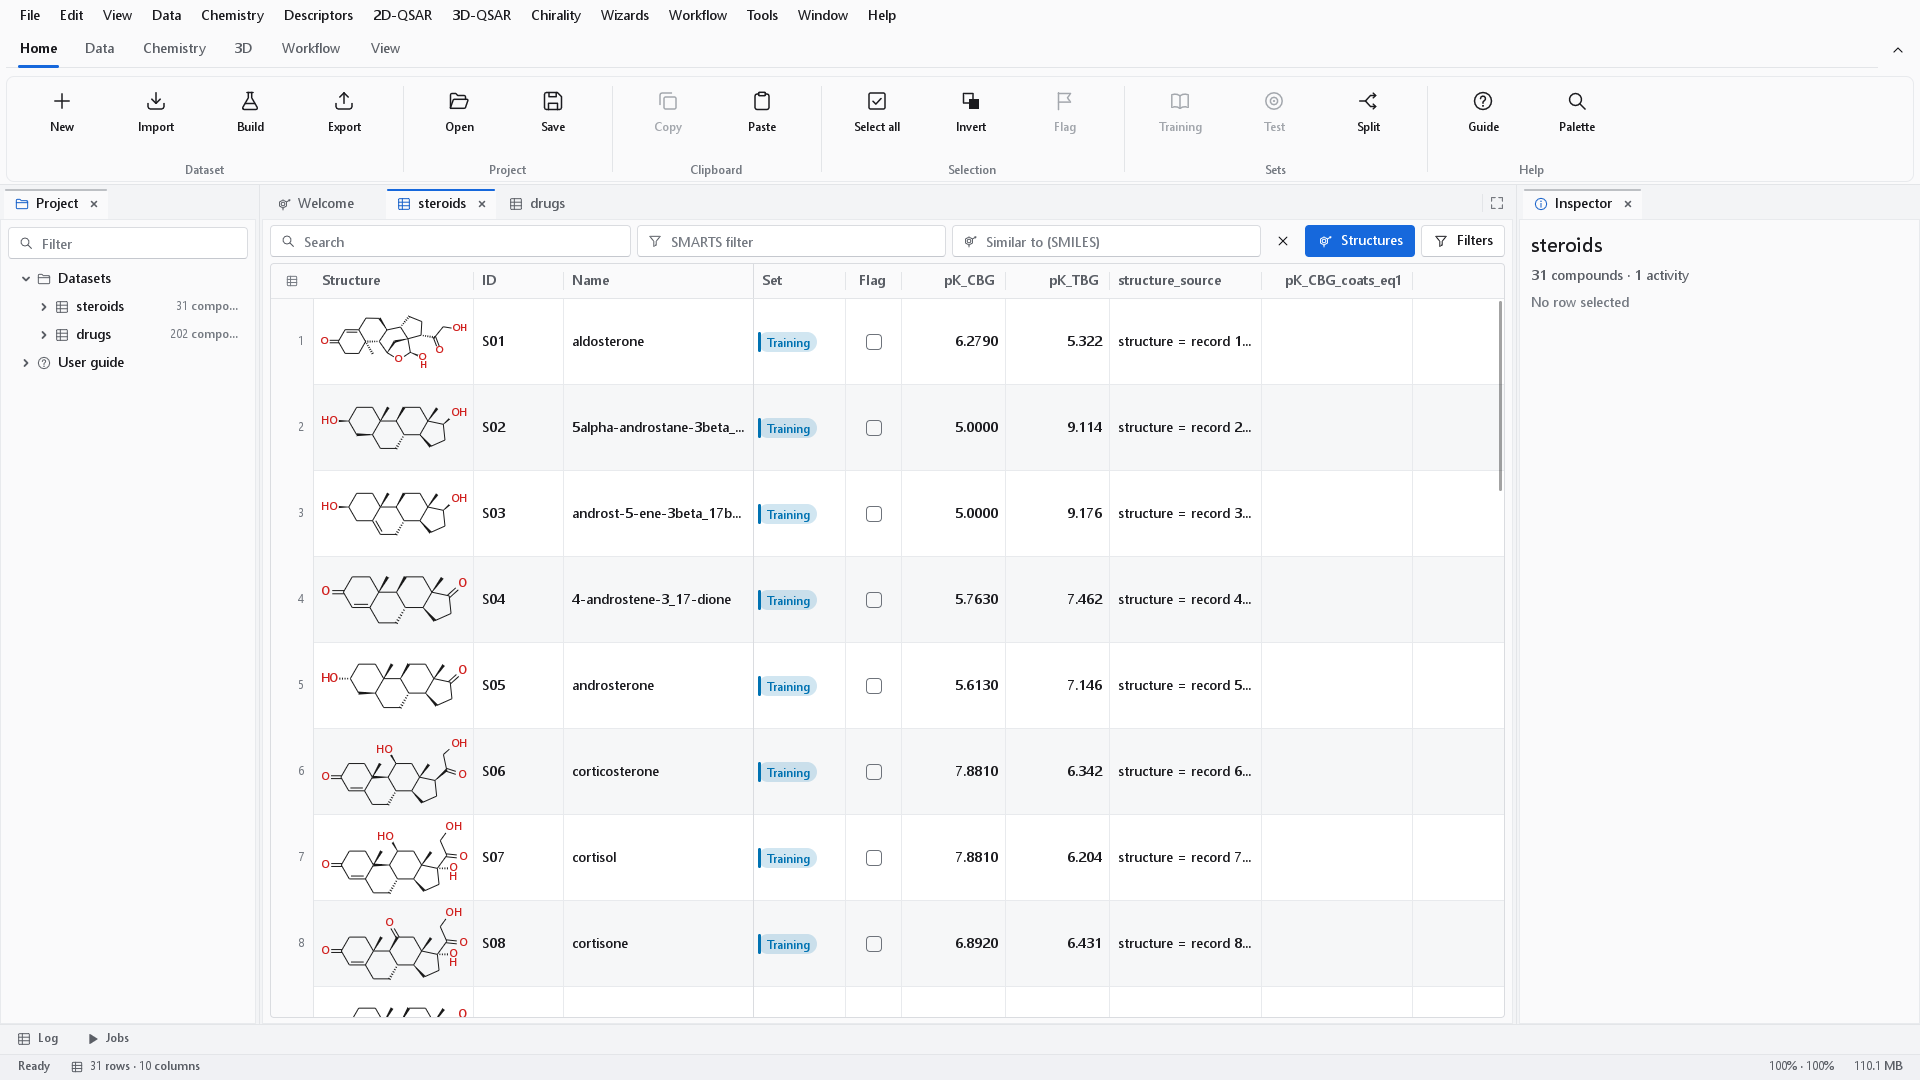
Every dataset opens as a spreadsheet. It draws the structure of every compound, holds its name, identifier, set and flag, and has one column for each activity, imported property, descriptor and formula. Only the rows on screen are drawn, so a table of a hundred thousand compounds scrolls as smoothly as one of thirty.
The columns
| Column | Content | Editing |
|---|---|---|
| Structure | The 2D depiction, with wedges for stereocentres. A red cross marks a row without a valid structure. | Double-click to edit the structure in the sketcher. |
| ID, Name | The identity of the compound. | In place. |
| SMILES | The canonical SMILES. Hidden by default; show it with Data > Columns. | Follows the structure. |
| Set | Training, Test, External or Excluded as a coloured chip (blue, vermilion, green, grey, from a palette that colour-blind readers can tell apart); empty when unassigned. | Through the set commands, the Inspector or the context menu. |
| Flag | A free mark, for outliers, compounds to re-measure or to discuss. | Click the box, or Toggle flag. |
| Activity | The measured response, with its unit in the tooltip of the header. | In place. |
| Imported | Every other column of the file. | In place. |
| Descriptors | Computed columns, grouped by family in the Project panel. | Read only; recompute after a structure changes. |
| Formula | Columns computed from other columns (see Formula columns). | Through the formula editor. |
| Match, Similarity | Added by the SMARTS filter and the similarity search. | Read only. |
To edit a cell, double-click it, press Enter or F2, or simply start typing on the selected cell. An edit recomputes the formula columns at once. There is no undo in the spreadsheet, so save the project or export the dataset before a large change.
Order, width and freezing
The order of the columns is their order everywhere: in the column manager, in the Project panel and in an exported file. Drag a header to move a column. Drag the right edge of a header to change the width, double-click the edge to fit it to the content, or use Data > Auto-fit columns for all of them. The identity columns at the left (Structure, ID and Name) stay in view while you scroll sideways; Freeze up to here in the header menu moves that boundary, and Unfreeze columns removes it.
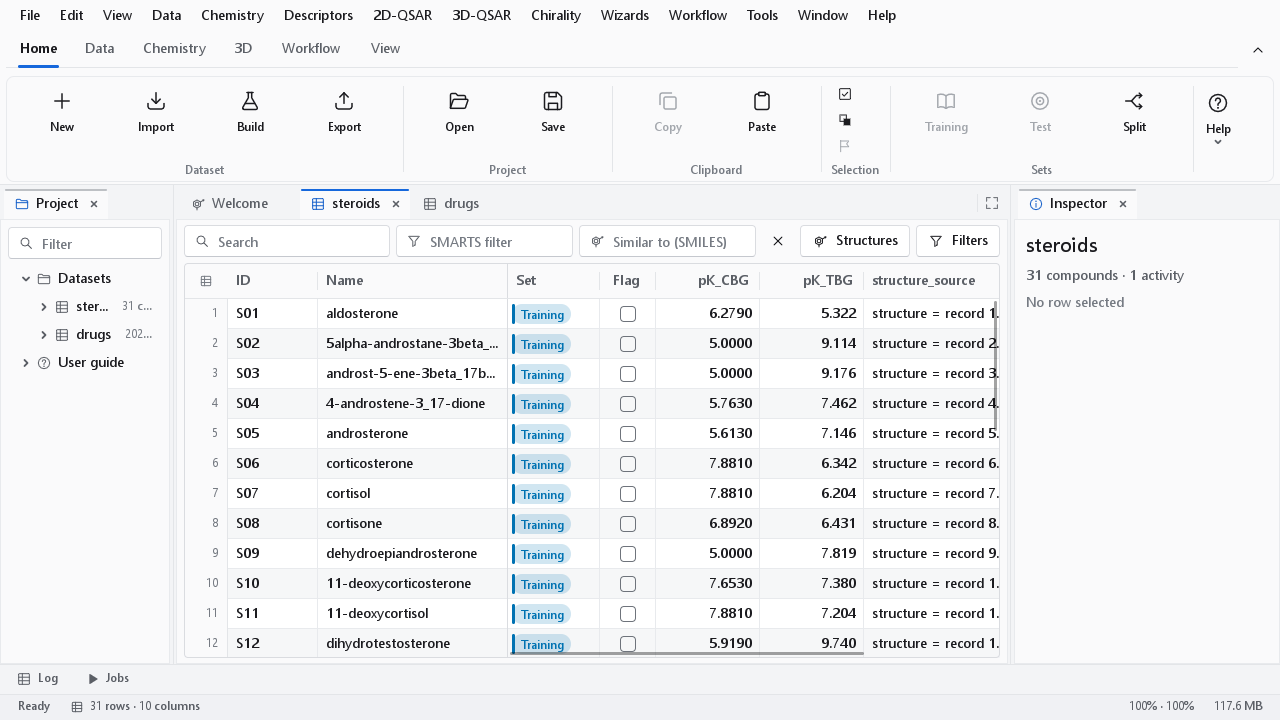
Structures in the toolbar (or View > Show structures) hides the drawings and shrinks the rows, so that about three times as many fit on the screen. Use it to scan values; the structures return with the next click.
Sorting
Click a header to sort by it: the first click sorts ascending, the second descending, the third removes the sort. Hold Shift while clicking another header to add it as a second key, for example the set first and the activity within each set. Text is sorted in natural order, so that C2 comes before C10. The header menu offers Sort ascending, Sort descending and Clear sort. Sorting never changes the stored order of the rows.
Selecting rows
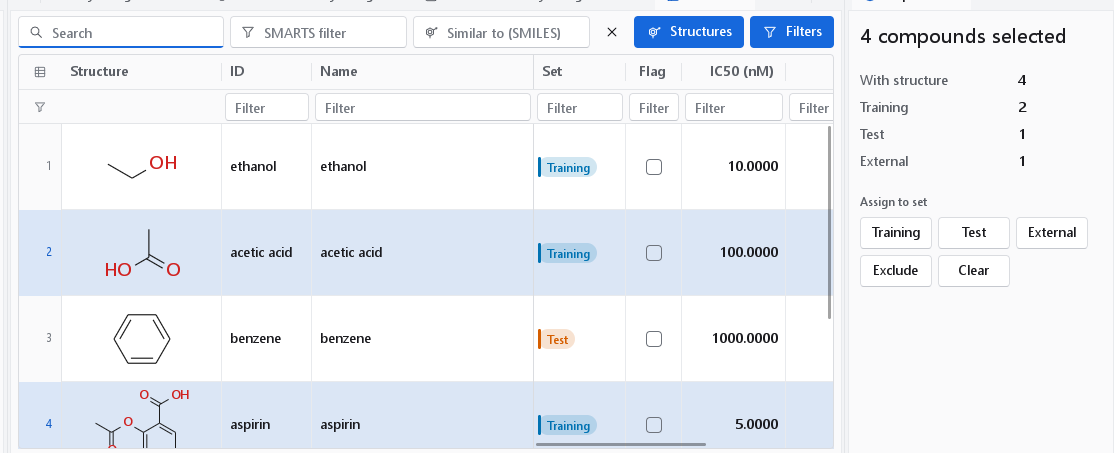
Click a row to select it, Ctrl+click to add or remove one, Shift+click to select a range. Edit > Select all (Ctrl+A) selects every row the table shows, which with a filter active means the rows that pass it; Invert selection (Ctrl+Shift+A) works on the same rows, and Ctrl+D clears the selection. A click on a set in the Project panel selects its rows.
The selection belongs to the dataset, so it is shared with the 3D workspace and the Inspector: select compounds in the table and the 3D view shows the same ones. The program never selects rows by itself; an import, a paste or a calculation leaves the selection as it was, and deleting rows leaves nothing selected.
Search and filters
| Tool | What it does | When to use it |
|---|---|---|
| Search (Ctrl+F) | Keeps the rows in which any visible column contains the text, as you type. | To find a compound by name or ID. |
| SMARTS filter | Keeps the compounds that contain a substructure. Applied with Enter or when the box loses focus. Adds a Match column. | To look at a chemotype: all carboxylic acids, all compounds with a basic amine. |
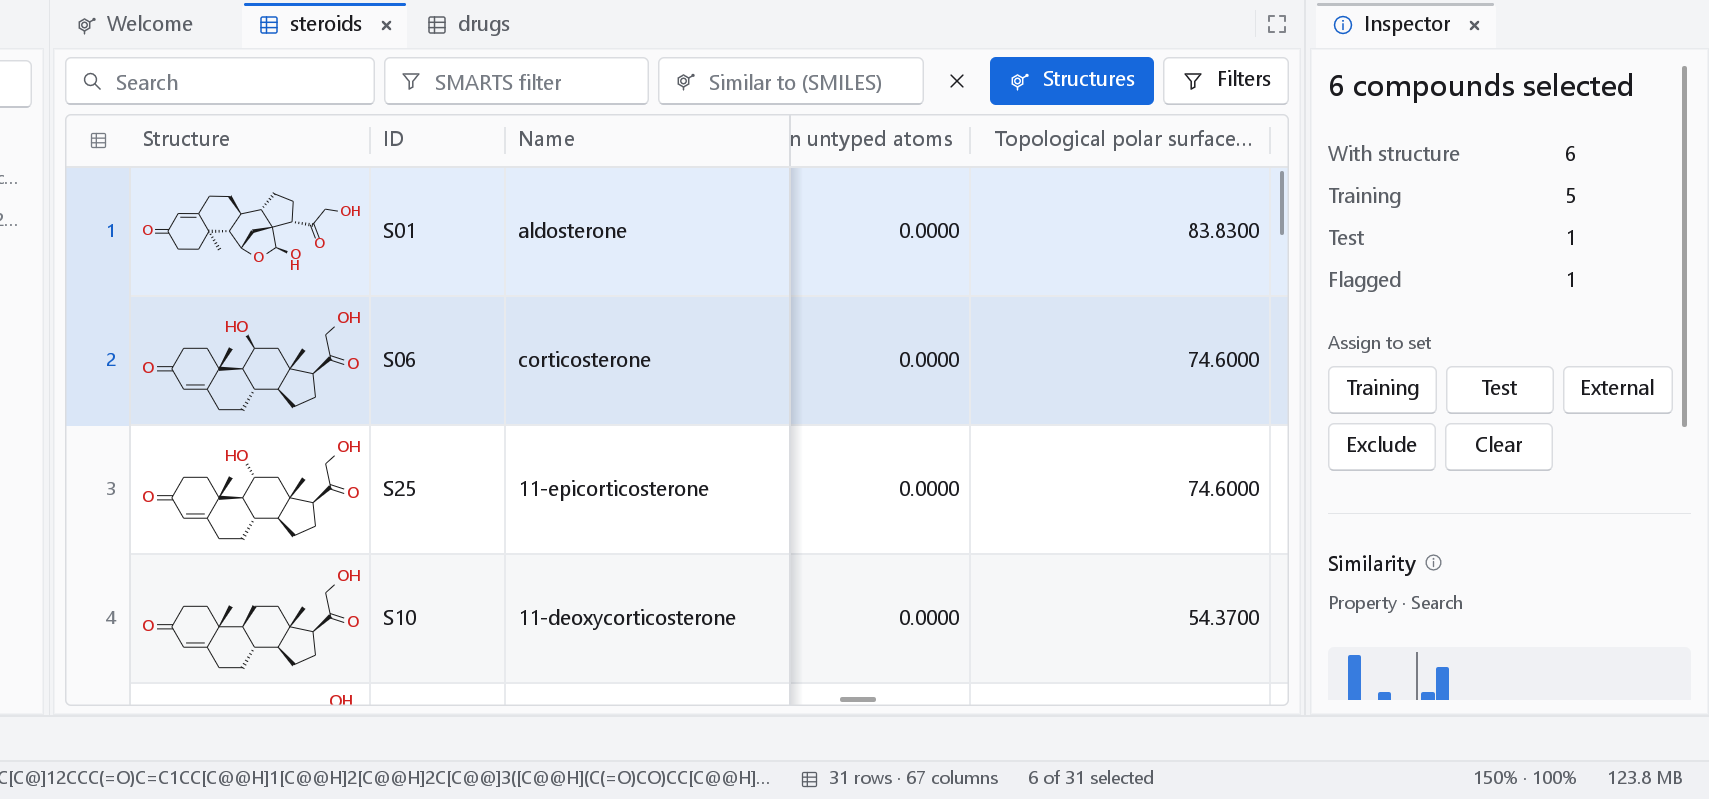
| Similar to (SMILES) | Adds a Similarity column, the Tanimoto coefficient on ECFP4 fingerprints of 1024 bits, and sorts the table with the most similar compound first. Applied with Enter. | To find the near neighbours of a query, for example the analogues of a new hit. |
| Filters | Shows a filter row under the headers, one box per column. | To restrict by value: pIC50 above 7, MW between 300 and 500, no missing logP. |
| Clear button (the cross) | Clears the search, the SMARTS filter, the similarity query and every column filter at once. Chemistry > Clear structure filters does the same. |
The filter row
Each box of the filter row takes an expression for its column. All boxes apply together.
| Expression | Keeps | Example |
|---|---|---|
| text | Values that contain it (any case) | sterone |
=text, !=text | Values equal, or not equal, to it | =S01 |
!text | Values that do not contain it | !acetate |
^text, text$ | Values that start or end with it | ^11-, one$ |
* and ? | A pattern over the whole value | S1? |
>, >=, <, <=, =, != with a number | Numbers compared with it | >6.5 |
a..b | Numbers from a to b inclusive | 5..7 |
empty, !empty | Missing, or present, values | !empty |
true, false (also yes/no, 1/0) | Ticked or unticked boxes, for Flag and Match | true |
Substructure filter
Type a SMARTS pattern and press Enter. The search runs in the background on every structure; the table then shows only the matches and the status bar says how many there are, for example "4 compounds match c1ccccc1". The Match column holds the result for every row, so it can be sorted, exported or used in a formula. An invalid pattern is reported in a notification and in the tooltip of the box. Emptying the box removes the filter.
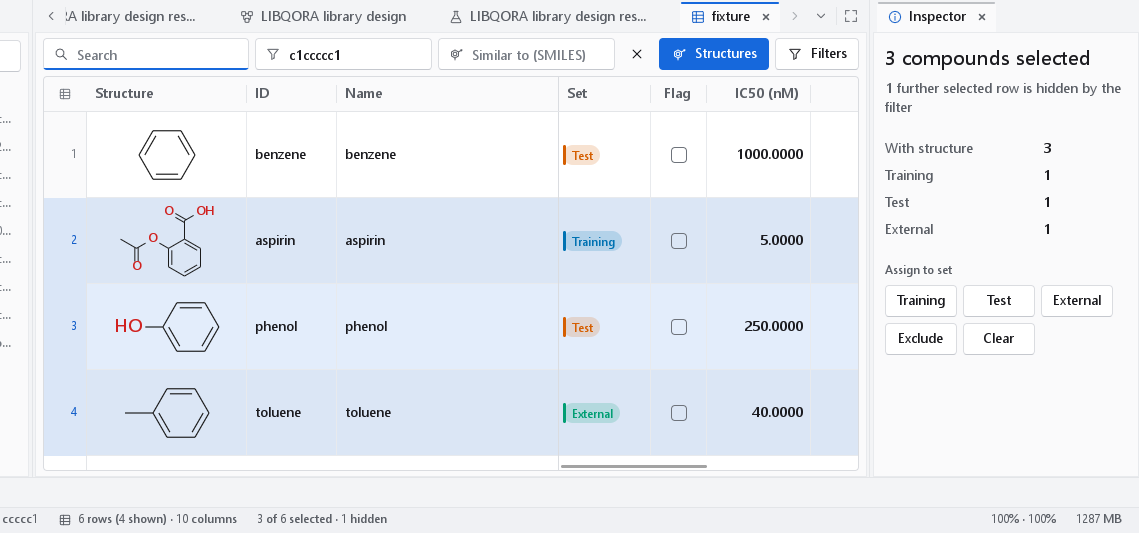
Useful patterns: C(=O)[OH] carboxylic acids, [NX3;H2,H1;!$(NC=O)] primary and secondary amines that are not amides, c1ccc2[nH]ccc2c1 indoles, [F,Cl,Br,I] any halogen, [OX2H] hydroxyl groups.
Similarity search
Type or paste a SMILES into Similar to (SMILES) and press Enter. The Similarity column is filled with values from 0 to 1, the table is sorted by it with the most similar compound first, and the Inspector shows the distribution. A Tanimoto coefficient on ECFP4 of about 0.4 or more usually indicates a related compound; identical structures score 1. The search does not filter; combine it with a filter on the Similarity column (>=0.4) to keep the neighbours only.
The context menu
Right-click a row for the commands on the rows, right-click a header for the commands on the column. A right click on a row that is not selected selects it first, so the menu always acts on what you see highlighted.
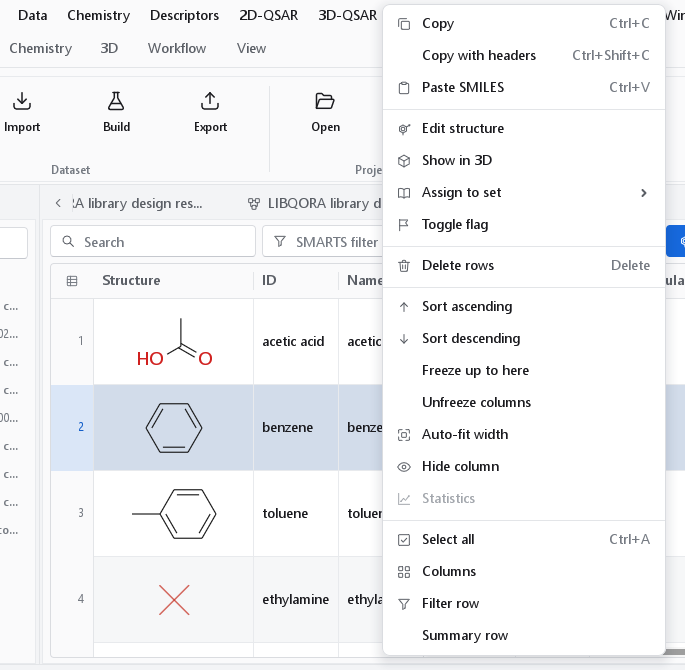
| Entry | What it does |
|---|---|
| Copy, Copy with headers | The selected rows as tab-separated text (Ctrl+C, Ctrl+Shift+C), ready to paste into another program or a document. |
| Paste SMILES | Appends the SMILES list on the clipboard (Ctrl+V): one structure per line, an optional name after a space, tab, comma or semicolon. Lines that do not parse are reported and not added. |
| Edit structure | Opens the sketcher on the row. |
| Show in 3D | Opens the 3D workspace of the dataset with the selection. |
| Assign to set | Training, Test, External, Excluded or Unassigned. |
| Toggle flag | Flags the rows, or unflags them if all were flagged. |
| Delete rows | Removes the rows (Delete). |
| Sort ascending, Sort descending, Clear sort | Sort by the column. |
| Freeze up to here, Unfreeze columns | Keep the columns up to this one in view while scrolling sideways. |
| Auto-fit width, Hide column | Fit the column to its content, or hide it (it stays in the dataset and in the column manager). |
| Statistics | The statistics dialog for a numeric column. |
| Edit formula | For a formula column, its editor. |
| Remove column | Deletes the column from the dataset. Identity columns cannot be removed. |
| Select all, Columns | Select every shown row; open the column manager. |
| Filter row, Summary row | Show the filter row, or a summary row with the mean of every activity and descriptor column. |
| Clear filters | Shown while a filter is active. |
The column manager
Data > Columns (or Columns on the Data tab) lists every column of the dataset, hidden ones included, in table order. It is the place to tidy a table before a figure or an export.
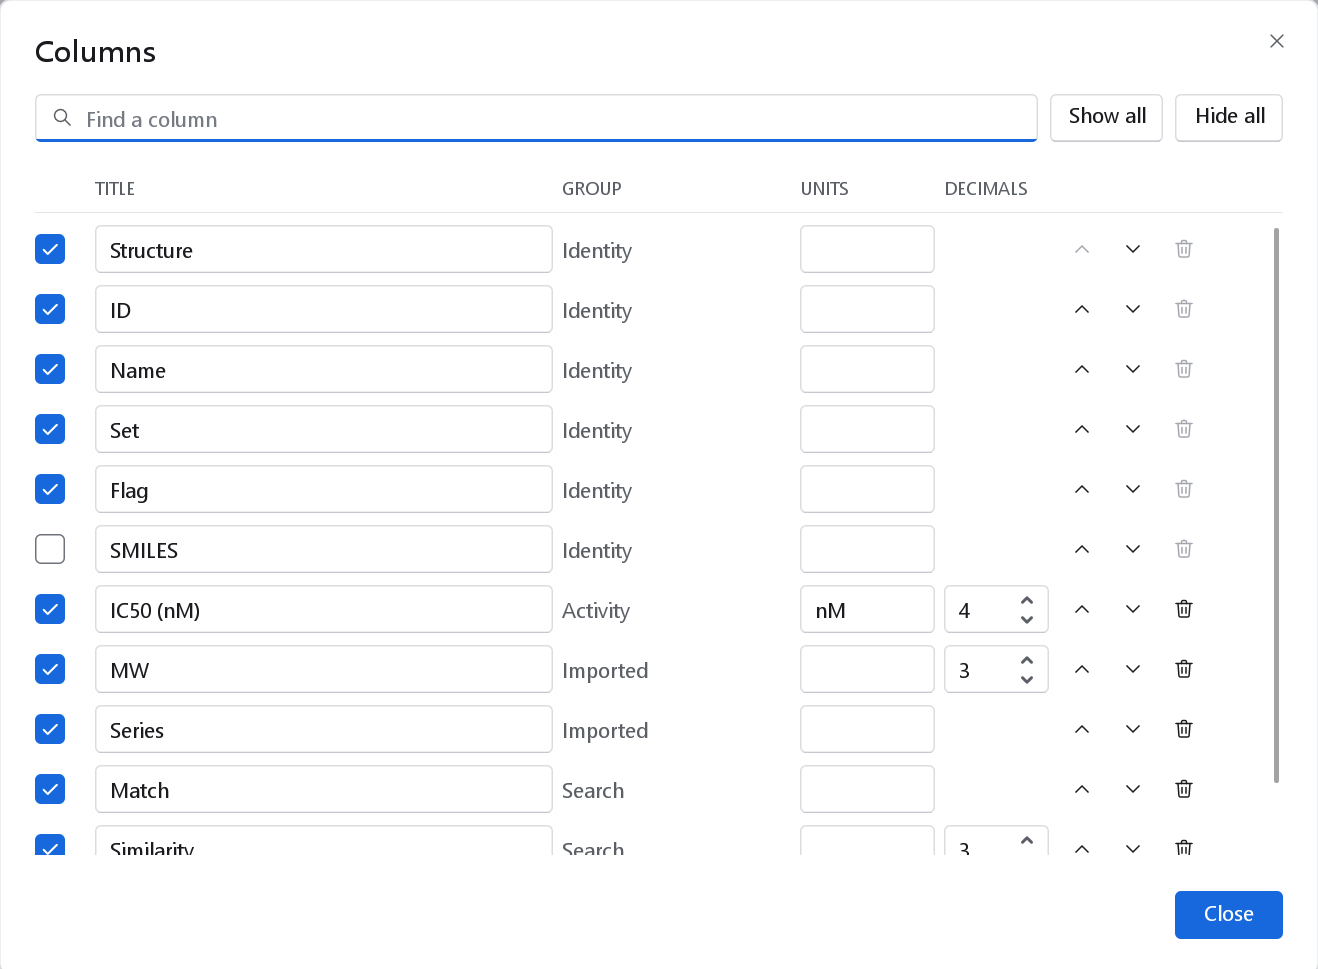
| Control | Effect |
|---|---|
| Find a column | Narrows the list to titles or groups that contain the text; with hundreds of descriptors, type a family name. |
| Show all, Hide all | Show every column, or hide all except Structure, ID and Name. |
| Box | Show the column in the spreadsheet. |
| Title, Units | Rename the column or set its unit. Formulas that read the column keep working. |
| Decimals | From 0 to 9; changes the display and the exported text, not the stored value. |
| Arrows | Move the column up or down, which moves it left or right in the table. |
| Gear | For a formula column, edit the formula. |
| Bin | Remove the column. Formula columns that read it then show empty cells. |
Drawing and editing structures
Chemistry > Edit structure, a double click on a structure cell, or Edit structure in the context menu opens the sketcher on that compound; Chemistry > Draw a new compound opens it empty. The dialog has a Name box, the toolbar, the drawing area and, underneath, the SMILES of the drawing with a Copy SMILES button. Apply (or Add compound for a new one) writes the structure, its canonical SMILES and a new depiction into the row.
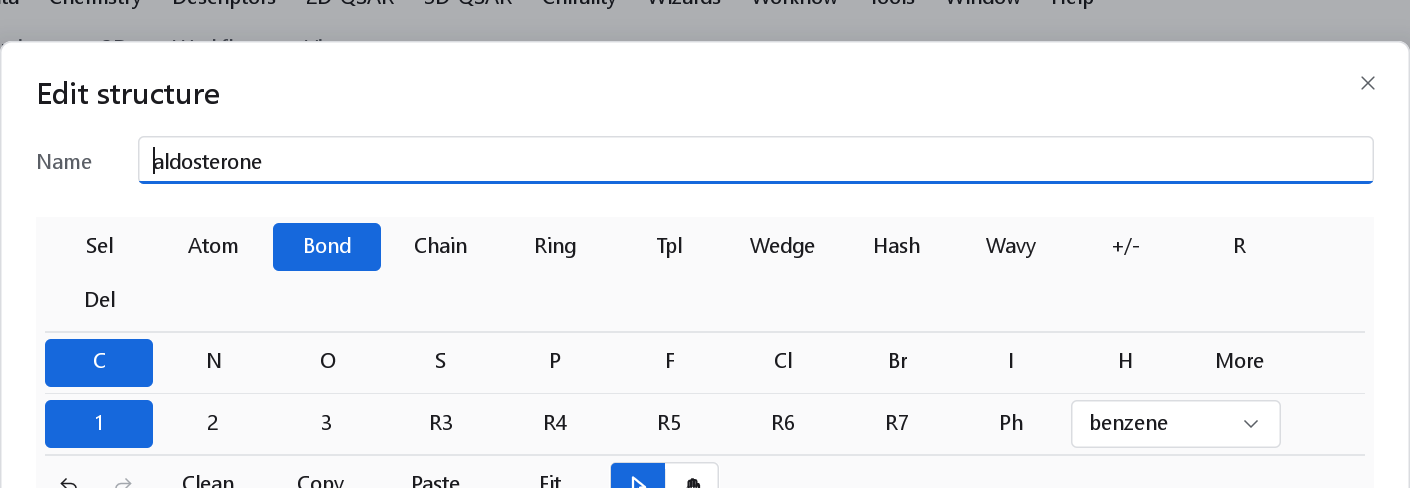
| Control | Use |
|---|---|
| Sel | Select and move atoms. |
| Atom | Place atoms of the current element. |
| Bond | Draw bonds of the current order. |
| Chain | Drag out a carbon chain. |
| Ring, R3 to R7, Ph | Place, attach or fuse a ring of that size; Ph is a benzene ring. |
| Tpl and the list | Place a template: benzene, pyridine, pyrimidine, the cycloalkanes from three to eight members, cyclopentadiene, naphthalene, indole, quinoline, purine, piperidine, piperazine, morpholine, the steroid skeleton or adamantane. |
| Wedge, Hash, Wavy | Stereo bonds: solid wedge (narrow end at the stereocentre), hashed wedge, and the wavy bond for an unspecified configuration. |
| +/- | Charge: a click adds one, a right click subtracts one. |
| R | An R-group attachment point. |
| Del | Erase atoms and bonds. |
| Elements, More | C, N, O, S, P, F, Cl, Br, I, H, and the full periodic table. |
| 1, 2, 3 | Bond order. |
| Clean | Tidy the layout (Ctrl+L). |
| Copy, Paste | Copy the SMILES; paste a SMILES or a MOL block. |
| Fit | Fit the drawing to the area (Ctrl+0). |
| Pointer and hand | The left mouse button selects, or pans the drawing. |
With the pointer over an atom, the keys C N O S P F I H, L (Cl) and B (Br) set its element and + and - its charge; over a bond, 1 2 3 set its order. Ctrl+Z and Ctrl+Y undo and redo inside the sketcher.
Sets and flags
The Set of a compound decides its role in modelling. Training compounds fit the model, Test compounds validate it, External compounds are kept out of model building and splitting altogether and serve as an external validation set, and Excluded compounds are ignored. To assign the selected rows, use Data > Assign to training set, Assign to test set, Assign to external set, Exclude from modelling or Clear set membership, the Training and Test buttons of the Home tab, the context menu, or the Inspector. A designed split of the whole dataset is made with Data > Training/test split (see Preparing the data).
The flag has no effect on modelling. Use it to mark compounds for yourself, then filter the Flag column on true to see them together.
An empty dataset
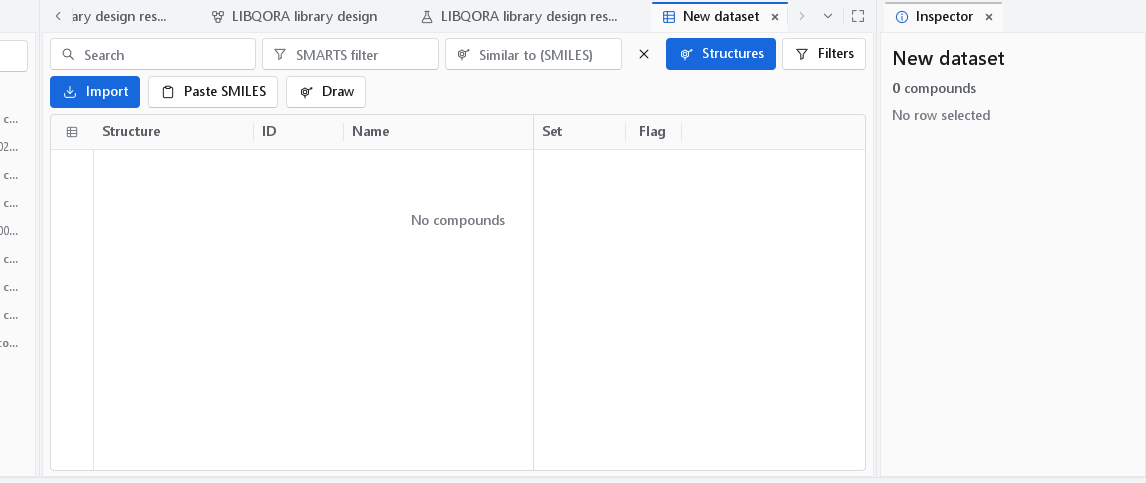
File > New dataset opens an empty spreadsheet whose toolbar offers the three ways to fill it: Import, Paste SMILES and Draw. A filter that matches nothing says "No compound matches the filter" instead of "No compounds", so an empty table is never mistaken for an empty dataset.