Curation, review and saving
The Curate page shows what every rule removed and why, and lets you change any rule; the Review page shows the result compound by compound; the Save page writes it with its provenance.
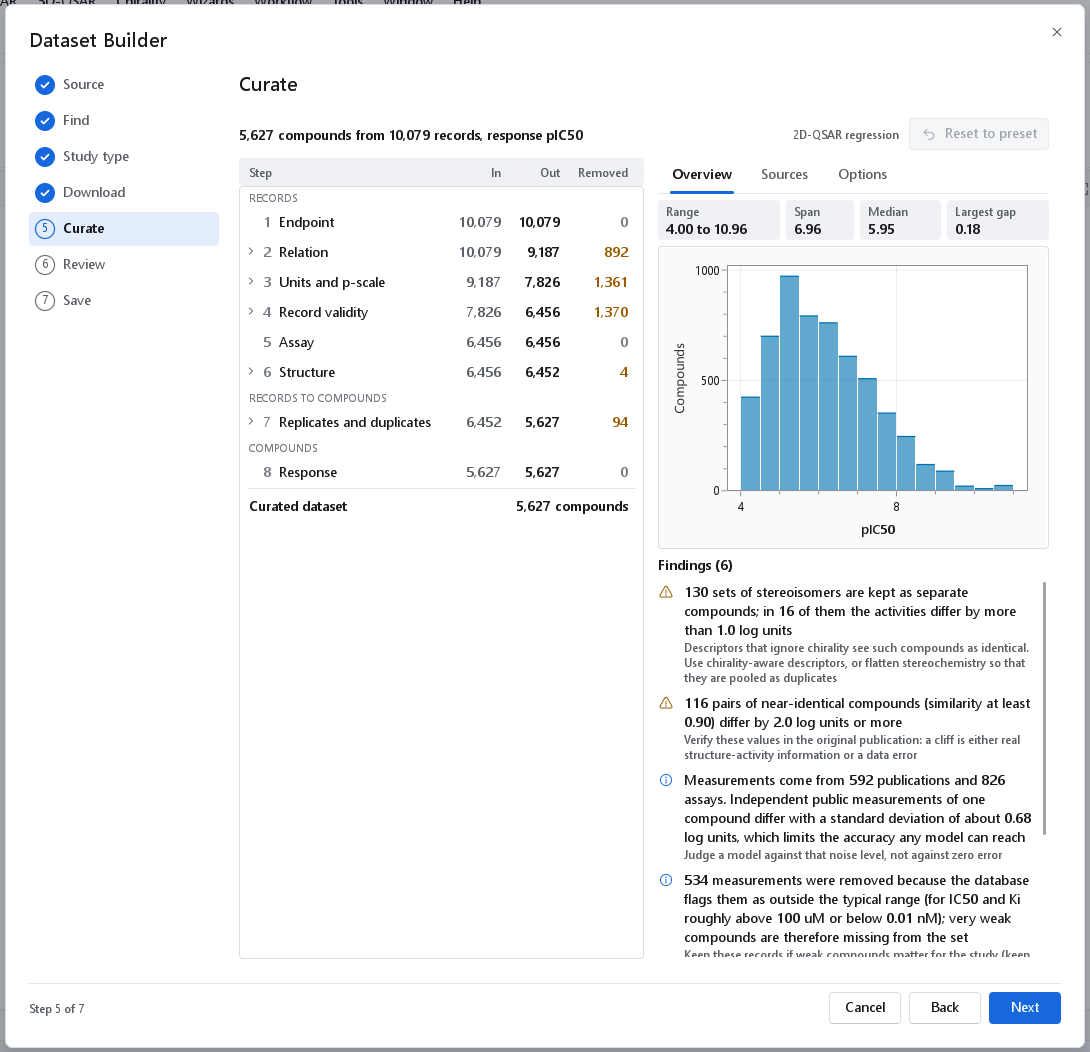
The curation runs as soon as the records are loaded and a study type is chosen, so the Curate page opens on a finished result. The line at the top gives it in one sentence, for example 5,627 compounds from 10,079 records, response pIC50. Beside it is the name of the study type, or the number of options you have changed, and Reset to preset, which restores every option to the setting of the study type. Below, the funnel stays on the left while the right pane changes between the tabs Overview, Sources and Options.
The funnel
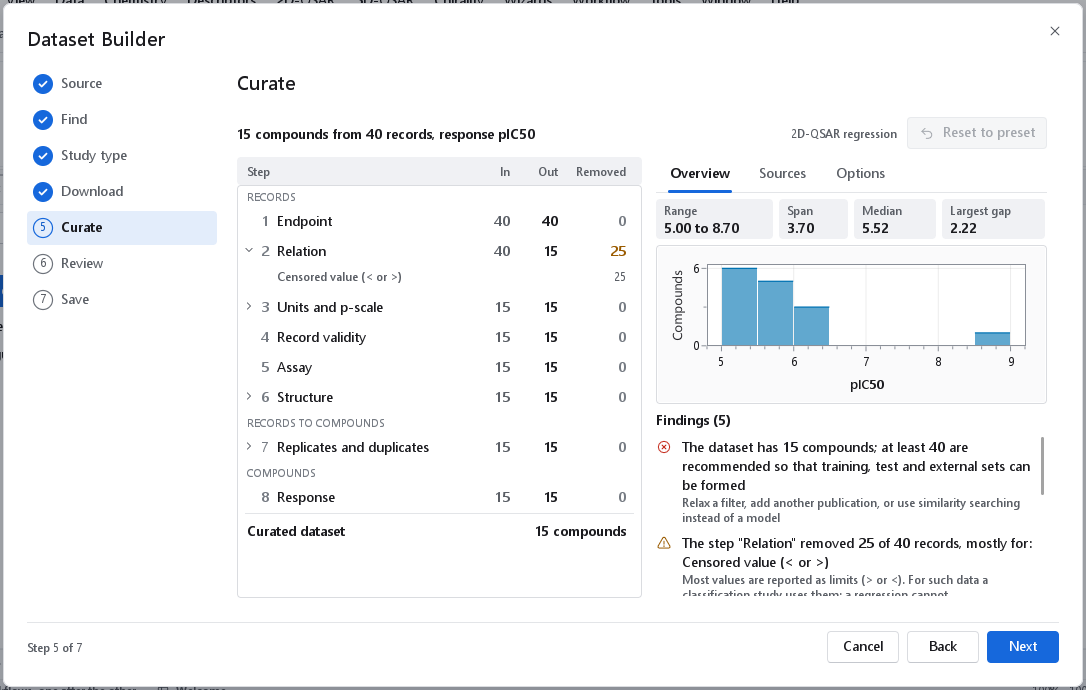
The funnel has one row per step with the number that came in, the number that went out and the number removed; a removal is shown in amber. The small captions mark what is counted: the steps count measurements (RECORDS) until Replicates and duplicates, which pools the measurements of one structure into one compound (RECORDS TO COMPOUNDS); the steps after it count COMPOUNDS. For the pooling row In and Out are therefore in different units, In minus Out is not a number of removals, and its Removed column counts the compounds removed because their replicates disagreed. The last row is the curated dataset.
A row with a chevron can be opened with a click: it lists every reason for which items were removed, with the count of each, and the notes of the step, which say what it did even when it removed nothing (for example how many computed p-values agree with ChEMBL's, which units were converted, or how many structures standardisation changed). The tooltip of a row is a one-line summary of the step with the reference it follows.
The curation steps
The steps run in a fixed order, and each is one published curation decision. The tables give every option of a step as the Options tab spells it, its default for a 2D-QSAR regression, and when to change it. Where the literature gives a principle but no number, the default is a convention, said so here and in the tooltip; the report states the value that was used either way.
Target (only when the records cover several targets)
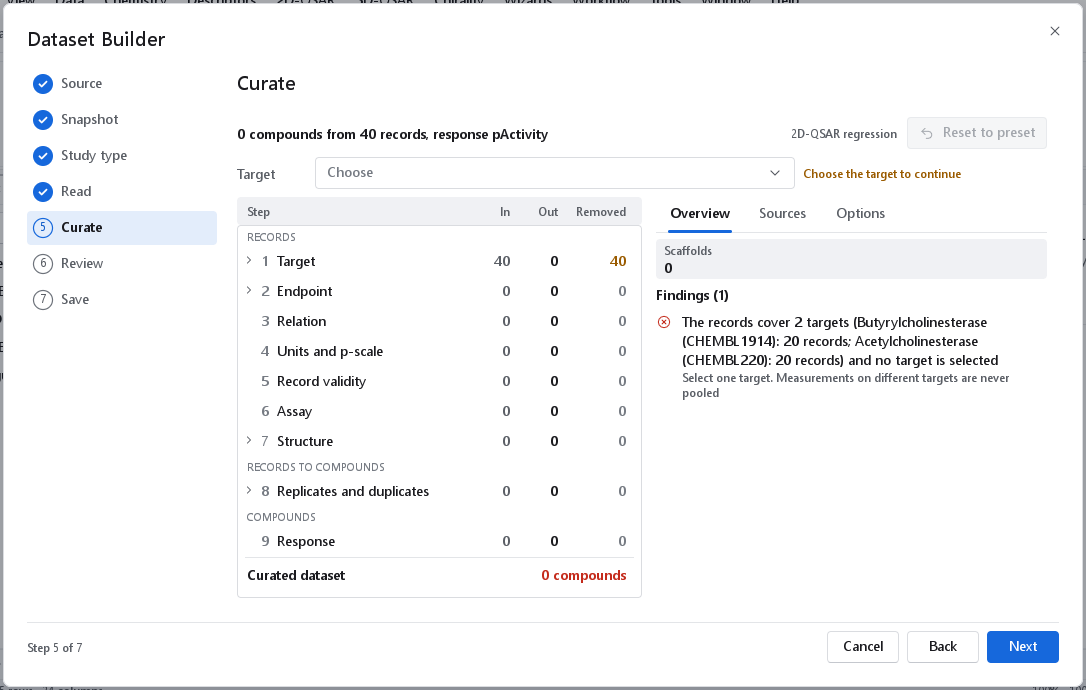
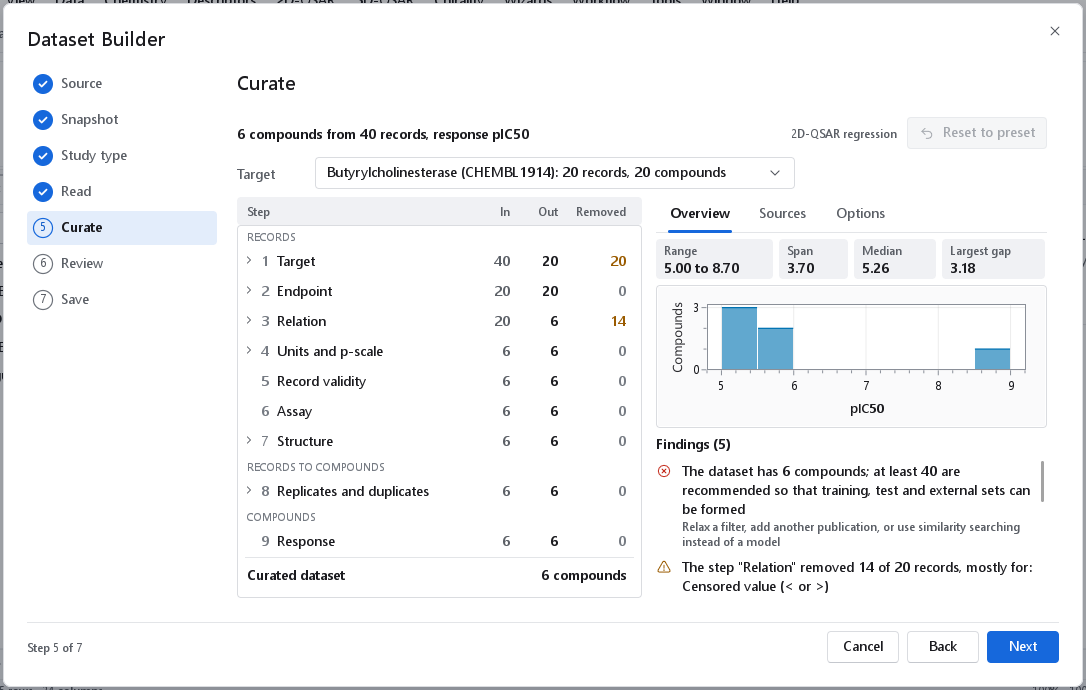
Measurements on different proteins are different experiments and are never pooled. A ChEMBL publication downloaded without a target identifier, or a snapshot, can hold measurements on more than one protein. The Curate page then shows Target above the funnel with every target, its records and its compounds, and the funnel starts with a step Target, which renumbers the others. Until you choose, nothing passes that step, the finding names the targets that are present, and Next is refused. The choice is part of the data, like the measurement type: it is not counted as a changed option, and Reset to preset keeps it.
1 Endpoint
One activity type per dataset. For a ChEMBL target the type is the one chosen on the Find page. Reasons: No activity type, Other activity type.
| Option | Default | When to change it, and why |
|---|---|---|
| Activity types | The type of the Find page | Standard types kept, separated by commas. Empty uses the most frequent potency type of the data, and the step reports which one that is. |
| Allow several types in one response | Off | Only for an explicit, reported choice. An IC50 depends on the assay conditions and a Ki does not, and public pKi values are on average 0.355 log units larger than the pIC50 of the same compound and target (Kalliokoski et al. 2013). Mixing is reported as a caution and the response is then called pActivity. |
2 Relation
Regression keeps exact values only. A value reported as > 10 µM says only that the pIC50 is below 5, so it has no defined p-value; Kalliokoski et al. (2013) treat qualified values as unclear measurements. A classification can use such a value where it decides the class. Reasons: Censored value (< or >), Approximate value (~), No relation given, Unrecognised relation.
| Option | Default | When to change it, and why |
|---|---|---|
| Keep censored values (< and >) | Off; on for classification | Meaningful for classification only. For a regression, a limit is not a measurement. |
| Treat approximate values (~) as exact | Off | When the approximate values of a source are known to be ordinary measurements reported with a tilde. |
| Treat a missing relation as exact | Off | For records that arrive with no relation at all. Your own files do not need it: a value without a sign is read as exact when the file has no relation column. |
3 Units and p-scale
nM, µM, pM, mM and M, and amounts per volume such as nmol/L, are converted to mol/L and then to the p-scale, p = -log10(mol/L). Values that are already pIC50 or pKi are taken as they are. Values in per cent or mg/kg are not concentrations and are removed. Every computed p-value is compared with ChEMBL's own pchembl_value where the database supplies one, and the notes of the step say how many agree. Reasons: No numeric value, No unit given, Unit is not a concentration, Mass concentration (conversion not enabled), Mass concentration without a usable structure, Value is zero or negative, Value cannot be converted, and the two below.
| Option | Default | When to change it, and why |
|---|---|---|
| Convert mass concentrations | Off | For data reported in µg/mL and the like. The conversion uses the molecular weight of the structure as supplied, counter-ion included, because that is the substance that was weighed. Off, such records are removed with their reason. |
| Assumed unit | (none) | (none), pM, nM, uM, mM, M or p-scale, -log10(M), for records that carry no unit: your own files and PubChem readouts deposited without one. With no assumed unit they are removed, because the pipeline never guesses a unit. |
| Database p-value check | Report disagreements | Do not compare, Report disagreements (counted, listed in the notes and flagged in the table, the record kept) or Remove disagreements. Removing is a conservative choice when a dataset will be published. |
| Check tolerance | 0.011 | From 0 to 0.5. The computed value is compared after rounding to ChEMBL's two decimals; 0.011 accepts the one-hundredth that a different rounding order produces. |
| Require the database p-value | Off | Keeps only records for which ChEMBL supplies a pchembl_value, which it computes for exact, positive nM values of IC50, XC50, EC50, AC50, Ki, Kd, Potency and ED50 without a validity flag (Bento et al. 2014). Reason: No database p-value (pchembl_value). |
4 Record validity
Records that ChEMBL's curators flag, repeat citations of an earlier value, comments that contradict the number and implausible values are removed. Reasons: Flagged by the database: outside typical range, Flagged by the database: followed by the flag, Repeat citation of an earlier value (potential_duplicate), Comment contradicts the numeric value, Implausibly weak value, Implausibly potent value.
| Option | Default | When to change it, and why |
|---|---|---|
| Remove records the curators flagged | On | Removes potential transcription errors, potential author errors, author-confirmed errors, potential missing data and non-standard units for the type (Bento et al. 2014). Records marked as manually validated are never removed. Leave it on. |
| Remove values outside the typical range | On; off for classification | The flag marks values unusually large or small for the type, for IC50 and Ki roughly outside 0.01 nM to 100 µM; ChEMBL's curators note that some such data may be correct (Papadatos et al. 2015). Removed for regression, where an inaccurate extreme value has high leverage, kept for classification. Removing them cuts the response off at about p = 4; switch it off when very weak compounds matter to the study. |
| Remove repeat citations | On | ChEMBL flags a value that repeats one reported earlier (potential duplicate). Such a pair is one measurement cited twice, not two measurements. |
| Remove comment conflicts | On | Removes records whose activity comment contradicts an exact number: Not Active, inconclusive, Not Determined and the like. |
| Smallest plausible p-value | 2 | From -5 to 20. Below p = 2 (above 10 mM) a value is an unclear measurement (Kalliokoski et al. 2013). |
| Largest plausible p-value | 15 | From -5 to 20. Above p = 15 (below 1 fM) likewise. |
5 Assay
Measurements on mutant proteins are removed, the target assignment must be reliable, and the set can be restricted to one assay type, one organism, one publication or one assay. Reasons: Mutant or variant target, Target confidence score below the threshold, Target confidence score not available, Assay type not selected, Target type not selected, Other target organism, Activity outcome not selected, Other publication, Other assay, Assay with too few compounds.
| Option | Default | When to change it, and why |
|---|---|---|
| Assay types | None ticked (any) | Tick Binding, Functional, ADMET, Toxicity, Physicochemical or Unclassified to keep only those ChEMBL assay types. Use it when the finding reports mixed assay types whose formats are not expected to agree. Records of other sources carry no ChEMBL assay type and always pass. |
| Smallest confidence score | 8 for a single protein | From 0 to 9: 9 direct single protein, 8 homologous single protein, 7 and 6 protein complex subunits, 5 and 4 multiple proteins, 3 non-protein molecular target, 1 non-molecular, 0 unassigned (Bento et al. 2014). Set from the target type (6 for a complex, 4 for a family). Lower it when the step removes most records of a complex or a family. |
| Keep records without a confidence score | On | PubChem records and your own files carry no score; switching this off would remove them all. |
| Target types | Empty (any) | Target types kept, separated by commas, for example SINGLE PROTEIN. |
| Target kept | Empty | The target whose measurements are kept when the records cover several: its identifier, accession, gene or name. Set by the Target choice above the funnel. |
| Target organism | Empty (any) | For example Homo sapiens; upper and lower case do not matter. |
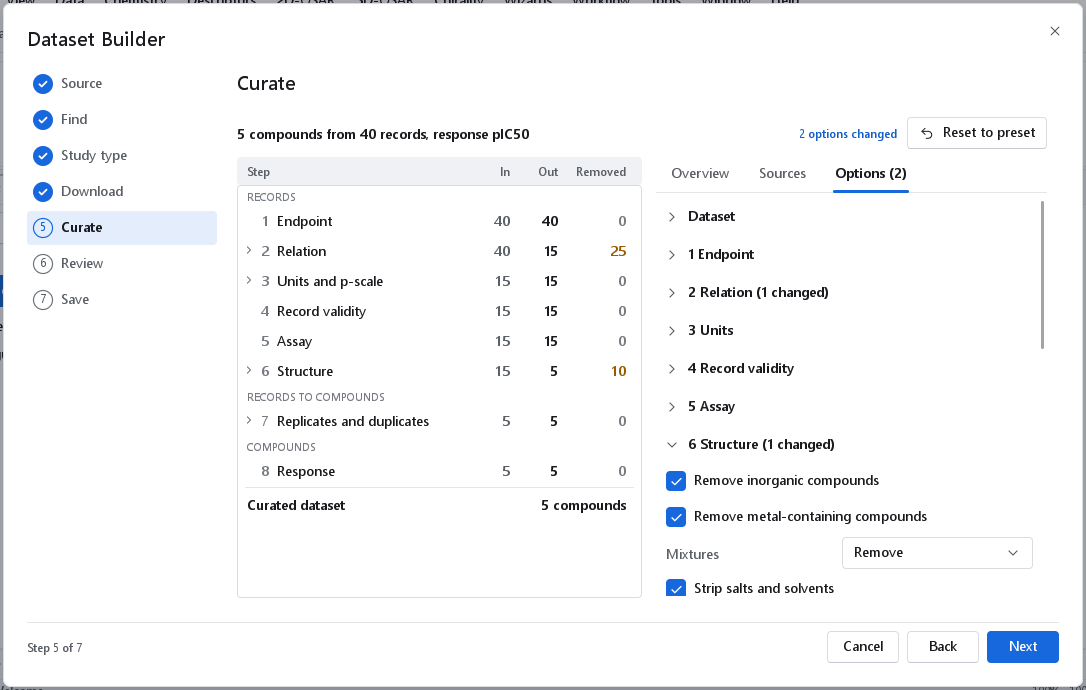
| Remove mutant and variant proteins | On | A variant is a different target. For EGFR, IC50 (ChEMBL_37), this removes 3,813 of the 17,272 records that reach the step (T790M, L858R and others). Switch it off only for a dataset that is meant to be about a variant, and then restrict it to that variant. |
| PubChem outcomes | None ticked (every outcome) | Tick Active, Inactive, Inconclusive, Unspecified or Probe to keep only those PubChem outcomes. |
| Restrict to | No restriction; One publication for 3D-QSAR | No restriction, One publication or One assay: a congeneric series measured under one protocol. |
| Publication or assay id | Empty | Available when a restriction is set. Empty selects automatically the publication or assay with the most distinct compounds, and passes over a candidate in which every compound carries the same value (a table range recorded against every row is not a measurement series). The note of the step names the choice. |
| Smallest assay size | 1 | From 1 to 1000. Removes assays that contribute fewer distinct compounds; 1 keeps all. |
6 Structure
Each distinct input structure is standardised once. Inorganic compounds, organometallics and metal complexes are removed; counter-ions and solvents are stripped and the parent structure is kept, neutralised and written in one standard form (Fourches et al. 2010). Mixtures are removed, or reduced to their largest component. Stereochemistry is kept unless you flatten it. Reasons: No structure supplied, Structure cannot be parsed, Inorganic compound (no carbon), Organometallic compound or metal complex, Mixture of different organic components, Structure fails validation, Element outside the allowed list, Fewer heavy atoms than the lower bound, More heavy atoms than the upper bound, Molecular weight below the lower bound, Molecular weight above the upper bound, Undefined stereocentre.
| Option | Default | When to change it, and why |
|---|---|---|
| Remove inorganic compounds | On | Structures without carbon. |
| Remove metal-containing compounds | On | Common descriptors are not parameterised for organometallics and metal complexes. |
| Mixtures | Remove; Keep the largest component for a library | A record with two or more different organic components is an ambiguous measurement. Keep the largest component when you know the minor component is inert. |
| Strip salts and solvents | On | Counter-ions and solvents are recognised from a list; one on neither list makes the record a mixture, which the funnel counts. |
| Neutralise charges | On | Protonates or deprotonates to the neutral form where that is possible, so that a salt and its free base are one compound. |
| Normalise functional groups | On | Writes nitro groups, N-oxides and similar chemotypes in one representation, so that one compound has one structure. |
| Canonical tautomer | Off | Writes one tautomer per compound. Off by default: two records that differ only in the drawn tautomer then stay two compounds. The step has not been checked against a reference implementation, so inspect the result if you use it. |
| Remove isotope labels | On | A labelled compound is not a different compound for QSAR. |
| Remove invalid structures | On | Valence errors and structures that cannot be kekulised. |
| Stereochemistry | Keep stereoisomers apart | Flatten removes stereochemistry, so stereoisomers become duplicates and are pooled. Use it when the descriptors you will use cannot see chirality (Fourches et al. 2010, section 2.4); see Chirality and activity cliffs. |
| Remove undefined stereocentres | Off | Removes compounds with a stereocentre drawn without a configuration. Useful for a 3D series, which needs one definite structure per compound. |
| Allowed elements | H, B, C, N, O, F, Si, P, S, Cl, Se, Br, I | The elements common descriptor sets are parameterised for. Empty allows every element. |
| Smallest molecular weight | 0 | g/mol of the standardised parent, from 0 to 5000; 0 applies no lower bound. |
| Largest molecular weight | 1000 | A convention that excludes peptides and other large biologics (Fourches et al. 2016). |
| Fewest heavy atoms | 4 | From 0 to 500. A convention that excludes residual solvents and trivial fragments. |
| Most heavy atoms | 0 | From 0 to 1000; 0 applies no upper bound. |
7 Replicates and duplicates
Measurements of the same standardised structure on the same target are pooled into one compound. A value that merely repeats an earlier report is counted once: such repeated citations are 90 % of all pairs of public Ki values (Kramer et al. 2012). If the independent measurements of a compound span more than one log unit, the compound is removed, because no single value can represent it (Fourches et al. 2010: "if they are significantly different, we recommend eliminating both records"). A difference of exactly 3, 6 or 9 log units is reported separately as a probable unit error, for example nM entered as µM. Reasons: Replicates disagree by more than the allowed spread, Replicates differ by exactly 3, 6 or 9 log units (probable unit error).
| Option | Default | When to change it, and why |
|---|---|---|
| Pooled value | Median | Median of the p-values, robust against one discordant report; Geometric mean of the molar values, which is the mean of the p-values; Arithmetic mean of the molar values, which leans towards the most potent report. |
| Largest replicate spread | 1.0 | Log units, from 0 to 5; 0 switches the rule off. 1.0, a factor of ten, is a convention. For scale, independent public measurements have a standard deviation of 0.54 log units for pKi and 0.68 for pIC50. |
| Count a repeated value once | On | A value reported again within the repeat tolerance is a citation of one measurement, not a replicate, and would otherwise make a compound look better measured than it is. |
| Repeat tolerance | 0.02 | Log units, from 0 to 0.5 (Kalliokoski et al. 2013, tolerance 0.02). |
8 Response
Optional bounds on the response, and two flags. Outliers and activity cliffs are flagged in the table and listed in the report; they are never removed automatically, because an activity cliff is either real structure-activity information or an error, and only the original publication can tell which (Fourches et al. 2016). Reasons: Response below the lower bound, Response above the upper bound.
| Option | Default | When to change it, and why |
|---|---|---|
| Lower bound, Upper bound | Not set | Tick the box to apply a bound; it then starts at 4 and 10. Range -5 to 20. |
| Flag outliers | On | Flags compounds whose modified z-score, 0.6745 (x - median) / MAD, exceeds the limit (Iglewicz and Hoaglin 1993). |
| Outlier z-score | 3.5 | From 1 to 10; 3.5 is the recommended value. |
| Report activity cliffs | On | Pairs of very similar compounds with very different potency (Maggiora 2006). |
| Cliff similarity | 0.90 | Smallest ECFP4 Tanimoto similarity of a cliff pair, from 0.5 to 1. |
| Cliff potency difference | 2.0 | Log units, from 0.5 to 6. |
| Cliffs listed | 50 | Largest number of pairs listed in the report. |
9 Class labels, or Series
A classification labels every compound active or inactive. A censored value decides the class only when it lies on one side of the threshold, so > 10 µM is inactive at a 1 µM threshold but undecided at 30 µM. Reasons: Inside the grey zone around the threshold, Conflicting class evidence, Class cannot be determined.
| Option | Default | When to change it, and why |
|---|---|---|
| Assign class labels | On for classification | Set by the Classification study type. |
| Labels from | Potency threshold | Potency threshold, or Depositor's outcome of a PubChem assay. |
| Activity threshold | 6 | Active at a p-value of at least this, from 0 to 15. Set on the Study type page. |
| Grey zone | 0 | Half-width of the excluded band around the threshold, from 0 to 3. |
| Active label, Inactive label | active, inactive | The text written into the class column. |
The group 9 Series serves a congeneric series. Keep is Every compound or Most populated scaffold, which keeps only the compounds of the most frequent Murcko scaffold (reason Other scaffold); use it when the finding says the set contains several ring scaffolds, since an alignment needs a common core. Group by the generic framework groups by the all-carbon framework instead, so that ring heteroatom variants fall into one series.
Dataset, and the warning thresholds
The group Dataset holds Structures only, which the Screening library type sets: it skips the activity steps and only standardises and de-duplicates the structures. The group Warning thresholds removes nothing; it decides when a finding is raised.
| Option | Default | Source |
|---|---|---|
| Fewest compounds | 40 | Tropsha 2010; Fourches et al. 2016 |
| Fewest compounds per class | 20 | Tropsha 2010; Fourches et al. 2016 |
| Smallest activity span | 3.0 | Fourches et al. 2016; at least five times the experimental error (Tropsha 2010) |
| Largest gap fraction | 0.15 | No gap above 10 to 15 % of the range (Tropsha 2010) |
| Smallest MODI | 0.65 | Golbraikh et al. 2014 |
| Fewest series compounds | 20 | Ragno et al. 2020 |
| Experimental SD | 0.68 | pIC50 (Kalliokoski et al. 2013); 0.54 for pKi (Kramer et al. 2012) |
The Overview tab
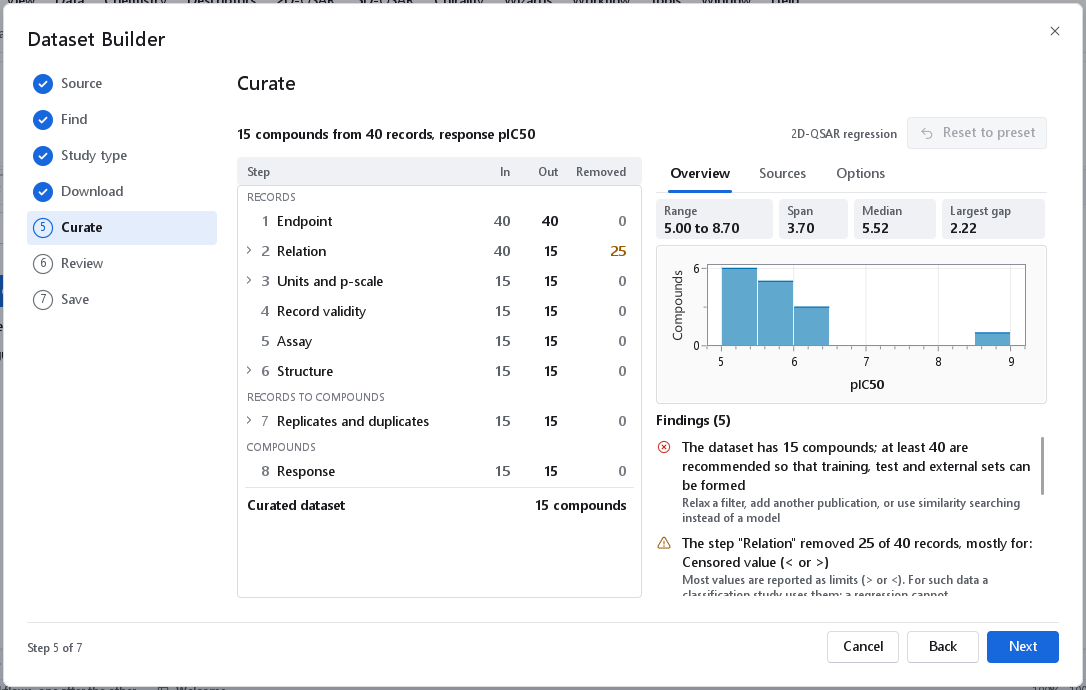
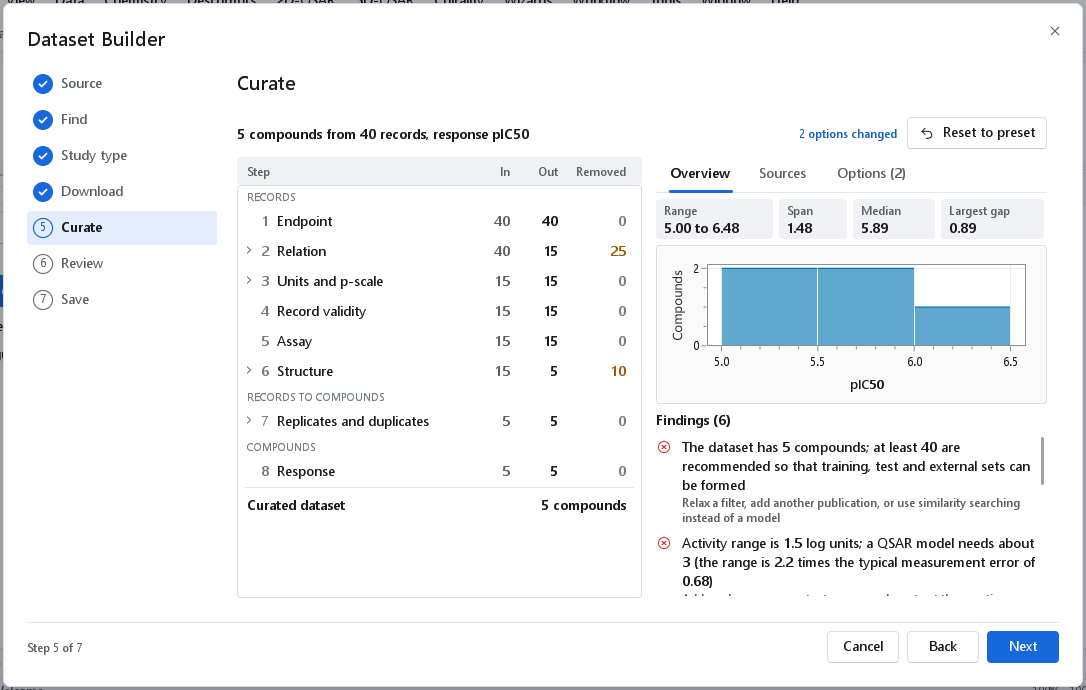
The Overview tab shows the headline numbers of the curated response: Range, Span, Median and Largest gap (hover over one for its meaning and the recommended value). A classification adds a bar with the two classes and their shares, and the histogram of the response marks the threshold and the edges of the grey zone. Below come the findings, most serious first, each with a suggestion.
| Level | Meaning |
|---|---|
| Problem | The dataset should not be modelled as it is. |
| Caution | A limit you should know about and mention in a report. |
| Note | Information. |
| Typical finding | What to do |
|---|---|
| The dataset has 23 compounds; at least 40 are recommended | Too few for separate training, test and external sets. Relax a filter, add data, or use similarity searching instead of a model. |
| Activity range is 1.4 log units; a QSAR model needs about 3 | Add weaker or more potent compounds, or treat the question as a classification. |
| The classes are imbalanced: 1902 active, 11775 inactive | Use stratified splits and balanced metrics, or move the threshold. |
| Measurements come from 592 publications and 826 assays | Independent measurements differ by about 0.5 to 0.7 log units. Judge a model against that noise level, not against zero error. |
| 116 pairs of near-identical compounds differ by 2.0 log units or more | Check these activity cliffs against the original publications. |
| 130 sets of stereoisomers are kept as separate compounds | Use chirality-aware descriptors, or flatten stereochemistry so that they are pooled. |
| 534 measurements were removed because the database flags them as outside the typical range | Very weak compounds are missing from the set. Keep these records if weak compounds matter. |
| The set contains 7 different ring scaffolds (3D series) | Restrict the series to the dominant scaffold. |
The Sources tab
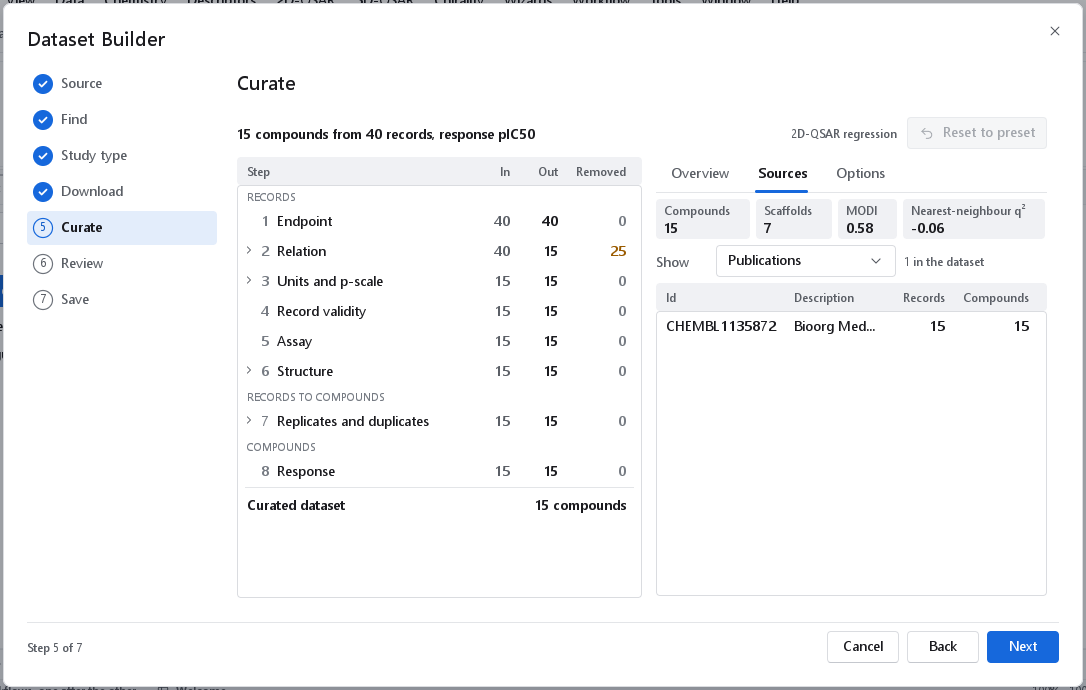
The Sources tab lists what contributes to the curated dataset. Show switches between Publications, Assays, Scaffolds and Assay types, each with its records and compounds. The statistics above the list are the number of compounds, the number of Murcko scaffolds, the compounds with two or more independent measurements, the modelability index (MODI) and the nearest-neighbour Q² (NN Q²). MODI is the share of compounds whose nearest neighbour has the same class (for a regression, above or below the median response); below 0.65 a dataset is hard to model (Golbraikh et al. 2014). Both are indicative diagnostics of how much structure-activity signal the data carry, computed on ECFP4 fingerprints; they are not comparable with published MODI values and do not validate a model.
The Options tab
The Options tab holds every option of every step, grouped as the funnel is. Open a group with its heading; the heading counts what you changed, for example 6 Structure (1 changed), and so does the tab itself. Hover over an option for what it does and the publication it follows. An option that does not apply is disabled: the tolerance when the database check is off, the publication or assay id without a restriction, the repeat tolerance when repeated values are not collapsed, the outlier and cliff limits when their flags are off, and the class options without class labels.
A change runs the curation again in the background a quarter of a second after the last edit, so a number being typed starts one run, not one per key. The line at the top says Updating meanwhile; on a dataset of 10,000 records the funnel is back within a few seconds. Reset to preset restores every option.
When no compound passes
If no compound passes, Next is refused and the page names the step that removed most with its main reason, which is where the settings have to change. For example The step Assay removed most: target confidence score below the threshold for a protein complex (lower Smallest confidence score to 6), or The step Units and p-scale removed most: No unit given for a PubChem readout without a unit (state the unit on the Find page, or set Assumed unit).
The Review page
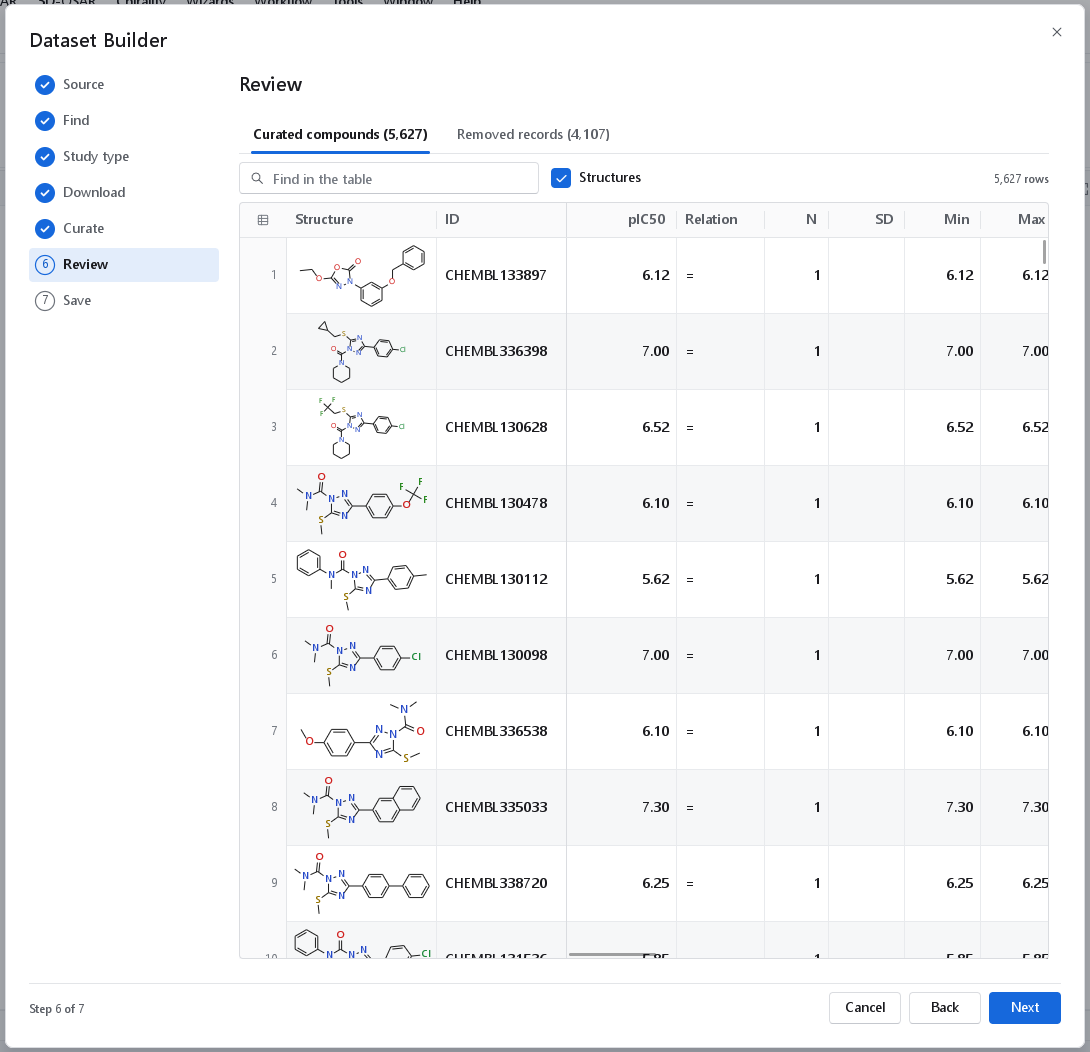
Curated compounds is the table that will be written, with the 2D structure of every compound. The identifier, the response, the class label, the relation, the number of measurements pooled (N), their standard deviation, minimum and maximum and the flags lead; the source identifiers, SMILES, endpoint, units, assays, publications, years, journals, DOIs, scaffold, molecular weight, heavy atoms and undefined stereocentres follow. The flags are outlier, activity-cliff, undefined-stereo and pchembl-mismatch. Click a column heading to sort; Find in the table shows only the rows that contain the text, and the count at the right says how many that are. Untick Structures for a compact table without drawings.
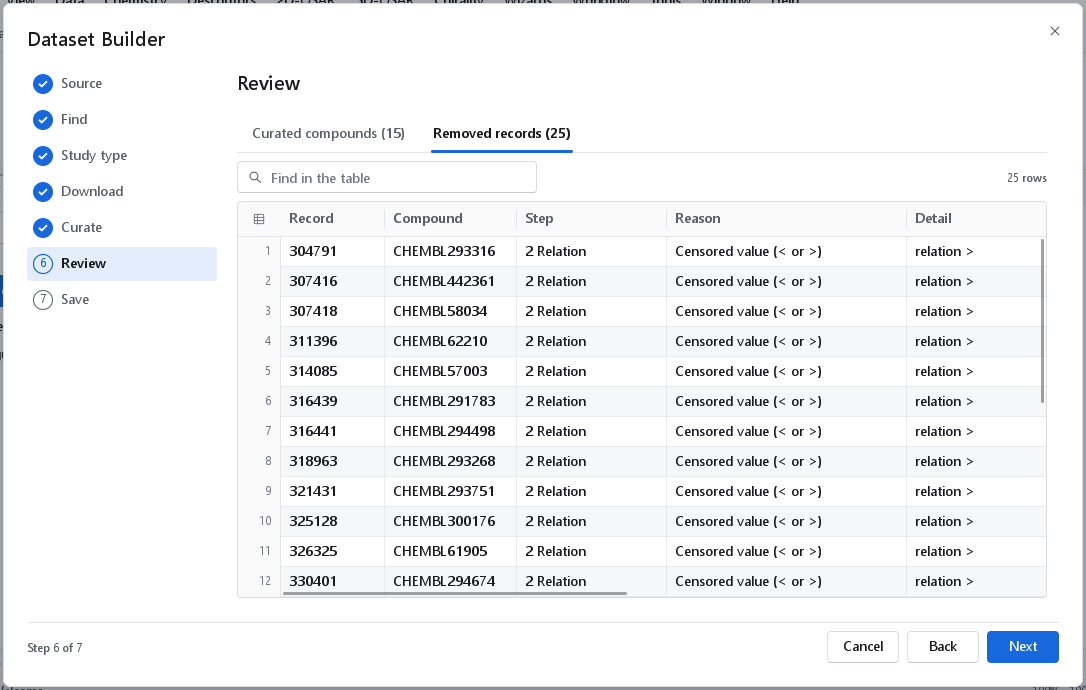
Removed records lists every removed measurement with the record and compound identifiers, the step, the reason, a detail (the value, the unit or the flag that decided it), and the measurement itself: type, relation, value, units, assay, publication and SMILES. Search it for a compound you expected to see in the dataset.
The Save page
Give the dataset a Dataset name and a Folder, and press Save dataset. The name is suggested from what was downloaded, for example CHEMBL220_IC50_regression, and tagged Suggested until you type another. The folder is the one the last dataset was saved to, tagged Last used and kept between sessions; for a first dataset it is the folder of your own file or snapshot, or Documents\GeinQSAR. It is created if it does not exist. A name may not contain < > : " / \ | ? *, end with a full stop or be a name Windows reserves. If a dataset of that name exists in the folder, the page warns that saving replaces it.
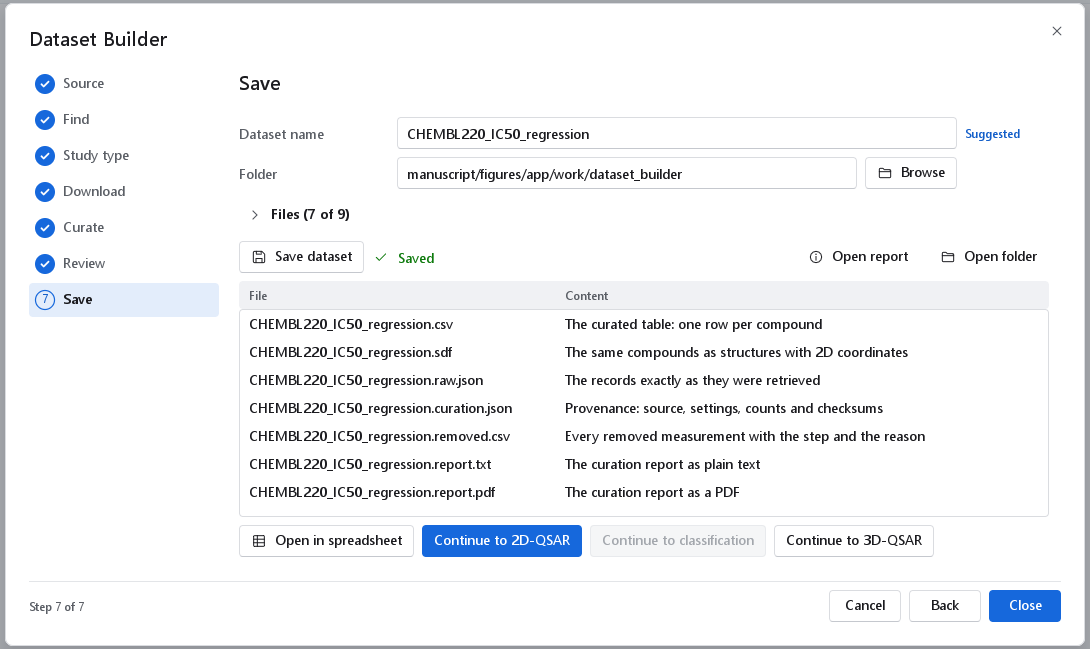
For the name egfr the wizard writes:
| File | Content |
|---|---|
egfr.csv | The curated table, one row per compound: identifier, source identifiers, standardised SMILES, response, relation, number of measurements, their standard deviation and range, endpoint, units, class label, assay and publication identifiers, years, journals, DOIs, scaffold, molecular weight, heavy atoms, undefined stereocentres and flags. |
egfr.sdf | The same compounds as structures with 2D coordinates and the table as data fields. |
egfr.raw.json | The raw snapshot: the records exactly as they were retrieved. Needed to replay the curation offline and to curate the same records again. |
egfr.curation.json | Provenance: the source, the exact request addresses with access times, the database release, every step's settings and counts, the findings, the software version and the SHA-256 checksums of the table, the SD file and the raw snapshot. See Provenance and replay. |
egfr.removed.csv | Every removed measurement with the step and the reason. |
egfr.report.txt, egfr.report.pdf | The curation report: source, funnel, every step with its reasons, the distribution of the response, scaffolds, contributing publications and assays, activity cliffs, findings, checksums and references. Suitable as supplementary material. The same report is also offered as egfr.report.docx and egfr.report.xlsx. |
Files (4 of 9) opens the choice of files, and its header counts the files the current choice will write. The table and the provenance file are always written. Structures (SD file), Raw snapshot and Removal log are on by default and can be switched off, and the curation report is offered in four forms: Report (text) and Report (PDF) on, Report (Word) and Report (Excel) off. The PDF, Word and Excel forms are the same report in the three formats described in Reports and export, each carrying the company logo, the name of the program and the date and time it was written. Keep the raw snapshot unless space is short: without it a replay has to query the source again. After saving, Open report opens the PDF, or the Word document when no PDF was written, and Open folder shows the files. The last page's Close is refused until the dataset is saved; Cancel leaves without it.
Continuing into a modelling wizard
Open in spreadsheet opens the curated table as a dataset; a table that is open already, and unchanged, is shown rather than imported twice. Continue to 2D-QSAR, Continue to classification and Continue to 3D-QSAR open the dataset, close the builder and start the modelling wizard with the dataset, its structure column, its name column and its response or class column already set. The button that fits the study type is highlighted. A button is disabled with the reason when the dataset cannot feed it: This dataset has no class labels, or This dataset has no numeric response for a screening library.
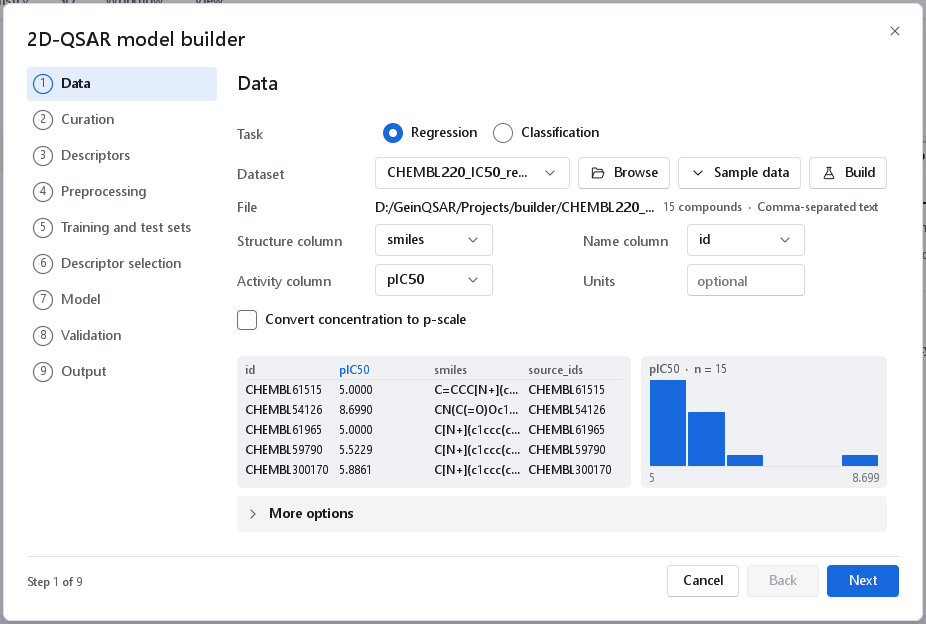
When the builder was opened with the Build button of a modelling wizard, the Continue buttons are not offered and Open in spreadsheet is the highlighted button. Press it and close the builder: the wizard underneath lists the new dataset under Dataset. See The 2D-QSAR wizard, Classification models and The 3D-QSAR wizard.
References
- A. P. Bento et al., The ChEMBL bioactivity database: an update. Nucleic Acids Res. 42, D1083-D1090 (2014).
- G. W. Bemis, M. A. Murcko, The properties of known drugs. 1. Molecular frameworks. J. Med. Chem. 39, 2887 (1996).
- D. Fourches, E. Muratov, A. Tropsha, Trust, but verify: on the importance of chemical structure curation in cheminformatics and QSAR modeling research. J. Chem. Inf. Model. 50, 1189-1204 (2010).
- D. Fourches, E. Muratov, A. Tropsha, Trust, but Verify II: A Practical Guide to Chemogenomics Data Curation. J. Chem. Inf. Model. 56, 1243-1252 (2016).
- A. Golbraikh, E. Muratov, D. Fourches, A. Tropsha, Data Set Modelability by QSAR. J. Chem. Inf. Model. 54, 1-4 (2014).
- B. Iglewicz, D. C. Hoaglin, How to Detect and Handle Outliers. ASQC Quality Press (1993).
- T. Kalliokoski, C. Kramer, A. Vulpetti, P. Gedeck, Comparability of Mixed IC50 Data: A Statistical Analysis. PLoS ONE 8, e61007 (2013).
- C. Kramer, T. Kalliokoski, P. Gedeck, A. Vulpetti, The Experimental Uncertainty of Heterogeneous Public Ki Data. J. Med. Chem. 55, 5165-5173 (2012).
- G. M. Maggiora, On outliers and activity cliffs: why QSAR often disappoints. J. Chem. Inf. Model. 46, 1535 (2006).
- G. Papadatos, A. Gaulton, A. Hersey, J. P. Overington, Activity, assay and target data curation and quality in the ChEMBL database. J. Comput. Aided Mol. Des. 29, 885-896 (2015).
- R. Ragno et al., Teaching and Learning Computational Drug Design: Student Investigations of 3D Quantitative Structure-Activity Relationships through Web Applications. J. Chem. Educ. 97, 1922-1930 (2020).
- A. Tropsha, Best Practices for QSAR Model Development, Validation, and Exploitation. Mol. Inform. 29, 476-488 (2010).