Publication figures
Every chart and every 3D view can be written as a figure at the size, resolution and look a journal asks for, without leaving the program.
A figure is not a screenshot. The program draws it again, off screen, at the physical size and resolution you ask for, so the text, the lines and the molecules are sharp at any size and the type comes out at the same point size whether the figure is written at 300 or 600 dpi. The view on screen is left as it was.
There are two figure dialogs: one for charts (scatter plots, curves, histograms, networks) and one for 3D views (structures, contour maps, atom cubes, pharmacophores). Both open from the camera button of the chart or of the 3D viewer toolbar.
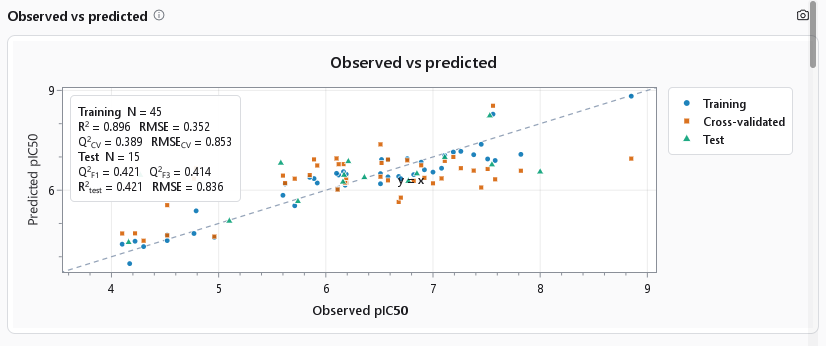
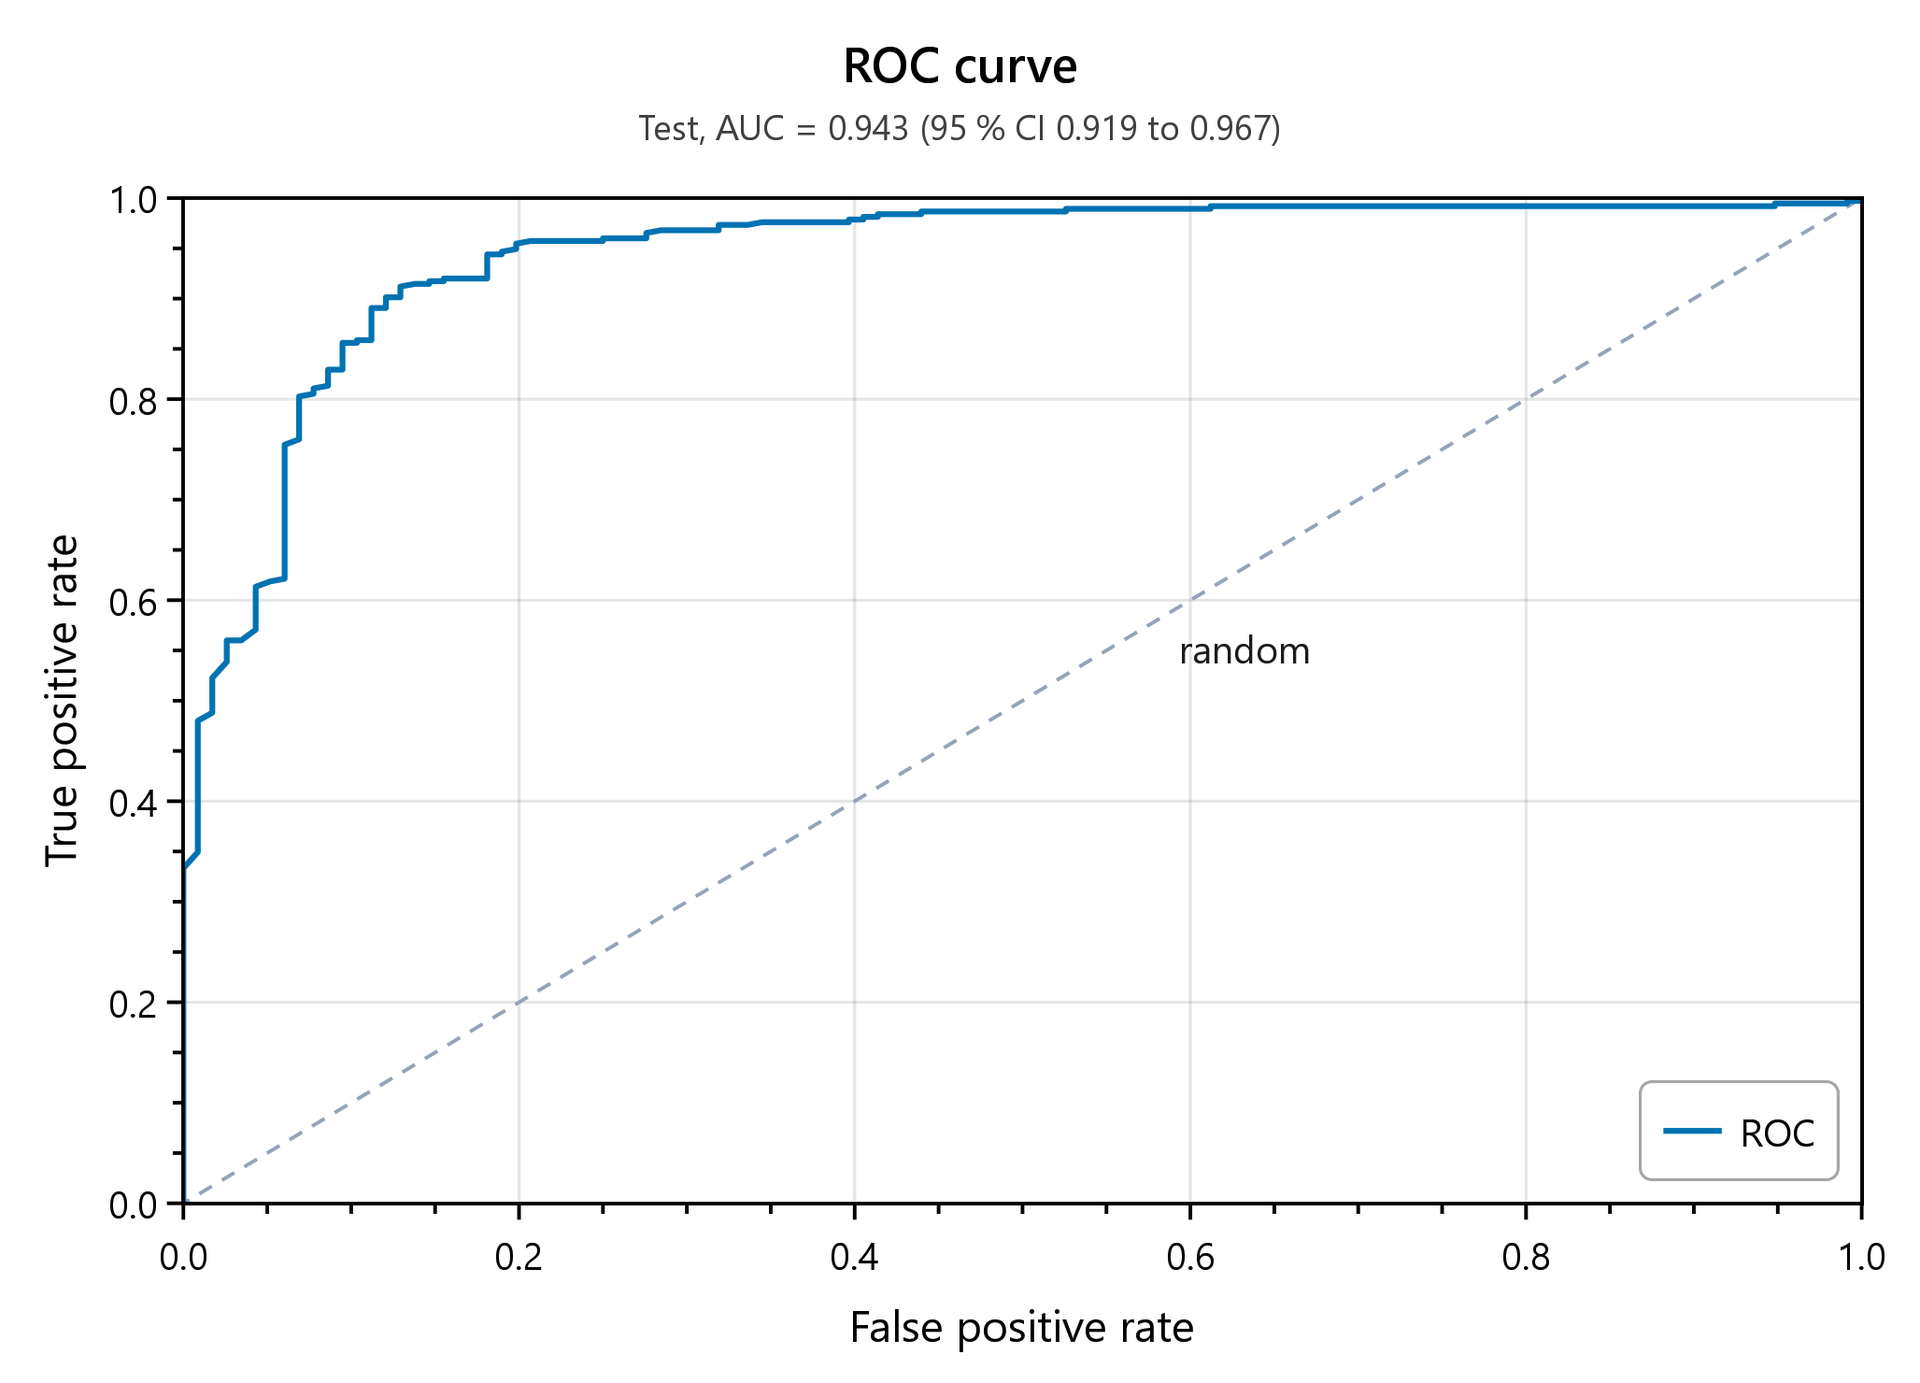
Chart figures
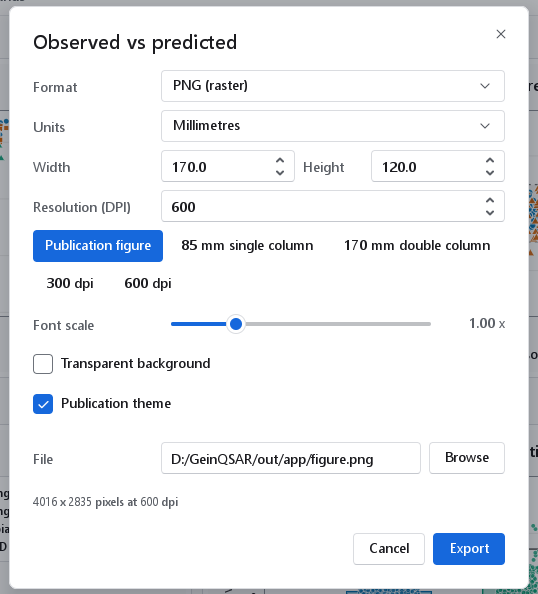
| Control | Default | Meaning, and when to change it |
|---|---|---|
| Format | SVG (vector) | SVG (vector) stays sharp at any magnification and can be edited in a drawing program; PNG (raster) is what most submission systems take. |
| Units | Millimetres | Millimetres, Inches or Pixels. Changing the unit converts the size, so the figure keeps its physical size: 170 mm becomes 6.693 in, or 4016 px at 600 dpi. |
| Width, Height | 170.0 by 120.0 | The size of the figure in the chosen unit. |
| Resolution (DPI) | 600 | Dots per inch of a PNG, 72 to 2400. Journals ask for 300 dpi for colour figures and 600 dpi or more for line art. |
| Publication figure | One step to an SVG of 170 by 120 mm at 600 dpi on white, with the publication theme and text enlarged by 1.15. | |
| 85 mm single column, 170 mm double column | 85 by 65 mm and 170 by 120 mm, the column widths most journals quote. | |
| 300 dpi, 600 dpi | The two usual resolutions. | |
| Font scale | 1.00 x | Multiplies every text size of the figure, 0.5 to 2.5. Raise it for a figure that will be printed small. |
| Transparent background | Off | Writes no background, so the figure can be laid over a coloured page or slide. |
| Publication theme | On | White background, black frame and larger text. Off keeps the look of the chart on screen. |
| File, Browse | Named after the chart | Where the figure is written; the extension follows the format. |
The chart in a figure is drawn from the same specification as the chart on screen and the chart in the report, so all three show the same numbers. After the export a notification names the file.
3D figures
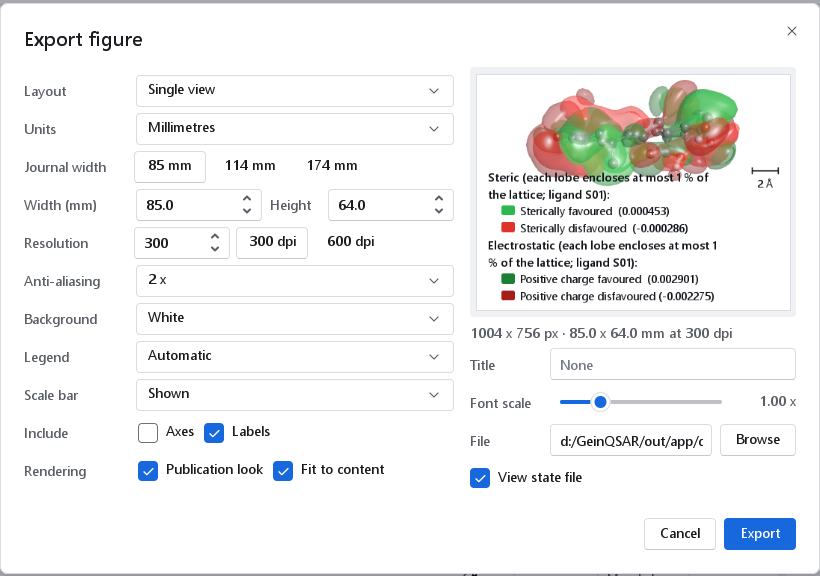
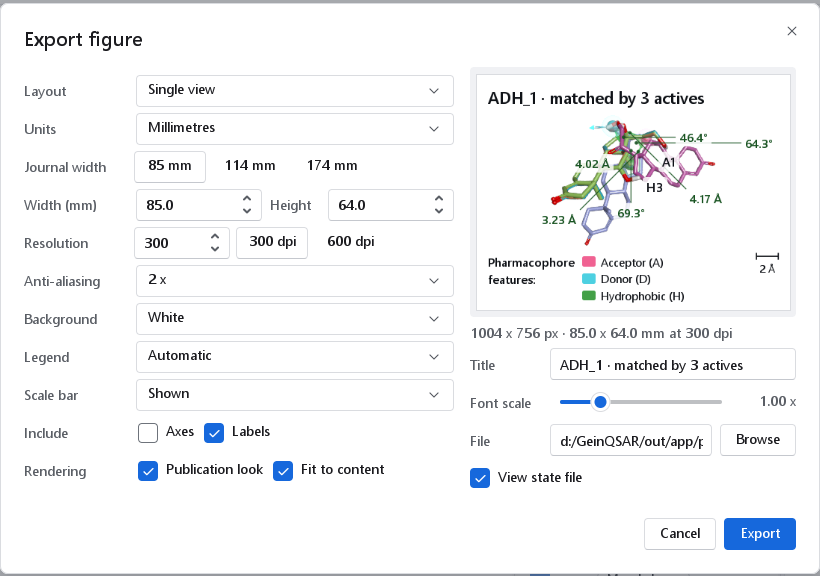
The camera button of a 3D viewer opens the 3D figure dialog. On the right is a preview: the same figure rendered at a low resolution, so what it shows is what will be written, legend and scale bar included. The size line under it gives the pixels, the millimetres and the resolution.
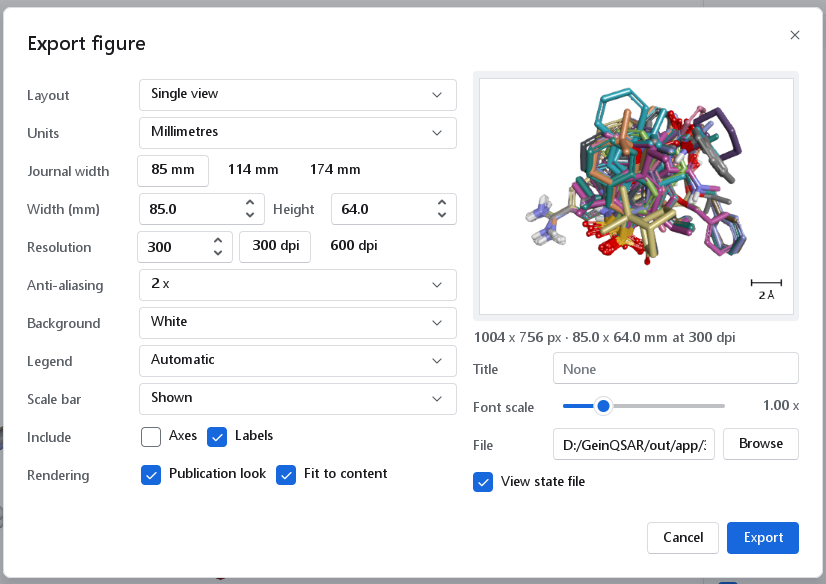
| Control | Default | Meaning, and when to change it |
|---|---|---|
| Layout | Single view | Single view, or Figure panels: several panels of the same scene, each with a letter. |
| Units | Millimetres | Single view only: millimetres at a resolution, or pixels (64 to 20 000 per side; the resolution then still sets the size of text and lines). |
| Journal width | 85 mm | 85 mm (single column), 114 mm (one and a half columns) and 174 mm (double column). A single view keeps its proportions when you change the width this way. |
| Width (mm), Height | 85.0 by 64.0 | 20 to 600 mm. A panel figure has a width only; its height follows from its panels. |
| Resolution | 300 | Dots per inch, 72 to 1200, with 300 dpi and 600 dpi as buttons. It is written into the PNG and sets the size of text and lines. |
| Anti-aliasing | 2 x | Samples per pixel edge, 1 x to 4 x. 2 x is right for print; higher is slower and rarely visible. |
| Background | White | White, Black, Transparent, Gradient or As on screen. White is what a journal prints. |
| Legend | Automatic | Automatic puts the legend below the scene when the figure is narrower than 120 mm or has more than one legend, and in the corner otherwise. In the corner, Below and Off set it by hand. |
| Scale bar | Shown | A bar of a round length in Ångström, or None. Keep it whenever sizes matter to the reader. |
| Include | Labels on, Axes off | Axes draws the axis triad, Labels the atom and distance labels of the view. |
| Rendering | Both on | Publication look: crisp outlines, contact shadows and print tone mapping, with the lighting of the view kept. Fit to content: frames the molecules and maps tightly; switch it off to keep the camera of the view on screen. |
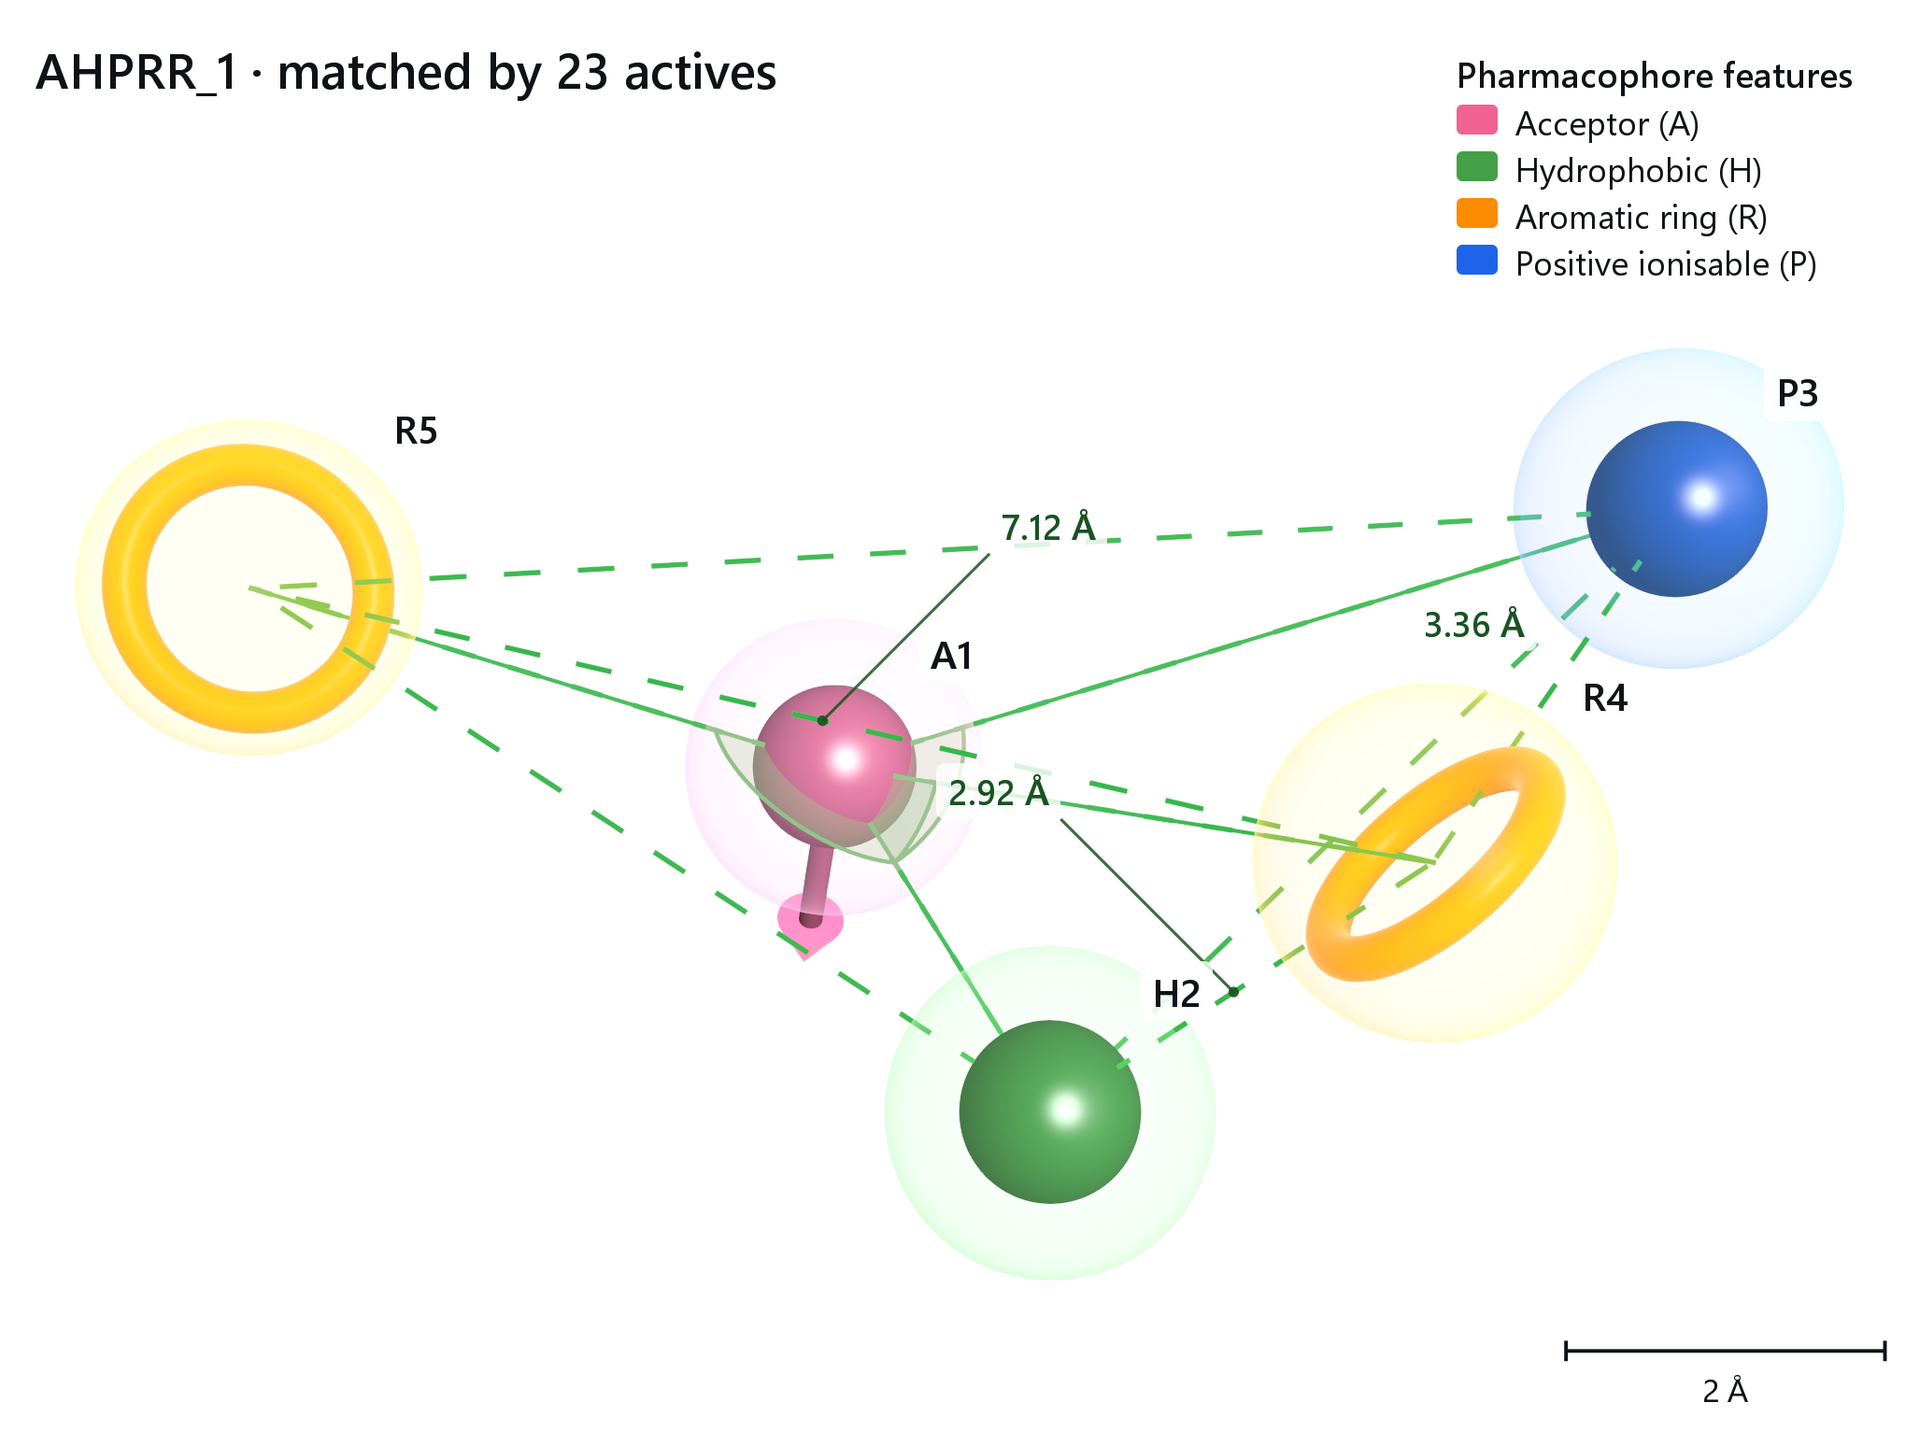
| Title | None | A title drawn into the figure: in the top-left corner of a single view, in a band above the panels of a panel figure. Some views fill it in, for example with the name of a pharmacophore hypothesis. |
| Font scale | 1.00 x | Enlarges the text of the figure, 0.5 to 2.5. |
| File, Browse | Where the PNG is written. | |
| View state file | On | Also writes <name>.view.json next to the image: the camera and the render settings of the figure. Load view in the View section of a 3D panel restores them, so the figure can be made again after the data change. The view state is embedded in the PNG as well. |
Multi-panel figures
Figure panels composes several panels of one scene into a single image, each panel with its letter, (A), (B), and so on, followed by what it shows. Every panel uses the same camera, fitted to the content of all of them, so sizes compare directly across the panels and one scale bar serves the whole figure. The legends of all panels are merged into one strip below the grid.
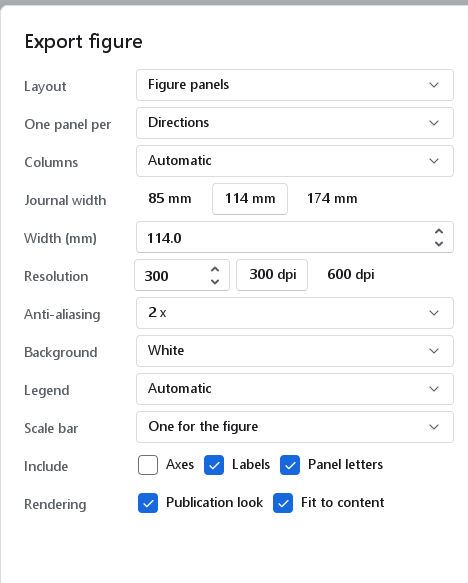
| Control | Default | Meaning |
|---|---|---|
| One panel per | depends on the view | Fields: one panel per field of a contour map. Atom classes: one panel per class of an atom-based model. Directions: best view, front, side and top, offered by every 3D view. Some views offer more, such as the excluded volumes of a pharmacophore. |
| Columns | Automatic | Automatic stacks the panels in one column below 120 mm, so each panel gets the whole width, and arranges them in a near-square grid at wider sizes (five fields in three columns). 1 to 4 set it by hand. |
| Width (mm) | The total width; the height follows from the panels (4:3 each, 2 mm gutters). | |
| Legend | Automatic | In a panel figure Below is one shared legend strip for the figure and In the corner one legend in every panel. When the legends in the panels would cover more than a quarter of a panel, or would not fit, the figure is written with one legend below instead, and the preview says Legend moved below. It warns Large legend when the legend takes more than a third of the figure. |
| Scale bar | One for the figure | One for the figure, In every panel, or None. |
| Panel letters | On | The (A), (B), ... labels; switch off to letter the panels in a layout program. |
Examples
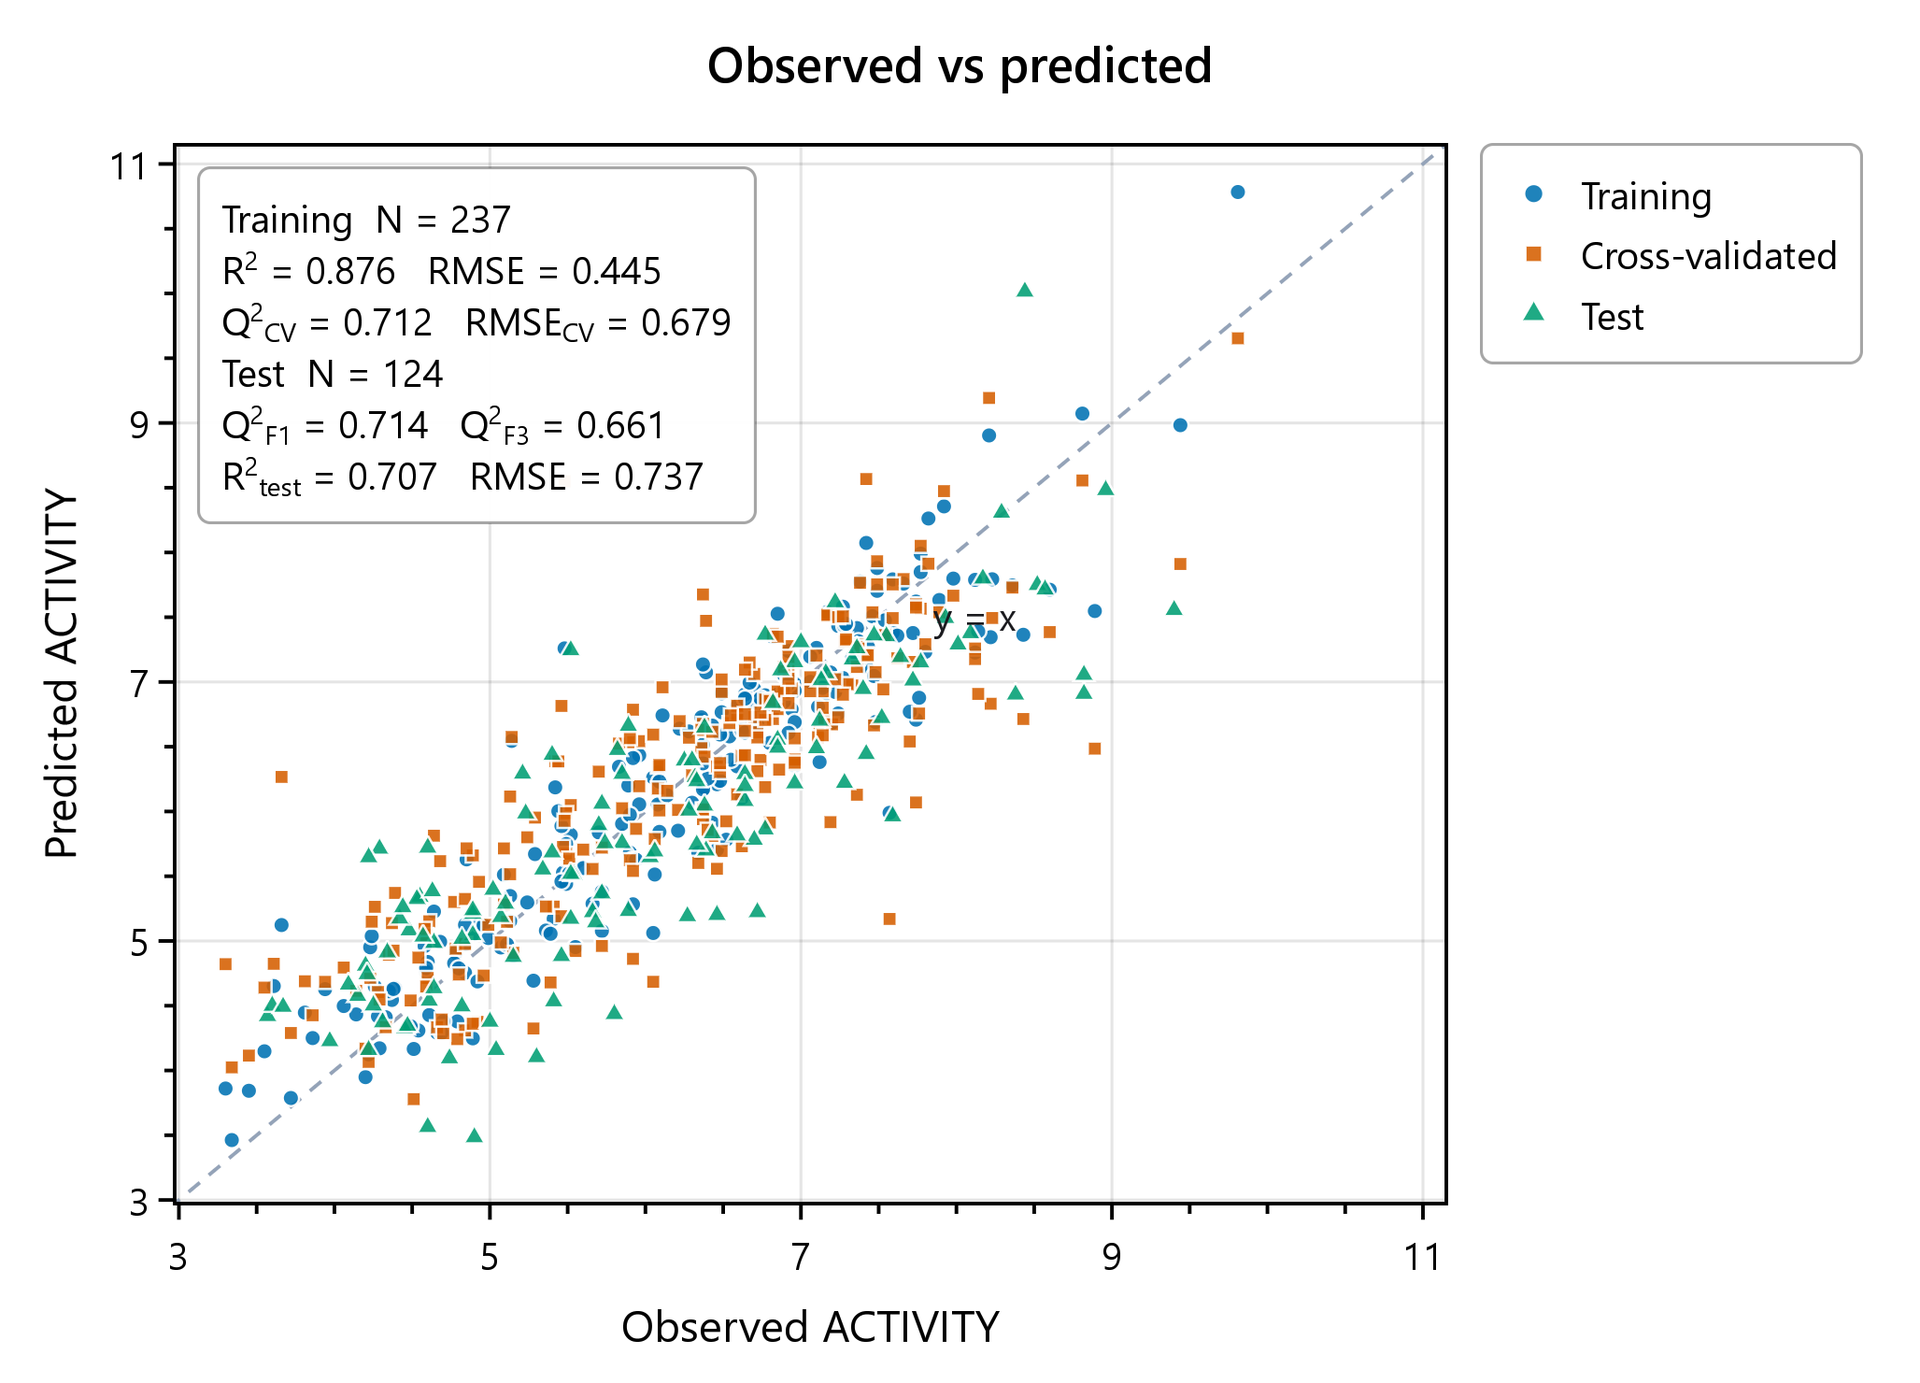
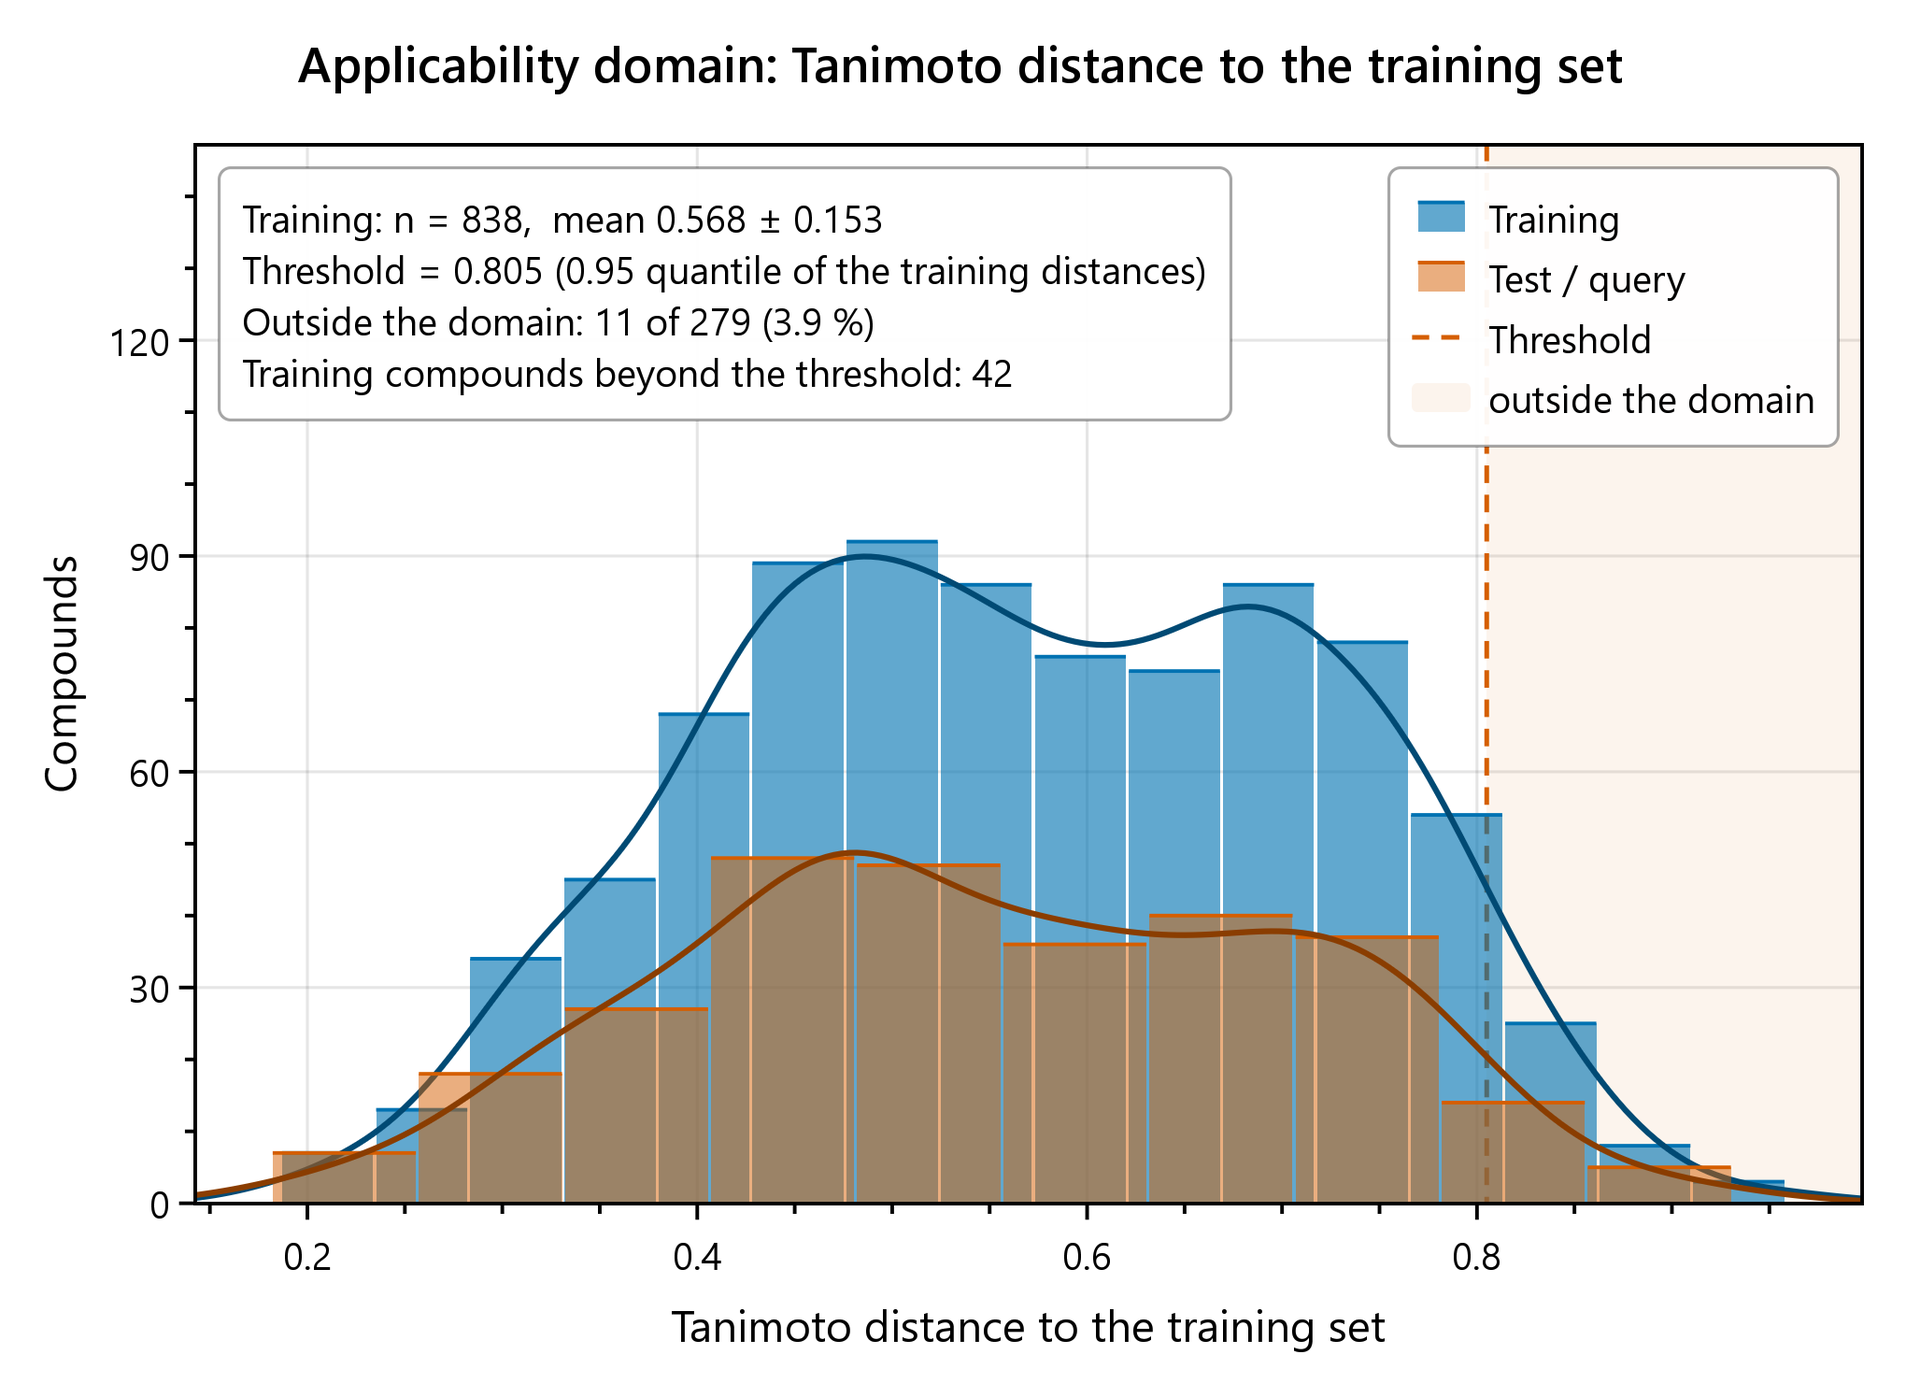
The figures below were written by the program with the dialogs described above, at 174 mm and 300 dpi, and are shown here unedited.
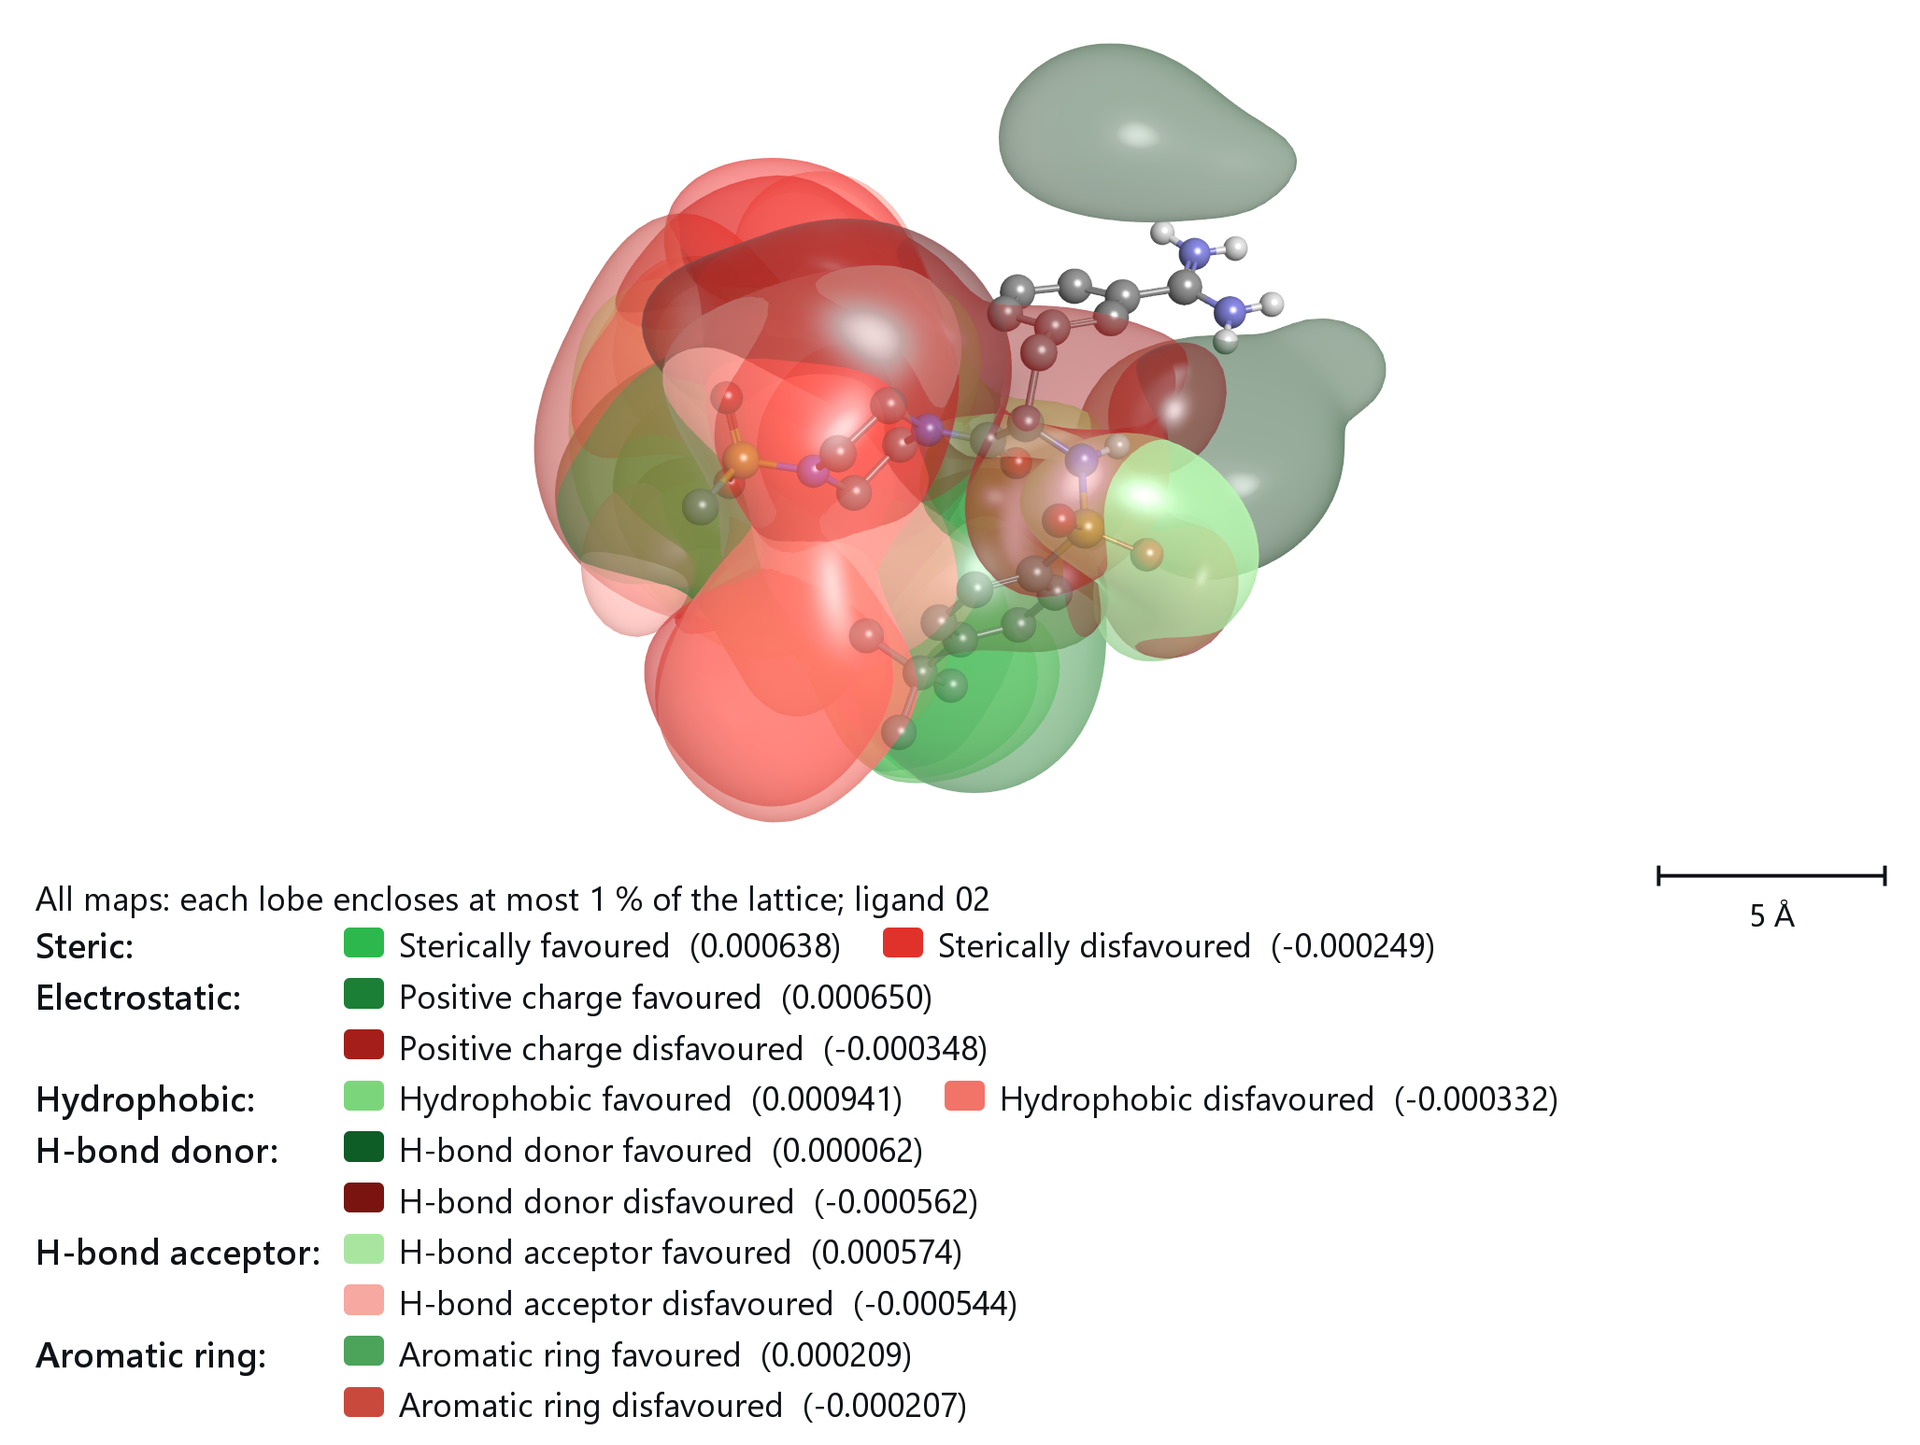
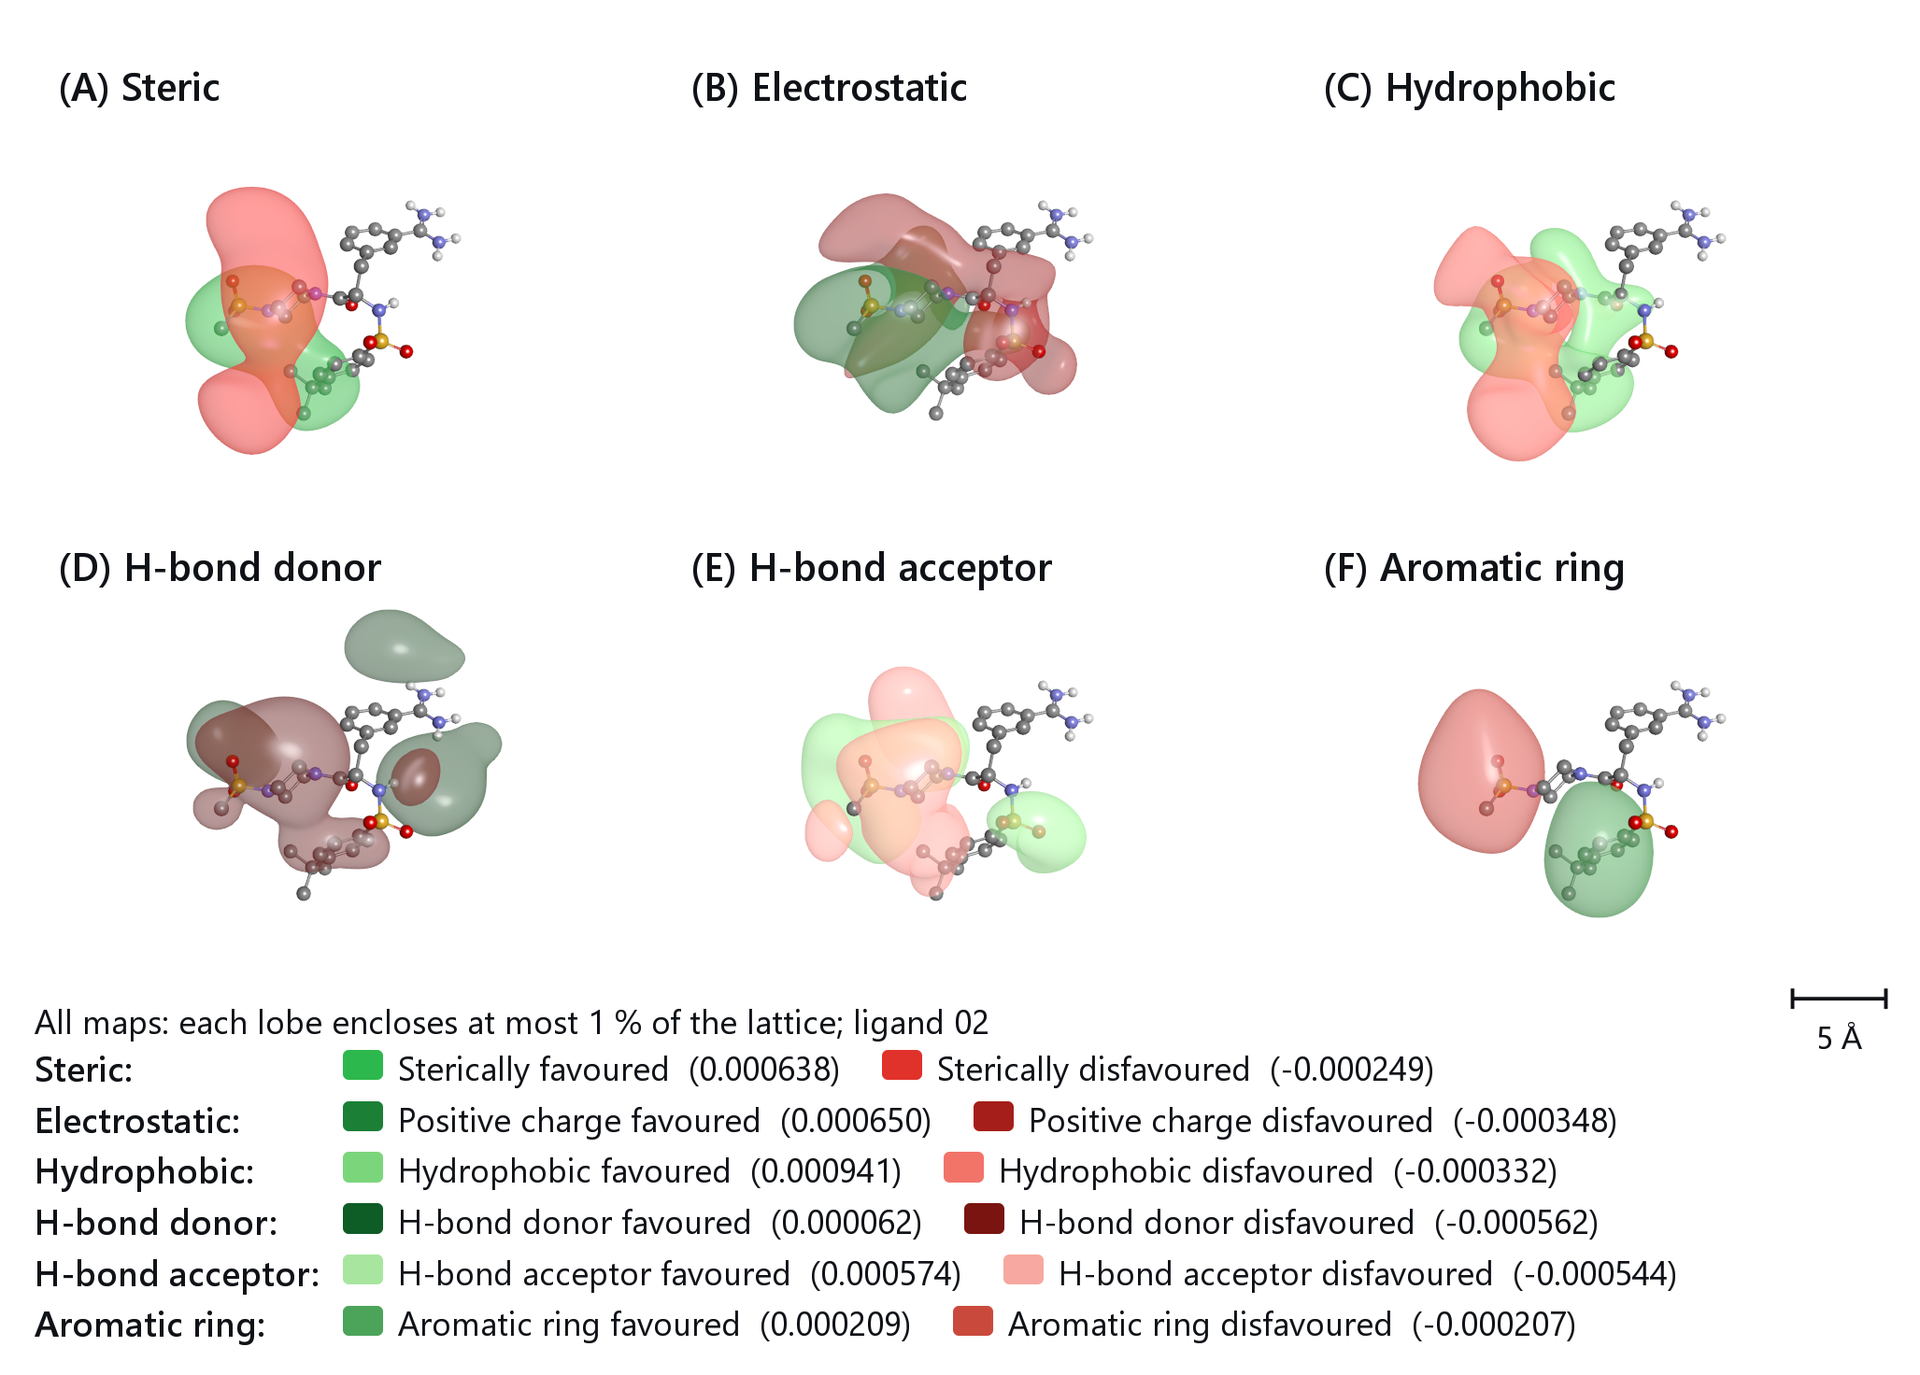
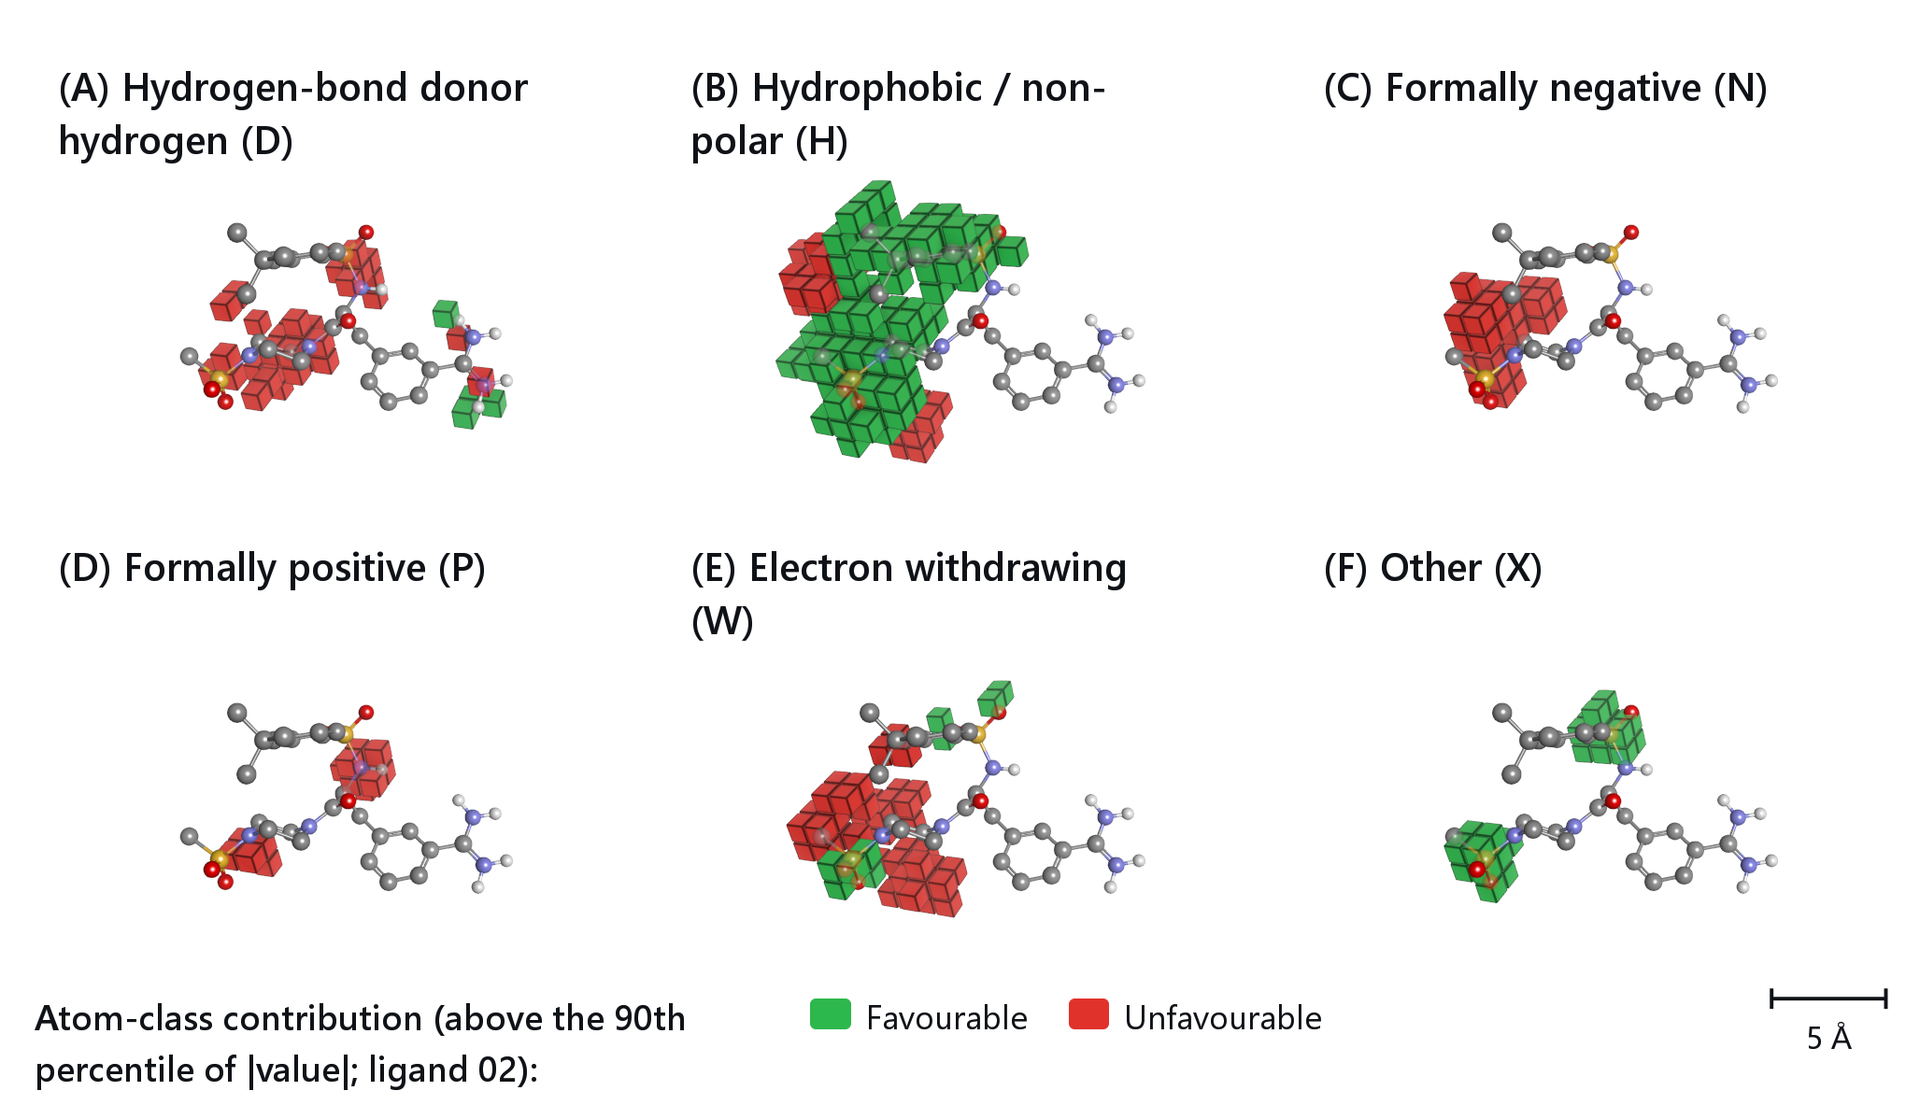
The dashboards that export these figures are described with The model dashboard, The 3D-QSAR dashboard, Contour maps and atom cubes and Pharmacophore hypotheses.