Accuracy and validation
What was measured to establish that GeinQSAR Studio computes what it claims, the results, the conditions under which they hold, and where they fall short.
The validation covered four aspects: the reading of real structures by the chemistry layer, the agreement of the learning algorithms and the printed statistics with independent implementations, the accuracy of the models relative to established tools on the same data, and the comparison of the 3D-QSAR methods on published benchmark sets. Where a comparison needed an independent program, an established reference implementation was used: an open cheminformatics toolkit for structures and descriptors, and a machine-learning library for the learning algorithms. Neither is part of GeinQSAR Studio. All results on this page were obtained with the program itself.
The public datasets were ESOL, FreeSolv, the Lipophilicity set of MoleculeNet, BACE, BBBP, an Ames mutagenicity set, acetylcholinesterase and hERG sets curated from ChEMBL with the program, and the eight sets of Sutherland, O'Brien and Weaver (J. Med. Chem. 2004, 47, 5541) with their alignments and their division into training and test compounds.
Structure handling and stereochemistry
The 17 057 unique SMILES of the public sets were read by the program and by the reference implementation. The program parsed all of them, the reference 17 046; the remaining 11 entries of BBBP have valences that the reference rejects. For the molecules parsed by both:
| Quantity | Compared | Agree | % |
|---|---|---|---|
| SMILES parsed by GeinQSAR Studio | 17 057 | 17 057 | 100.00 |
| SMILES parsed by the reference | 17 057 | 17 046 | 99.94 |
| Heavy-atom count | 17 046 | 17 046 | 100.00 |
| Net formal charge | 17 046 | 17 046 | 100.00 |
| Ring count (SSSR) | 17 046 | 17 046 | 100.00 |
| Aromatic atom count | 17 046 | 17 021 | 99.85 |
| Assigned tetrahedral centres | 17 046 | 17 045 | 99.99 |
| Assigned stereo double bonds | 17 046 | 17 046 | 100.00 |
| Unassigned tetrahedral centres | 17 046 | 17 013 | 99.81 |
| Unassigned stereo double bonds | 17 046 | 16 851 | 98.86 |
| CIP descriptors of atoms (R/S, r/s) | 7 622 | 7 622 | 100.00 |
| CIP descriptors of double bonds (E/Z) | 1 019 | 1 019 | 100.00 |
| Canonical SMILES re-read: same InChIKey | 17 046 | 17 045 | 99.99 |
| Canonical SMILES invariant to atom order | 17 046 | 17 045 | 99.99 |
| SD reader: stereo-free InChIKey equal (Sutherland files) | 1 337 | 1 337 | 100.00 |
Canonical SMILES written by the program and read back by the reference gave the InChIKey of the input for all molecules but one, and they did not change when the atoms of each molecule were reordered at random five times, again with one exception. Aromaticity differed in 0.15 % of the molecules, which reflects the two aromaticity models. Six defects of the chemistry layer were found by this comparison and corrected before the final run.
Descriptor concordance
Descriptors with the same published definition in both programs were compared on the same 17 046 molecules. The table gives the percentage of molecules with identical values (difference at most 10-6), as the median and the minimum over the descriptors of each family.
| Family | Descriptors | Median % | Minimum % | Main cause of differences |
|---|---|---|---|---|
| Constitutional counts and masses | 5 | 100.0 | 55.4 | atomic-weight tables; electron mass of ions |
| Ring perception | 10 | 100.0 | 99.5 | definition of bridgehead atoms in cage systems |
| Aromaticity-dependent counts | 3 | 99.5 | 99.5 | aromaticity model |
| Hydrogen-bond counts | 4 | 100.0 | 61.9 | pattern definitions (S-H donors; acceptor definition) |
| Topological polar surface area | 2 | 92.0 | 92.0 | nitro group entry of the table (2.68 Å2 per group) |
| Wildman-Crippen log P and MR | 2 | 99.0 | 99.0 | P=S sulfur type; aromaticity model |
| Connectivity indices, simple | 2 | 100.0 | 100.0 | none |
| Connectivity indices, valence | 5 | 93.4 | 86.6 | formal charge in delta-v; ring subgraphs counted as paths by the reference |
| E-state indices | 3 | 93.5 | 93.2 | formal charge in delta-v |
| Distance-based indices | 5 | 100.0 | 100.0 | none |
| Rule counts | 2 | 99.9 | 99.2 | threshold cases of the ingredients |
| Rotatable bonds | 2 | 95.3 | 82.7 | definition (ester C-O, nitro, bonds next to triple bonds) |
| Kappa shape indices, Hall-Kier alpha | 4 | 24.9 | 10.3 | hybrid state of conjugated N/O; kappa3 formula for even atom counts |
| QED | 3 | 27.3 | 26.6 | structural alerts, acceptor and rotatable-bond definitions |
| Balaban J (the reference's variant) | 1 | 4.5 | 4.5 | the reference weights distances by bond order |
| Bertz complexity | 1 | 0.0 | 0.0 | different conventions; no published numeric table |
| Labute ASA | 1 | 0.0 | 0.0 | radius set |
| Gasteiger charges (atoms within 0.001 e) | 1 | 56.6 | 56.6 | hybrid state assigned to conjugated N and O |
| MACCS keys (agreement per key) | 166 | 100.0 | 54.6 | reconstructed key definitions differ for ring and CH2 patterns; aromaticity |
| ECFP4 (number of environments) | 1 | 99.7 | 99.7 | hash values differ by design; the same number of atom environments is compared |
Atom, ring and Lipinski counts, the simple connectivity indices and the distance-based indices are identical. TPSA and the Wildman-Crippen values agree for 92 % and 99 % of the molecules; the differences were traced to the entry used for nitro groups and to the atom type of thiophosphoryl sulfur. Valence connectivity and E-state indices differ only for molecules with charged atoms, where the two programs treat the formal charge differently, and are identical on the subset without charged atoms.
Where the definitions themselves differ (rotatable bonds, pattern-based acceptors, the Hall-Kier alpha, Labute surface area, Bertz complexity) the values correlate but are not equal; these are documented conventions, not errors. QED is a case in point: the program applies the published formula of Bickerton (2012) to its own structural alerts and acceptor definition, so its values correlate with those of the reference (r = 0.92) without reproducing them. Compare QED values only within GeinQSAR Studio.
Dataset curation
| Check | Result |
|---|---|
| p-scale value against the pChEMBL value published by ChEMBL | 41 193 of 41 193 records agree (62 628 activity records for three targets downloaded; 41 193 carry a pChEMBL value) |
| Standardised structure against the largest-fragment and neutralisation procedure of the reference, by InChIKey | 37 303 of 37 305 identical, including all 1 976 salts and solvates; the other 2 are sulfoximines that the program normalises by design |
| Datasets regenerated from their provenance files | 13 of 13 with the recorded checksum |
As an example of what the curation removes: for human acetylcholinesterase (ChEMBL release 37), 10 079 IC50 records were reduced to 5 627 compounds. 892 records were censored, 1 361 had no convertible value, 1 370 were flagged by the database as invalid or as repeated citations, and the rest were merged as replicates.
The first use of the Dataset Builder on live data exposed a defect, corrected before release: PubChem data tables that cover several proteins had been pooled under the first target, censored values were read as exact, and the activity type of each row was ignored. Records now carry the target, relation and type of their own row, and a multi-target table is curated only after one target has been chosen.
Learning algorithms and reported statistics
| Check | Result |
|---|---|
| Each learning algorithm against its counterpart in the reference library, on identical matrices, folds and hyper-parameters, with tolerances fixed beforehand | 46 of 54 comparisons within tolerance, most of them to rounding error |
| Statistics printed in the validation reports (training, cross-validation, test, response randomisation and domain statistics, regression and classification), recomputed from the exported predictions with independent code | 13 355 of 13 355 agree within 10-9 (largest difference 5.2 x 10⁻¹³) |
| Robustness scenarios through the command line: input formats, missing and censored activities, bad values, set sizes from one compound upwards, every model, split and cross-validation scheme | 205 of 205 behave as specified |
The 46 agreeing comparisons include multiple linear regression, ridge, PLS, principal component regression, Gaussian process and support vector regression, logistic regression, discriminant analysis and the tree ensembles. The other 8 have an established cause: the order of tied neighbours, the default convergence tolerance of the coordinate-descent solvers, and variance floors on constant columns. The comparison found one defect, a near-constant column that the internal standardisation of ridge regression divided by rounding noise; it was corrected. The robustness scenarios pass in all 205 cases, after twelve defects found by their first pass had been corrected. A thirteenth was found late: on some charts of a stepwise multiple-regression model, and of a PLS model asked for far more components than the data support, chart labels overlapped, and the report then refused to write itself. The chart now leaves out a label it cannot place clear of its neighbours, rather than drawing it over them, and those reports are written.
2D benchmarks on public datasets
The default recipes of the 2D-QSAR wizard were chosen by repeated cross-validation, with every fitted step inside the folds, on twelve datasets: acetylcholinesterase, ESOL, FreeSolv, hERG and the eight Sutherland sets. On the eleven regression sets among them the default recipe reached a mean Q2 of 0.61, the interpretable variant 0.55, and a recipe that selects six descriptors from all columns before a three-component PLS model 0.38.
Lipophilicity, BACE, BBBP and the Ames set took no part in that choice, so the accuracy on them is independent of it. The benchmark comprised 1 084 runs without a failure. The table gives the test-set accuracy on identical training and test rows for the default recipe, for the best fixed recipe of the program, and for the best recipe of the reference implementation (its descriptors with its models). Random splits: mean ± standard deviation over five stratified 80/20 splits; scaffold splits: one split.
| Dataset | Training / test | Statistic | Default recipe | Best fixed recipe | Reference | Literature range |
|---|---|---|---|---|---|---|
| Not used in the choice of recipes | ||||||
| Lipophilicity | 3360 / 840 | RMSE | 0.713 ± 0.038 | 0.669 ± 0.027 (svr) | 0.642 ± 0.022 (svr) | 0.66 to 0.90 |
| BACE pIC50 | 1211 / 302 | RMSE | 0.701 ± 0.025 | 0.685 ± 0.027 (svr) | 0.714 ± 0.039 (gbm) | |
| BACE classes, scaffold split | 1210 / 152 | AUC | 0.832 | 0.839 (knn) | 0.831 (knn) | 0.78 to 0.87 |
| BBBP, scaffold split | 1631 / 204 | AUC | 0.765 | 0.731 (svc) | 0.708 (logreg) | 0.67 to 0.73 |
| BBBP | 1631 / 408 | AUC | 0.938 ± 0.010 | 0.936 ± 0.011 (rf) | 0.943 ± 0.007 (rf) | |
| Ames mutagenicity | 5822 / 1456 | AUC | 0.916 ± 0.005 | 0.914 ± 0.006 (rf) | 0.914 ± 0.005 (rf) | |
| Used in the choice of recipes | ||||||
| ESOL | 903 / 225 | RMSE | 0.675 ± 0.051 | 0.552 ± 0.048 (gbm) | 0.564 ± 0.060 (gbm) | 0.58 to 1.53 |
| FreeSolv | 514 / 128 | RMSE | 1.162 ± 0.122 | 1.043 ± 0.061 (gbm) | 0.974 ± 0.105 (gbm) | 1.15 to 2.11 |
| Acetylcholinesterase pIC50 | 343 / 86 | RMSE | 0.776 ± 0.052 | 0.767 ± 0.065 (svr) | 0.822 ± 0.040 (gbm) | |
| hERG classes | 443 / 111 | AUC | 0.871 ± 0.030 | 0.843 ± 0.029 (gbm) | 0.819 ± 0.031 (svc) |
Recipe names: svr, support vector regression; gbm, gradient boosting; rf, random forest; knn, k-nearest neighbours; svc, support vector classifier; logreg, logistic regression. The literature range is the range of the test-set values of the models reported with MoleculeNet, obtained with another protocol (an 80/10/10 split with hyper-parameter tuning); it is given for orientation only.
On identical rows the program and the reference were equally accurate: neither was better on every set, and the differences were within the variation between splits. The linear default recipe was less accurate than the best non-linear recipe on the three physicochemical sets, by 0.04 to 0.12 in RMSE; that is the price of a model whose latent variables can be inspected.
Applicability domain
With the default recipes, 88 % of the test compounds (mean coverage 0.876) lay inside the applicability domain on average over 17 datasets, and the compounds outside it had the larger error in 11 of them. When models for one target were given compounds of other targets and of the physicochemical sets, the Tanimoto-based domain of the default recipe placed 99 % of them outside.
How precisely a figure of a small series can be read
The public sets above hold hundreds or thousands of compounds. A congeneric series of a medicinal chemistry project holds tens, and that changes what its statistics mean rather than only how large they are. The question was put to 90 independent ChEMBL series of 32 to 131 compounds, 40 of them chosen and frozen with their checksums before any model was run on them.
- A test statistic from such a series is imprecise. A 50-compound series leaves about a dozen test compounds, and the test estimate of the default recipe was unbiased in direction (median gap +0.029 against compounds held back from the whole study) but its median absolute gap was 0.290, about 30 % of the value. Changing the split method does not mend this: it is the arithmetic of a dozen compounds. Quote the cross-validated statistics with their spread, or repeat the split with other seeds and quote that spread, rather than one test R2 to three decimals.
- The cross-validated estimate is a fair estimate of the external error; the training fit is not. Over these series the ratio of the cross-validated error to the external error was 0.97, while the median training R2 was 0.85. The program therefore leads its dashboards and its reports with the cross-validated and external figures and labels the training figures a fit.
- Prediction is not assured at all. The default recipe predicted the hold-out better than the training mean on 33 of the 40 fresh series, which is 83 %, and on 65 of all 90, which is 72 %. On 8 of the 90 no model family tried predicted better than the mean, and on those the honest answer is that the series does not support a model.
The program applies these two observations itself. The Data page of the 2D-QSAR wizard measures the activity standard deviation and the cliff density of a series as soon as its activity column is chosen, and shows an amber note when either crosses its threshold; the note never blocks a model, and its tooltip gives the figures above together with the measured values of your series. The report carries the same note as its Series guidance row. See The 2D-QSAR wizard, and the cliff analysis for a closer look at the cliffs themselves.
Six model families known to suit small sets were compared against the default on these series, in a comparison whose rule was fixed in advance: the default PLS recipe, PLS without hashed fingerprints, a Gaussian process on a MinMax kernel over count fingerprints, a random forest, support vector regression and the training mean as a reference arm. On the series already seen, three of them looked better than the default. On 40 fresh series, frozen with their checksums before any candidate was run on them, none held up, and the default was left unchanged. That gap between the two halves is the selection effect a fresh confirmation set exists to catch, and it is the reason the defaults of this program are not chosen on the data they are reported on.
3D-QSAR: the benchmark of 59 data sets
KEFRA and the atom-based cubes were compared on 59 data sets, with the comparison and its test fixed before KEFRA was run on them. The two performed alike: the median test Q2F3 was 0.28 for KEFRA and 0.21 for the cubes, a difference that was not significant. KEFRA ran a whole pass of the benchmark in 23 s, where the cubes took 69 minutes, and it reports a prediction uncertainty and an applicability domain for every compound.
On the eight datasets of Sutherland, O'Brien and Weaver, modelled with the authors' alignments, partial charges, lattice boxes and training and test sets, the atom-based model reached, with its own rule for the number of components, a mean q2 of 0.59 and a mean predictive r2 of 0.50.
Sensitivity to choices that are seldom reported
Shifting the lattice by fractions of its spacing changed the q2 of a lattice field model by 0.02 to 0.13 within a set and the predictive r2 by 0.03 to 0.26; rotating the aligned set changed q2 by up to 0.32, in line with the dependence on orientation described by Cho and Tropsha. Differences of this size between two implementations of a lattice method are therefore within what the placement of the lattice alone can produce. When comparing a model of your own with a published one, report the lattice placement, the orientation and the reference molecule of the alignment.
3D-QSAR: the steroid benchmark
The corticosteroid-binding globulin steroids (31 compounds) are the classical 3D-QSAR steroid benchmark of Cramer, Patterson and Bunce (1988). The structures were built from SMILES by the program and verified against the corrected data of Coats. The maximum common substructure found by the alignment is the complete steroid nucleus with the oxygen at position 3, and with conformer selection the nuclei of the nineteen 4-en-3-one steroids superpose with a mean deviation of 0.08 Å.
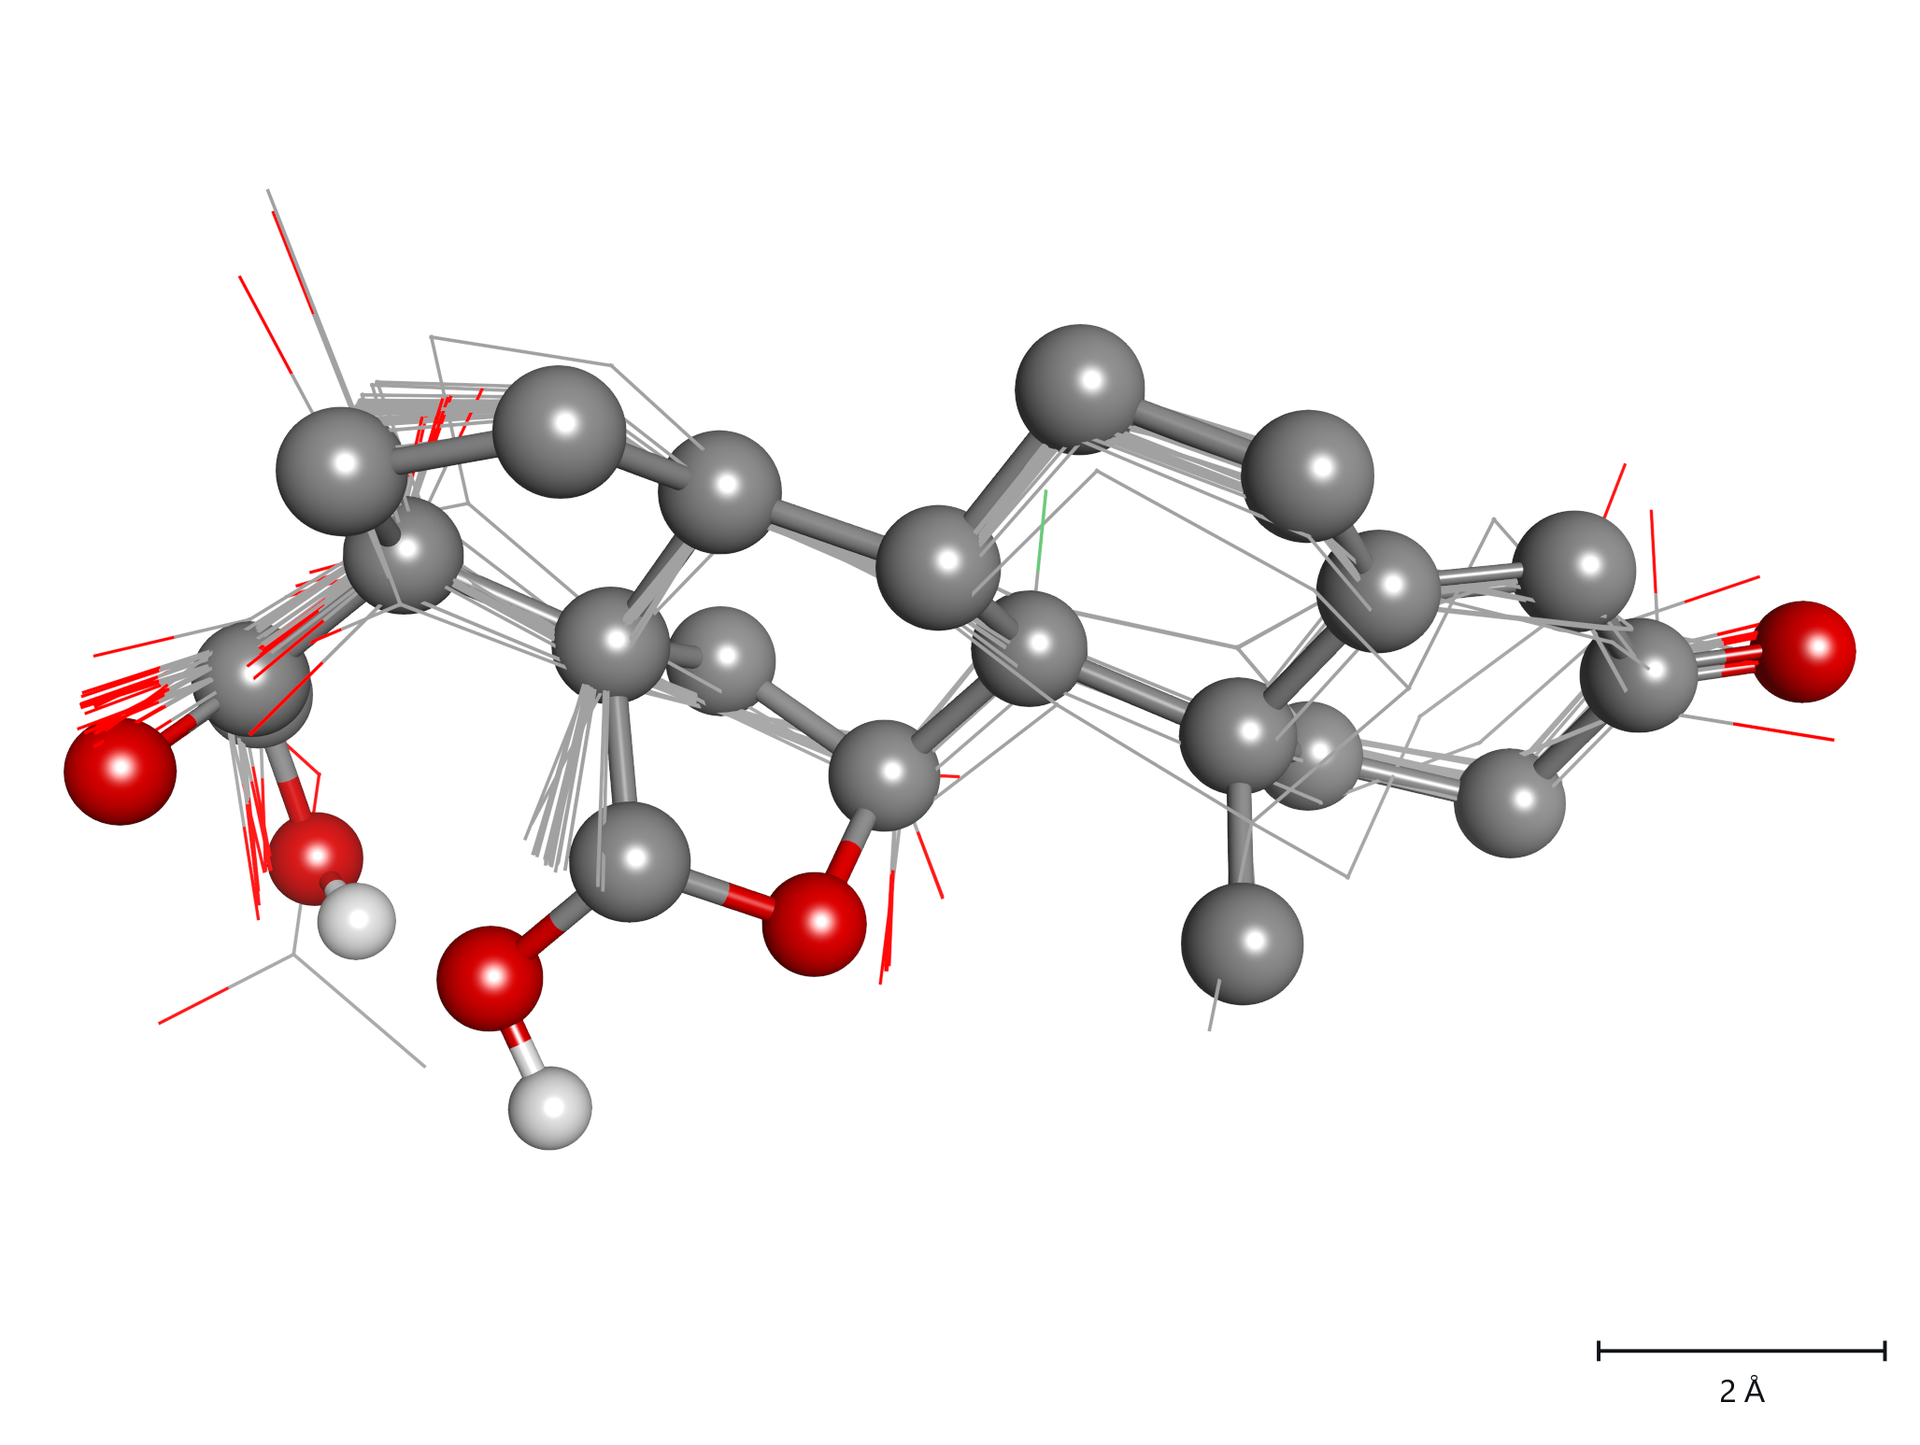
The cross-validated q2 of a model of this series depends strongly on which molecule is the reference of the alignment, so a value above a published one is not in itself a finding. Compounds predicted again from unaligned structures through a saved model were returned with their fitted values, which shows that the recorded alignment is replayed exactly when a model is applied to new compounds.
3D structure generation and geometry quality
The 3D structure generator was tested on 417 molecules. All were built with their constitution and all 737 specified stereocentres intact, and no pair of non-bonded heavy atoms came closer than 2.4 Å.
| Quantity | GeinQSAR Studio | Reference |
|---|---|---|
| Saturated six-membered rings built as chairs (of 107) | 86 | 82 (lowest-energy conformers of the reference's distance-geometry method with MMFF94) |
| Median deviation from the nearest reference conformer, up to two rotatable bonds | 0.2 Å | |
| Median deviation from the nearest reference conformer, three to five rotatable bonds | 0.5 Å |
Contour surfaces are extracted from a spline-refined lattice with gradient normals; for a Gaussian lobe on a 2 Å lattice the enclosed volume is within 0.11 % of the exact value, against 20.7 % for direct contouring of the lattice.
Known limitations
- The only force field is UFF. MMFF94 is not implemented.
- The conformer search covers the low-energy conformers of molecules with up to six rotatable bonds well and those of more flexible molecules incompletely; nitrogen inversion is not sampled.
- Alignment by pharmacophore features is unreliable for series with few features, and no alignment method rebuilt the published GPB alignment from the structures alone.
- The hydrophobic parameters are the atomic contributions of Wildman and Crippen, not those of other programs, so a published model built with other parameters is not reproduced number for number.
- The default recipes and the domain rule were chosen on some of the datasets on which they are reported (see above).
- The calibrated prediction interval of a designed library covers its nominal rate when the data sets are pooled, but on an individual data set it missed that rate in 39 % of cases, by up to 11 percentage points either way, and every data set whose coverage could be certified carried 97 or more calibration compounds. Between 20 and 100 the interval is reported and marked approximate; below 20 it is not reported at all.
- The pan-assay interference patterns of the library filter are 52 patterns of the program's own, not the whole published set. Against an independent implementation of the 480 published filters on 7 160 structures they recover 65 % of what it flags, with 60 % precision. Use the filter to thin a library, not as evidence that a molecule is clean.
- The synthetic accessibility score was fitted on the 1 216 structures shipped with the program, so it ranks molecules against those rather than against a synthesis database.
- The retrospective validation of library design on several targets with real analogue series has not been run. What is reported is one worked series, on which the design recovered all six compounds held out of it.
- Random forests with full validation on several thousand compounds and descriptors take minutes rather than seconds.
- QED, rotatable bonds, pattern-based acceptors, the Hall-Kier alpha, Labute surface area and Bertz complexity follow their own documented conventions and do not equal the values of other programs.
- The program runs on Windows only. Multi-monitor changes of display scaling and notebooks with hybrid graphics have not been tried on hardware, and the 3D rendering was last checked in full on one graphics adapter.
- The network client follows the proxy configured in Windows but has not been tried against a real proxy, and a proxy that asks for a user name and password is not supported.