Reports and export
The report of a dashboard or a workflow as PDF, Word and Excel, the tables behind it, and the files a dataset, a model and a run can be written to.
A report holds the statistics, the figures and the tables of a result, judged against the OECD principles for the validation of QSAR models. It is written in three formats, from one document: a PDF for reading and for attaching to a submission, a Word document for a report that will be edited further, and an Excel workbook for the numbers. Because all three come from the same document they cannot disagree with one another, and because a report never recomputes anything it cannot disagree with the dashboard or with the files the workflow wrote.
The three formats
| Format | What it is for | What it holds |
|---|---|---|
PDF (.pdf) | Reading, printing, attaching to a submission or to a manuscript as supporting information. | The paged report. A cover page with the company logo, the title, the study, the endpoint, the model, the numbers of training and test compounds, the author, the name and version of the program, the local date and time, the same moment again in ISO 8601 with its zone offset, the report identifier, the company, and the standard the report follows. Then a table of contents, a list of figures and a list of tables, the numbered sections, and appendices for the long tables. Charts and structures are drawn as vector graphics, so they stay sharp at any magnification. The logo, the program name and the title run across the head of every page, and the report identifier, Page X of Y and the time stamp across its foot. The PDF carries bookmarks for every section. |
Word (.docx) | A report that will be edited, commented on or merged into a larger document. | The same sections as real Word headings, with a table of contents, a list of figures and a list of tables that fill themselves when the document is opened, and tables that are Word tables rather than pictures of tables. The header and footer carry the same logo, name and stamp. |
Excel (.xlsx) | The numbers, for a calculation or a plot of your own. | A Summary sheet with the cover facts and the statistics, a Predictions sheet, one sheet per table of the report, and a Figures sheet with the figures. Numbers are written as numbers, at the precision they were computed with, not as rounded text. |
Paper chooses between A4, the default, and US Letter. It sets the page size and the margins of the PDF and of the Word document; the Excel workbook has no page size. Choose Letter before writing a report for a journal or an agency that asks for it, because the layout is made for the paper rather than scaled to it afterwards.
Every report carries the identifier the program gives it, in the form GQR-YYYYMMDD-HHMMSS-XXXXXXXX, where the last part is computed from the content of the report. Two reports of the same result written at different moments therefore have different identifiers, and a report can be cited by one.
Writing a report from a dashboard
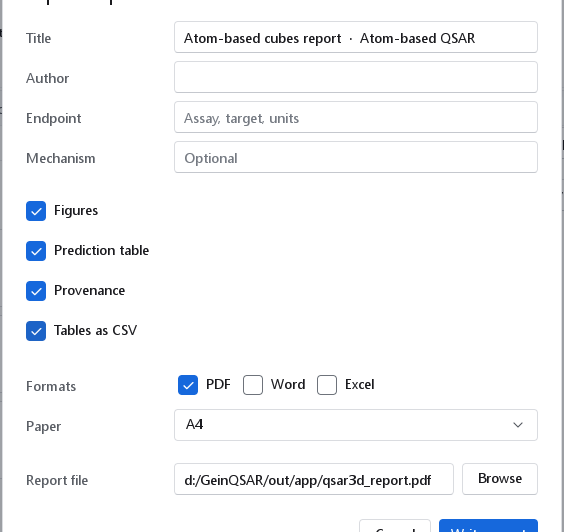
Every dashboard has Export report at the right end of its tab bar. It opens the report dialog; Write report writes the file, and a notification names it.
| Control | Default | Meaning, and when to change it |
|---|---|---|
| Title | The name of the dashboard | The heading of the report. |
| Author | Empty | Shown in the header line of the report. |
| Endpoint | Empty | OECD principle 1, a defined endpoint: the assay, the target, the units and how the response was measured. Without it that principle is reported as only partly met. |
| Mechanism | Empty | OECD principle 5, the mechanistic interpretation. Left empty, the report states that none was established rather than asserting one. |
| Figures | On | Embeds the figures of the dashboard as vector graphics. |
| Prediction table | On | Embeds the per-compound predictions. |
| Provenance | On | Embeds the program version, the random seeds and the timings. |
| Tables as CSV | Off | Shown when the dashboard has tables. Also writes every table of the report as a CSV file next to it, named after the report and the table (<report>_<table>.csv); the tooltip lists the files. For a 3D-QSAR report these are the per-factor statistics, the field contributions, the model statistics, the per-compound predictions, the alignment report and the contour levels; for a 2D model report the cross-validated predictions, the Y-randomization runs and the per-compound applicability domain; for a classifier the cross-validated predictions, the permutation scores and the applicability domain; for a cliff analysis the pair table. |
| Formats | Which of the three formats are written. At least one must be chosen, or the dialog refuses. Word and Excel are off by default, so a report is one file unless more are asked for. | |
| Paper | A4 | A4 or US Letter, for the PDF and the Word document. |
| Report file, Browse | Named after the dashboard | Where the report is written. The Word and Excel files take the same name with their own extension. |
The workflow that produced the result is embedded when it is still open, which completes OECD principle 2 (an unambiguous algorithm). When it was closed the dialog says No workflow attached: keep the workflow open to embed it, and the report documents the model and its parameters but not the pipeline.
Writing a report from a workflow
Workflow > Export report writes the report of the last run of the active workflow, from every result the run produced. Its dialog has the same fields as above (the title defaults to the name of the workflow) and three more: Workflow embeds the whole workflow with every parameter, Predictions as CSV and Predictions as SD file also write the predictions to the files named under each box. The two prediction options need a Predict node in the workflow; without one the report is written and the dialog says why the predictions were not. Before the first run the dialog says Run the workflow first.
Inside a workflow the Report node writes the same report every time the workflow runs, in the formats its own PDF, Word and Excel parameters name, with its own Paper and a Maximum table rows above which a long table is cut in the PDF and the Word file while the Excel workbook keeps every row. gqsar-cli run --report FILE writes it from the command line with the workflow embedded. A workflow saved by version 1.1.0, whose node was called HTML report, still opens: the old node identifier is read as this node.
What a report contains
Each section appears only when the run produced what it describes.
| Section | Content |
|---|---|
| Executive summary, Warnings of the run | What was modelled, what the model is, and how well it predicts, in the order the figures should be read: the cross-validated and external statistics first, the fit afterwards and labelled as a fit. Then everything the run reported about the data or the model, in one place. |
| Data set | The source and the curation, and the distribution of the activity. When a series has a narrow activity range or dense activity cliffs, a Series guidance row gives the measured values and what our validation found on such series; it is an observation, not a verdict on the model (see The 2D-QSAR wizard). |
| Methods | The descriptors, the data split, the model with every parameter, the validation protocol, the workflow, and the software with its version and its seeds. |
| Model | The equation, the latent variables, the descriptor contributions and, for a fingerprint model, the substructures the fingerprint descriptors stand for. |
| 3D-QSAR model | The field contributions, the statistics of the model, the alignment and the contour maps from several directions with the value of each lobe. |
| Validation | The goodness of fit, internal and external validation, observed against predicted, the residual analysis with the bias, the spread, the two trend tests and the compounds beyond 2.5 standard deviations, the Y-randomisation runs, the applicability domain, and the acceptance criteria: every metric with its literature criterion, its verdict and its reference, per set. |
| Predictions | The test set, and the predictions of the compounds given to the model. |
| Designed library | For a library design: the ranked library, the verdict of every filter, the charts, and the designed compounds in a structure grid with their predictions, their intervals and their domain status. |
| Structure-activity landscape | For a cliff analysis: the counts, SARI with the note on its normalisation, the chirality-cliff counts, Pfeiffer's rule or the statement that it is not testable, and the curation warnings. |
| Pharmacophore hypotheses | The ranked hypotheses with their scores. |
| Figures of the validation, further figures | The charts of the run as vector graphics, each with a caption that says what to look at. Each chart appears once, and when the run holds several models, the title of every figure names the model it belongs to. |
| Tables of the run | Every table the run delivered (pair tables, fit tables, domain tables), rounded for display with a note that the files hold full precision, truncated at the row limit with a note saying so. |
| OECD principles checklist | A verdict and its evidence for each of the five principles, derived from what the run produced, never asserted. |
| QMRF summary | The fields of the QSAR Model Reporting Format, with the fields the run does not determine left blank rather than guessed. |
| Appendices | The long tables, each in an appendix of its own: the per-compound predictions (identifier, observed, predicted, residual, standard error and domain verdict with its reasons; for a classifier the classes, the class the statistics describe and one probability per class), the complete metric table, the model coefficients, the tables of the run, and the workflow parameters node by node with every parameter that differs from its default. |
| Mechanistic interpretation | The text you gave, or the statement that none was established. |
A run that has a text output, such as the summary of a chirality-cliff analysis with its warnings and the Pfeiffer regression, can write it as plain text with a Write text node.
Tables as CSV
Besides Tables as CSV in the report dialog, tables reach a file in three ways:
- A Write CSV node writes any table, dataset, prediction table or cliff analysis of a workflow. Its Delimiter is Comma by default (Semicolon, Tab, Pipe or Detect automatically).
- Save CV predictions on a model or classifier dashboard writes the cross-validated prediction of every training compound: the compound, its observed value, the prediction by models fitted without it, the residual and how many times it was held out.
- Show in a spreadsheet on a model dashboard opens the predictions as a dataset, which can then be exported like any other.
Prediction tables are written at round-trip precision: every number reads back as the same number. Displays and the report round for themselves.
Exporting datasets
File > Export (Ctrl+E) opens the Export dataset dialog for the active dataset; File > Export as SD file and File > Export as SMILES open it on those formats, and the File menu has one more entry for a CSV prepared for spreadsheet programs.
| Control | Choices |
|---|---|
| Format | CSV; CSV with a UTF-8 byte-order mark, which spreadsheet programs need to read accented and Greek characters correctly; Tab-separated text; SD file; SMILES. |
| Rows | All rows, Selected rows, or Filtered rows, each with its count. |
| Columns | Visible columns, All columns, or Chosen columns ticked one by one. |
| Generate missing 2D coordinates | SD file: lays out structures that have no coordinates, so the file can be depicted. |
| Canonical SMILES | SMILES: writes the canonical form. |
The file formats are described in File formats.
Saving models
| Model | How to save it | What the file holds |
|---|---|---|
2D model bundle (.json) | Save the model bundle on the last page of the 2D-QSAR wizard, a Write model node, or gqsar-cli train. | The fitted model, the names of the descriptors it expects, its response transform, the preprocessing fitted with it (imputation, outlier limits, descriptor filter, scaling) and its applicability domain. Descriptors are matched by name when it predicts. |
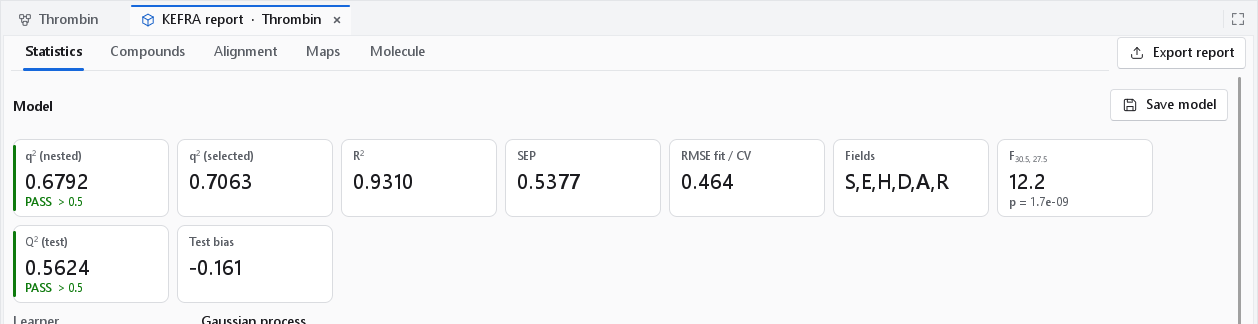
3D-QSAR model (.gqfm) | Save model on the Statistics tab of the 3D-QSAR dashboard, Save the model in the 3D-QSAR wizard, or a Write 3D-QSAR model node. | See below. |
Both kinds are applied to new compounds with Wizards > Predict with a saved model (see Predicting new compounds).
The 3D-QSAR model file
A 3D-QSAR model can predict a new compound only if that compound goes through exactly the arithmetic the training set went through and is placed in the frame the training set was aligned in. The .gqfm file therefore holds much more than the coefficients. The file of an atom-based cube model has these parts:
| Part | Contents | Needed for |
|---|---|---|
| Protocol | The model type and its settings, lattice, column filter, block scaling, PLS and validation settings, seeds. | Evaluating the fields of a new compound the same way. |
| Lattice | The lattice used, the columns that survived the filter, the block scale factors of the training set. | Reading exactly the model's columns from a new compound. |
| PLS state | Weights, loadings, scores, scalers and the number of components chosen. | The prediction and its standard error. |
| Field matrix | Every row in double precision. | Column means for missing values, the applicability domain, contribution maps. It is stored, not recomputed, so the model comes back bit for bit. |
| Statistics | The per-factor table, field contributions, bootstrap, Y-randomization, repeated leave-group-out, and every compound's fitted, cross-validated and test value. | Showing the model as it was reported when it was built. |
| Preparation record | How the training compounds were prepared: 3D generation, conformer search, partial charges. | Preparing the compounds to be predicted the same way. |
| Aligned molecules | Every training compound as aligned, with coordinates, charges and the record of the alignment on the reference molecule. | Placing a later compound in the model's frame, and drawing the maps. |
A KEFRA file holds, in place of the protocol, the lattice, the PLS state and the field matrix, the whole KEFRA model record: its settings, the field weights, widths and regularisation its cross-validation chose, and what it needs to compare a new compound with the training compounds. The preparation record and the aligned molecules are the same.
The file is a binary container in which every part carries its own version and a checksum, and an end mark shows that it was written completely. File > Open on a .gqfm file shows the model's dashboard again without the workflow that built it.
Projects (.gqproj), which keep the datasets and workflows of a session together, are described with Projects and files.