The workflow canvas
Every analysis in GeinQSAR Studio is a workflow of nodes. The canvas is where you see it, change it, run it and keep it.
A workflow is a directed graph: each node does one step (read a file, standardise structures, compute descriptors, fit a model, write a report), and each connection carries a result from an output port of one node to an input port of the next. The wizards build workflows, the templates are workflows, and you can build one from an empty canvas. Because the result of a wizard is a workflow, every parameter it chose can be inspected, changed and run again, and the same file runs unchanged from the command line with gqsar-cli run (see The command line).
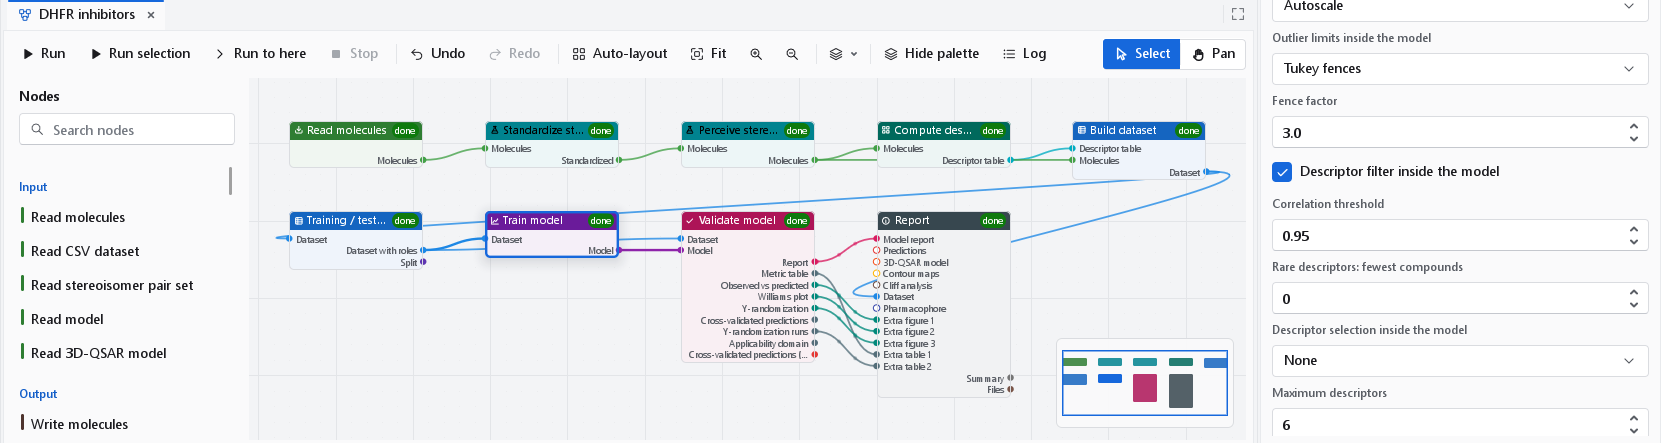
Opening a canvas
| Command | What it opens |
|---|---|
| Workflow > New workflow (Ctrl+Shift+N) | An empty canvas. |
| Workflow > Open workflow | A saved .gqflow file (or a project). |
| Workflow > Template gallery, Workflow > Templates | A shipped workflow; see Workflow templates. |
| Any wizard | The workflow it built, which runs at once. |
The parts of the canvas
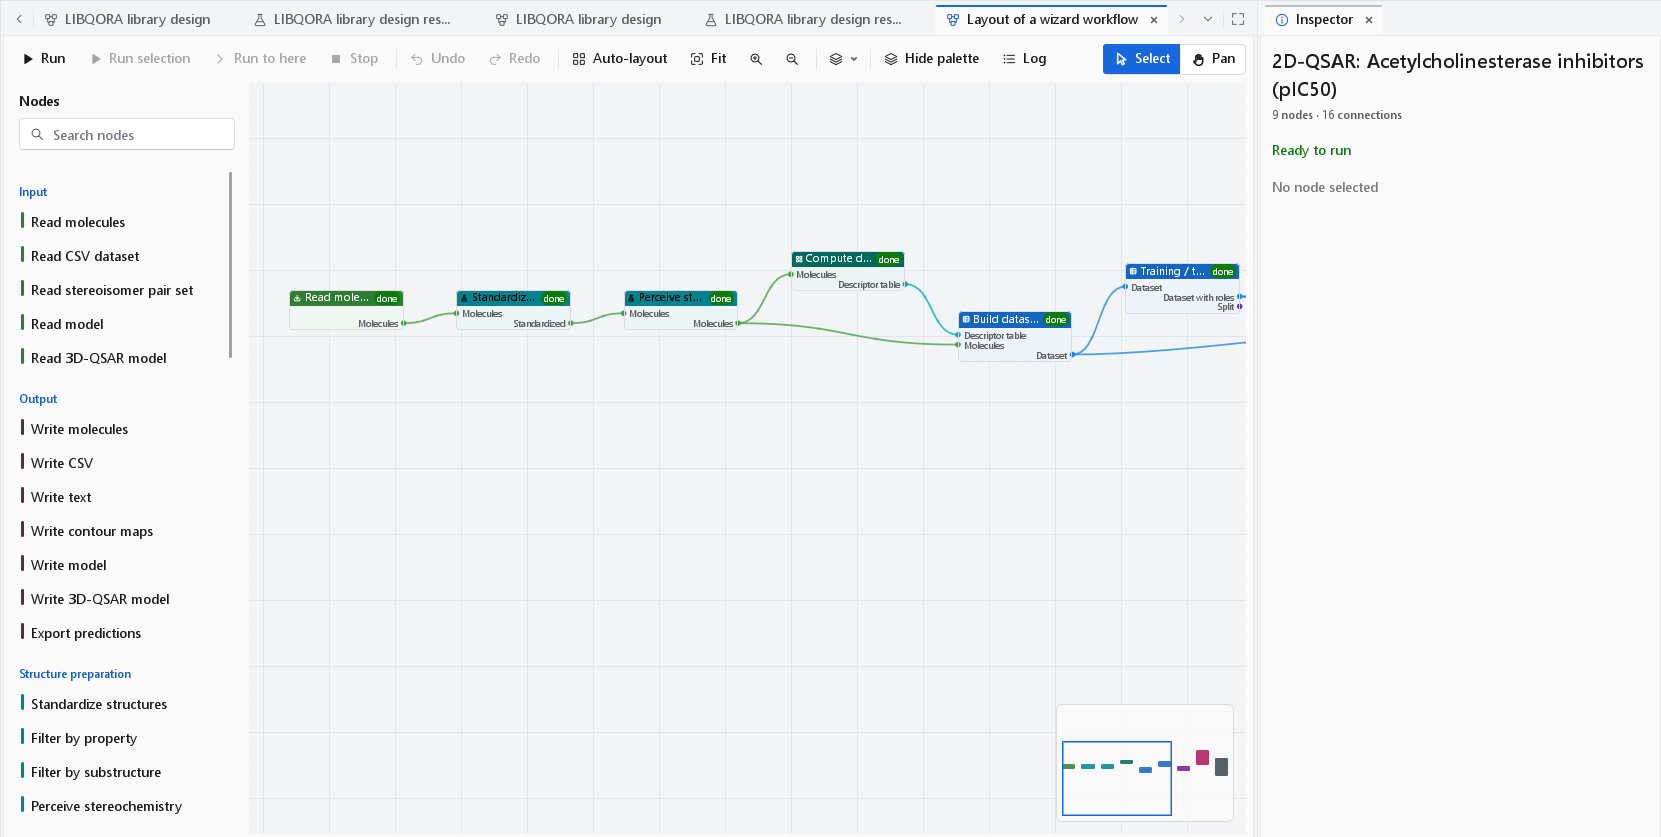
| Part | What it does |
|---|---|
| Toolbar | Run and edit commands, described below. On a narrow window the less used commands lose their labels and then move into an overflow menu; Select and Pan always stay. |
| Node palette | Every node type, grouped by category, with a coloured bar per category. Search nodes filters by name, identifier and description. Click a node to add it in the middle of the view, or drag it to where it should go. On a narrow window the palette gives way to the canvas; Palette or Hide palette shows and hides it. |
| Nodes | A coloured header with the category icon, the name and, after a run, a status badge; input ports on the left, output ports on the right, each coloured by the kind of data it carries. |
| Minimap | The whole graph in miniature with the visible region outlined. Click or drag in it to move the view. |
| Inspector | With nothing selected: the name of the workflow (its description is the tooltip), the numbers of nodes and connections, and Ready to run or Not ready to run with the reasons, such as a required input that is not connected. With a node selected: its parameters and outputs, described below. |
| Status bar | Nodes, connections and zoom, and the first problem that keeps the workflow from running. |
Building and editing a workflow
Connecting nodes
Drag from an output port to an input port. While you drag, the nodes that cannot accept the connection are dimmed. A connection between incompatible kinds of data, or one that would close a cycle, is refused with the reason (Connection refused). An input takes one connection; an output may feed any number of inputs. Dragging away from a connected input detaches its connection so it can be dropped elsewhere; right-clicking a connection offers Remove connection. Clicking a connection selects the two nodes it joins.
Selecting, moving and arranging
| Action | How |
|---|---|
| Select a node | Click it. Ctrl+click adds it to or removes it from the selection. |
| Select several | Drag a rectangle on empty canvas, or Ctrl+A for all. |
| Move | Drag a node or the selection. Every move is one undo step. |
| Copy, cut, paste, duplicate | Ctrl+C, Ctrl+X, Ctrl+V, Ctrl+D. |
| Delete | Delete removes the selected nodes, or a selected group frame or comment. |
| Undo, redo | Ctrl+Z, Ctrl+Y, or the toolbar. |
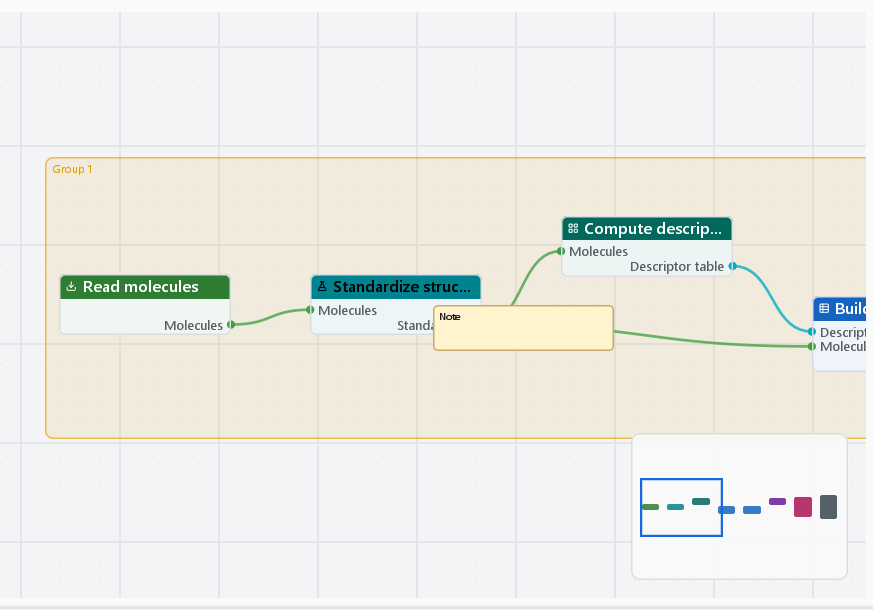
| Arrange | The Arrange menu of the toolbar: Group selection, Add comment, Align left, Align centres, Align right, Align top, Align middles, Align bottom (two or more nodes), Distribute horizontally and Distribute vertically (three or more), Duplicate, Delete. The right-click menu offers the same, with Align and Distribute as submenus. |
| Auto-layout | Places the nodes in layers from the inputs to the outputs with as few crossing connections as possible; the status bar reports the levels and crossings. Wizards and templates open with this layout. |
Navigating
| Action | How |
|---|---|
| Zoom | The mouse wheel or Ctrl+wheel zooms about the pointer, about 12 % per notch; Zoom in and Zoom out on the toolbar zoom about the centre. |
| Fit | Fit on the toolbar, Ctrl+0, or a double click on empty canvas frames the whole graph. Workflow > Zoom 100% returns to natural size. |
| Scroll sideways | Shift+wheel, or a horizontal wheel. |
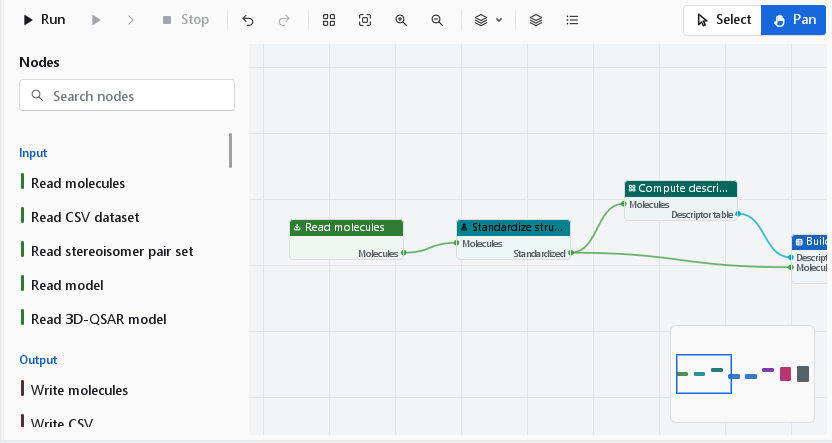
| Pan | Drag with the middle button in either mode; hold Space and drag with the left button; or switch to Pan mode. |
| Mouse mode | Select (V): the left button picks, box-selects and drags nodes. Pan (H): the left button drags the whole diagram, and a click without movement still selects a node. The cursor shows the mode: an open hand in Pan mode. |
Parameters in the inspector
Selecting a node fills the inspector with the node's name (its description and literature reference are the tooltip, and the help mark beside the type repeats them), its type and identifier, and, after a run, its state, run time, error and warnings. Below come:
- Parameters: one editor per parameter, generated from the node's own declaration, with the range and choices it allows and its description as the tooltip of the label. Rarely needed parameters sit under Advanced (the number in brackets is how many). A value outside the declared range is refused with the reason (Parameter refused). A node that fits a model shows a Model parameters panel for the chosen model type instead of a raw text field.
- Outputs: every output port, with a summary of its last result as the tooltip and a Show button that opens its preview.
Changing a parameter marks the node and everything downstream of it as out of date: their badges disappear, and the next run recomputes them.
Running
| Command | What runs |
|---|---|
| Run (F9, Workflow > Run workflow) | The whole workflow. |
| Run selection | The selected nodes and whatever they need upstream. |
| Run to here | The selected node and its ancestors only, which is how to look at an intermediate result without running the expensive end of a workflow. |
| Stop | Cancels the run; nodes that had not started are not run. |
A run is a background job: the window stays responsive and the job appears in the Jobs panel. The workflow is checked before anything is computed, so a missing connection or an invalid parameter is reported at once (Workflow cannot run). Each node starts as soon as the nodes it depends on have finished, so independent branches run at the same time. One workflow runs at a time; stop it before starting another.
| Badge | Meaning |
|---|---|
| queued | Planned for this run, waiting for its inputs. |
| running | Computing now. |
| done | Computed in this run. |
| cached | Its inputs and parameters are unchanged, so the earlier result was reused. |
| failed | The node failed; its error is in the inspector and the log. A failed node is not cached and is retried next run. |
| skipped | Not run because a node it depends on failed. Independent branches still finish. |
| stopped | The run was cancelled. |
When the run ends, a notification gives the number of nodes executed and cached and the time taken, or the first error. A wizard then opens its dashboards; for any other workflow, Workflow > Open results dashboards opens the dashboards of every result node of the last run (model validation, classifier report, automatic model search, 3D-QSAR model, cliff analysis, pharmacophore).
Caching
Every node result is stored under a key made from the node type and version, its parameters, its seed and the keys of its inputs. A reader also folds in the identity of the file it reads (size and time of last change, or a hash of the content when its content-hash parameter is set). When you change one node and run again, exactly that node and the nodes downstream of it are recomputed; everything upstream is served from the cache, and setting a parameter back to an earlier value finds the earlier result again. Rewriting an input file re-runs its reader and the nodes below it. The cache lives in memory for the session, so a restarted program computes everything once.
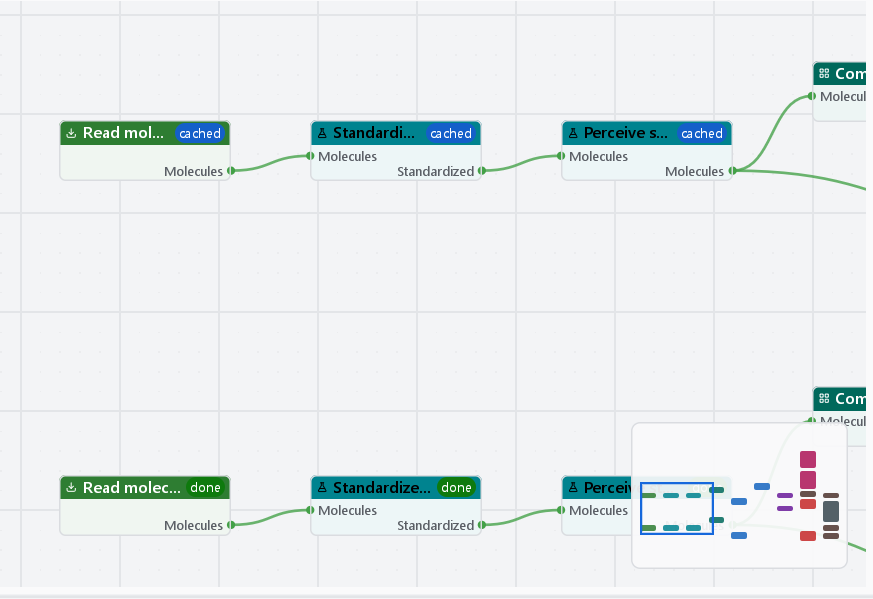
Results are deterministic: the same workflow with the same seeds gives the same numbers whether nodes run in parallel or one after another, and the seed of each node depends on its identifier, not on the order in which nodes happen to run.
Previews and the log
Clicking an output port, double-clicking a node or pressing Show in the inspector opens the preview card in the top-right corner of the canvas. A table shows its first eight rows and four columns with its full size underneath; a chart is drawn as a live thumbnail of the same chart the report will contain; other results show their summary fields. Before a run the card says No result yet: run the workflow. The card needs a canvas of at least 380 by 260 points.
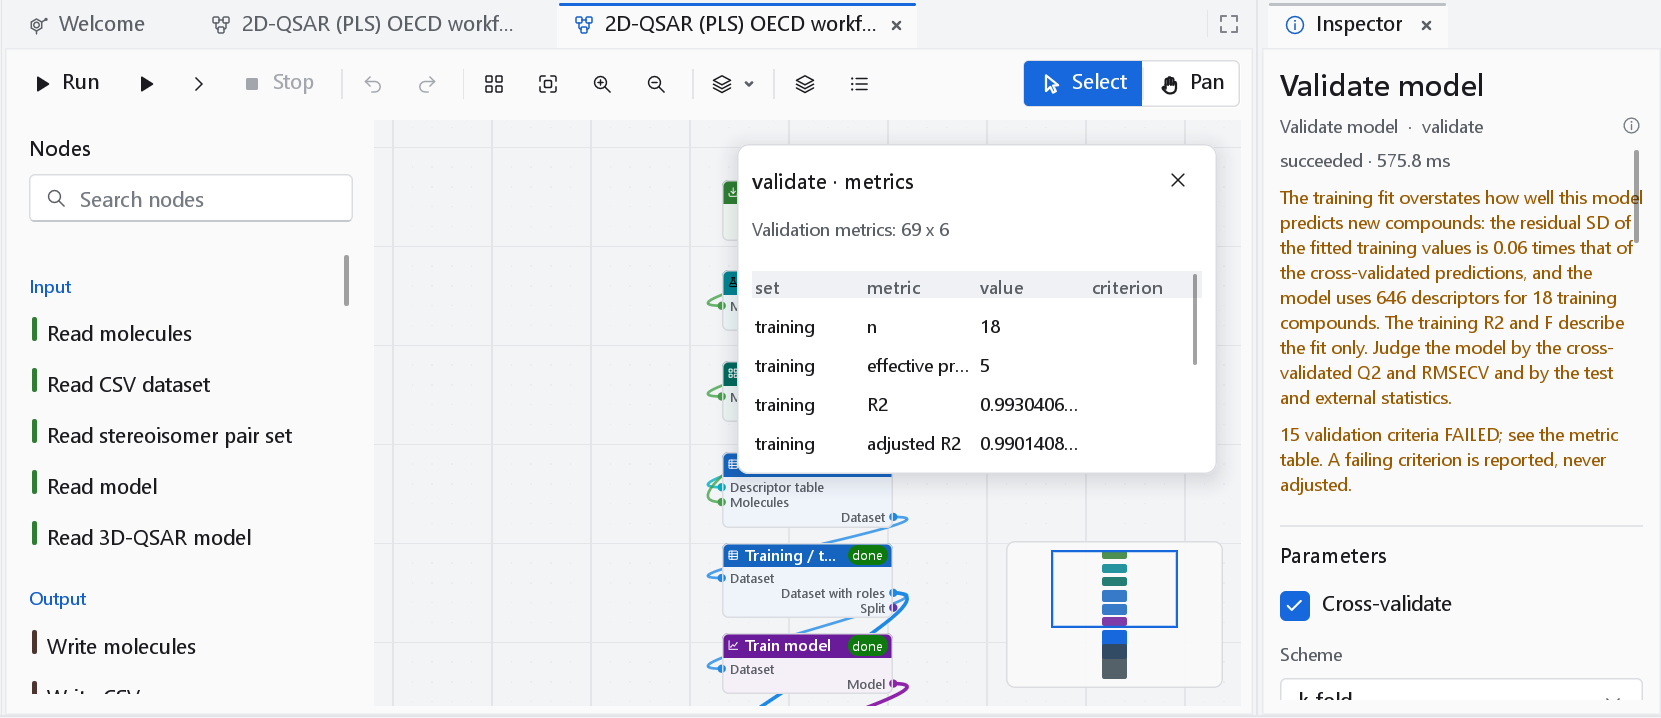
Log on the toolbar opens a strip under the canvas. With a node selected it shows that node's state and time, its error, its warnings and every line it logged; with none selected, the summary of the last run.
Saving workflows
Workflow > Save workflow (Ctrl+S) writes the canvas to a .gqflow file: a JSON document with the name and description of the workflow, every node with its type, parameters and position, every connection, and the group frames and comments. Results are not stored; they follow from the workflow and its seeds. A parameter name the program does not know is an error when the file is read, never silently dropped, because the computation would then differ from the one described. Once a workflow has been saved, its relative file paths are read and written relative to the folder of the .gqflow file.
File > Save project keeps every open workflow together with the datasets in one .gqproj file and re-runs the workflows that had results when the project is opened; see Projects and files.
The Jobs panel
Every long calculation, workflow runs included, is a job. Jobs at the bottom of the window (or Workflow > Show the job queue) opens the panel: newest job first, each with its title, the elapsed time, a progress bar and a cancel button while it runs, and its final state and message once it has finished. The header counts the running and failed jobs. Show finished toggles the finished jobs and Clear removes them. Workflow > Cancel all jobs stops everything. A failed job opens the panel by itself.
Node types
The node types, in the order of the palette. The parameters of each are in its inspector and in the output of gqsar-cli nodes --verbose.
| Category | Node | Identifier | What it does |
|---|---|---|---|
| Input | Read molecules | read_molecules | Structures from SD, MOL, MOL2, SMILES, CSV or TSV with SMILES, PDB or XYZ; data fields and columns become properties. |
| Read CSV dataset | read_csv_dataset | A table as a dataset: every column that is not an identifier, SMILES, role or response is a descriptor. | |
| Read stereoisomer pair set | read_cliff_dataset | A pair table, one stereoisomer pair per row. | |
| Read model | read_model | A 2D model bundle saved by Write model. | |
| Read 3D-QSAR model | read_field_model | A 3D-QSAR model file; stands in for the model node. | |
| Output | Write molecules | write_molecules | A molecule set as SD, MOL2, SMILES, CSV, PDB or XYZ, with its properties. |
| Write CSV | write_csv | Any table, dataset, prediction table or cliff analysis as delimited text. | |
| Write text | write_text | A text output (a report, a summary, an SVG figure) to a file. | |
| Write model | write_model | A 2D model bundle as a JSON file. | |
| Write 3D-QSAR model | write_field_model | A 3D-QSAR model as a .gqfm file. | |
| Export predictions | export_predictions | Predictions as CSV and, with structures, as an SD file. | |
| Structure preparation | Standardize structures | standardize | Validation, metal disconnection, group normalisation, salt stripping, largest fragment, neutralisation, optionally the canonical tautomer. |
| Filter by property | filter_property | Keeps molecules whose property lies in an interval. | |
| Filter by substructure | filter_smarts | Keeps or removes molecules matching a SMARTS pattern. | |
| Perceive stereochemistry | perceive_stereo | Finds stereogenic units and counts the specified and unspecified ones. | |
| Enumerate stereoisomers | enumerate_stereoisomers | Expands every molecule into its distinct stereoisomers. | |
| Generate 2D coordinates | coords_2d | Structure diagrams for depiction and report figures. | |
| Generate 3D structure | generate_3d | One 3D conformer per molecule by distance geometry and force-field refinement. | |
| Generate conformers | conformers | A conformer ensemble within an energy window. | |
| Assign partial charges | charges | Gasteiger-Marsili, formal, or charges read from a property. | |
| Descriptors | Compute descriptors | descriptors | A descriptor table from a preset, families, identifiers or everything; fingerprints are families too. |
| Transform activity | activity_transform | A property to the log scale, for example IC50 in nM to pIC50. | |
| Transform response | transform_response | The same transform on the response of a dataset. | |
| Data handling | Build dataset | build_dataset | Joins descriptors and molecules into a dataset and audits the response. |
| Preprocess descriptors | preprocess | Imputation, removal of uninformative columns and scaling, fitted on the training rows. | |
| Training / test split | split | Assigns the Training and Test roles by a design method or from a property. | |
| Select descriptors | feature_selection | A descriptor subset chosen on the training rows only. | |
| Modelling | Train model | train_model | A regression model bundled with its descriptors and applicability domain. |
| Train classifier | train_classifier | The same for a categorical response. | |
| Automatic model search | auto_model_search | Searches model families and descriptor subsets over several splits and ranks them. | |
| Validation | Validate model | validate_model | The full OECD validation of a regression model: cross-validation, Y-randomization, external statistics, applicability domain. |
| Validate classifier | classify_report | Stratified cross-validation, confusion matrix, MCC, ROC, permutation test. | |
| Prediction | Predict | predict | Applies a model bundle; descriptors are matched by name. |
| 3D-QSAR prediction | field_predict | Applies a 3D-QSAR model to compounds in its frame. | |
| 3D-QSAR | Align in 3D | align_3d | Places every molecule in a common frame (as supplied, common core, template). |
| KEFRA model | field_kernel | Lattice-free kernel 3D-QSAR with a prediction uncertainty and an applicability domain. | |
| 3D-QSAR model | field_qsar | Atom-based cubes: atom-class occupancy on a lattice, and PLS. | |
| Contour maps | contour_maps | The maps of a 3D-QSAR model. | |
| Pharmacophore hypotheses | pharmacophore | Common feature arrangements of the actives, ranked. | |
| Pharmacophore features | pharm_features | The features of every molecule, one per row. | |
| Expand conformers | expand_conformers | One record per conformer of an ensemble. | |
| Analysis | Principal component analysis | pca | Scores, eigenvalues and explained variance. |
| Cluster compounds | cluster | k-means++ or hierarchical clustering with a representative per cluster. | |
| Diversity selection | diversity_select | A maximally diverse subset by the max-min rule. | |
| Similarity search | similarity_search | Ranks a library by fingerprint similarity to a query. | |
| Activity cliff analysis | activity_cliffs | SALI, SAS map and SARI. | |
| Chirality cliff analysis | chirality_cliffs | Stereoisomer pairs, eudismic analysis, descriptor blindness. | |
| Report | Report | report | The report of the run as PDF, Word and Excel, with the OECD checklist. |
| Render figure | render_plot | A chart output as a standalone SVG. |