Introduction
A Windows program for quantitative structure-activity relationships: from a table of structures and measured activities, or a query to ChEMBL or PubChem, to validated 2D and 3D models and the figures that report them.
GeinQSAR Studio takes a QSAR study through every step in one program. It reads a set of compounds with their activities, or builds such a set from ChEMBL or PubChem with a recorded curation, shows the compounds as a spreadsheet of structures, computes descriptors, designs the training and test sets, fits and validates 2D and 3D models, and exports the results as figures and reports of publication quality. The chemistry, the statistics, the 3D graphics and the interface are all part of the program; nothing else has to be installed.
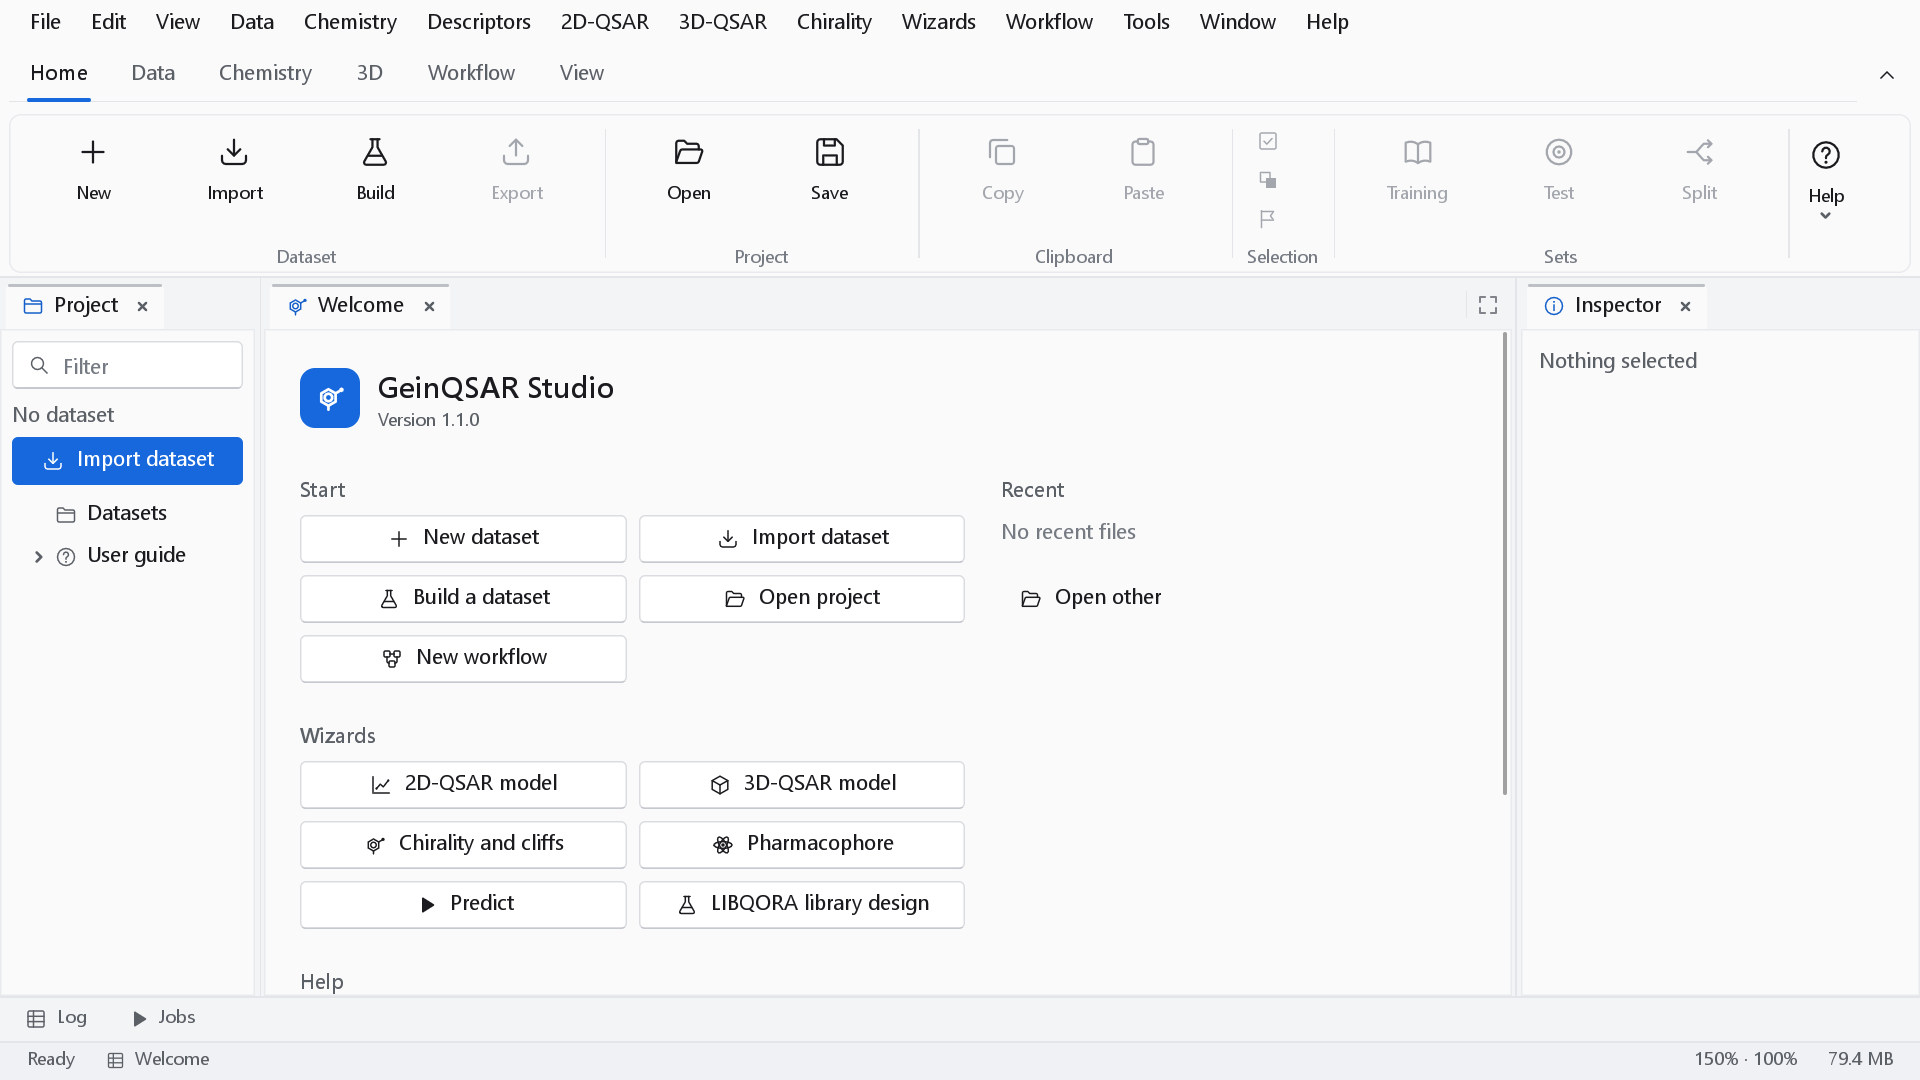
What the program does
| Area | What you get |
|---|---|
| Data | Import of SD, MOL, MOL2, PDB and XYZ files, SMILES lists and CSV or tab-separated tables, with a column mapping you confirm before anything is read. A spreadsheet that draws every structure, filters by substructure and similarity, and holds formula columns. Standardisation, duplicate search, conversion of concentrations to a p-scale and six methods of training/test splitting. |
| Dataset Builder | A dataset prepared from a ChEMBL target or publication, a PubChem assay or your own file, curated in recorded steps that show what each step removed. A provenance file regenerates the dataset and compares it with the original. |
| Descriptors | Physicochemical properties (Crippen logP, TPSA, hydrogen bonds, drug-likeness rules, QED, rings), a full 2D descriptor set, fingerprints, chirality-aware descriptors, and 3D families for compounds with conformers. |
| 2D-QSAR | Regression and classification models built by a wizard that covers curation, descriptors, preprocessing, the split, descriptor selection, the model and its validation; dashboards with the statistics, the plots, the applicability domain and response randomisation; prediction of new compounds with a saved model. |
| 3D-QSAR | Conformers, alignment and two models: KEFRA, a lattice-free kernel method with a prediction uncertainty and an applicability domain, and atom-based cubes with PLS, with contour maps and atom cubes in an interactive 3D view. |
| Pharmacophores | A common pharmacophore search over the actives of a series, with the hypotheses ranked and shown in 3D. |
| Library design | LIBQORA builds the molecules a scaffold and a set of substituents imply, or single-point analogues of a hit, filters out what you do not want, predicts each one with your own models with a calibrated prediction interval and an applicability domain, and ranks them by objectives you name. |
| Chirality and activity cliffs | Stereoisomer pairs, activity cliffs measured by SALI, eudismic analysis, and a diagnosis of descriptors that cannot tell stereoisomers apart. |
| Workflows | Every wizard builds a workflow of nodes that you can open, change and run again. Ready-made templates start a complete analysis on your own data. |
| Figures and reports | Charts and 3D views exported as SVG or PNG at a stated size and resolution, and an report of a finished workflow, as PDF, Word and Excel, structured along the OECD principles. |
What the results look like
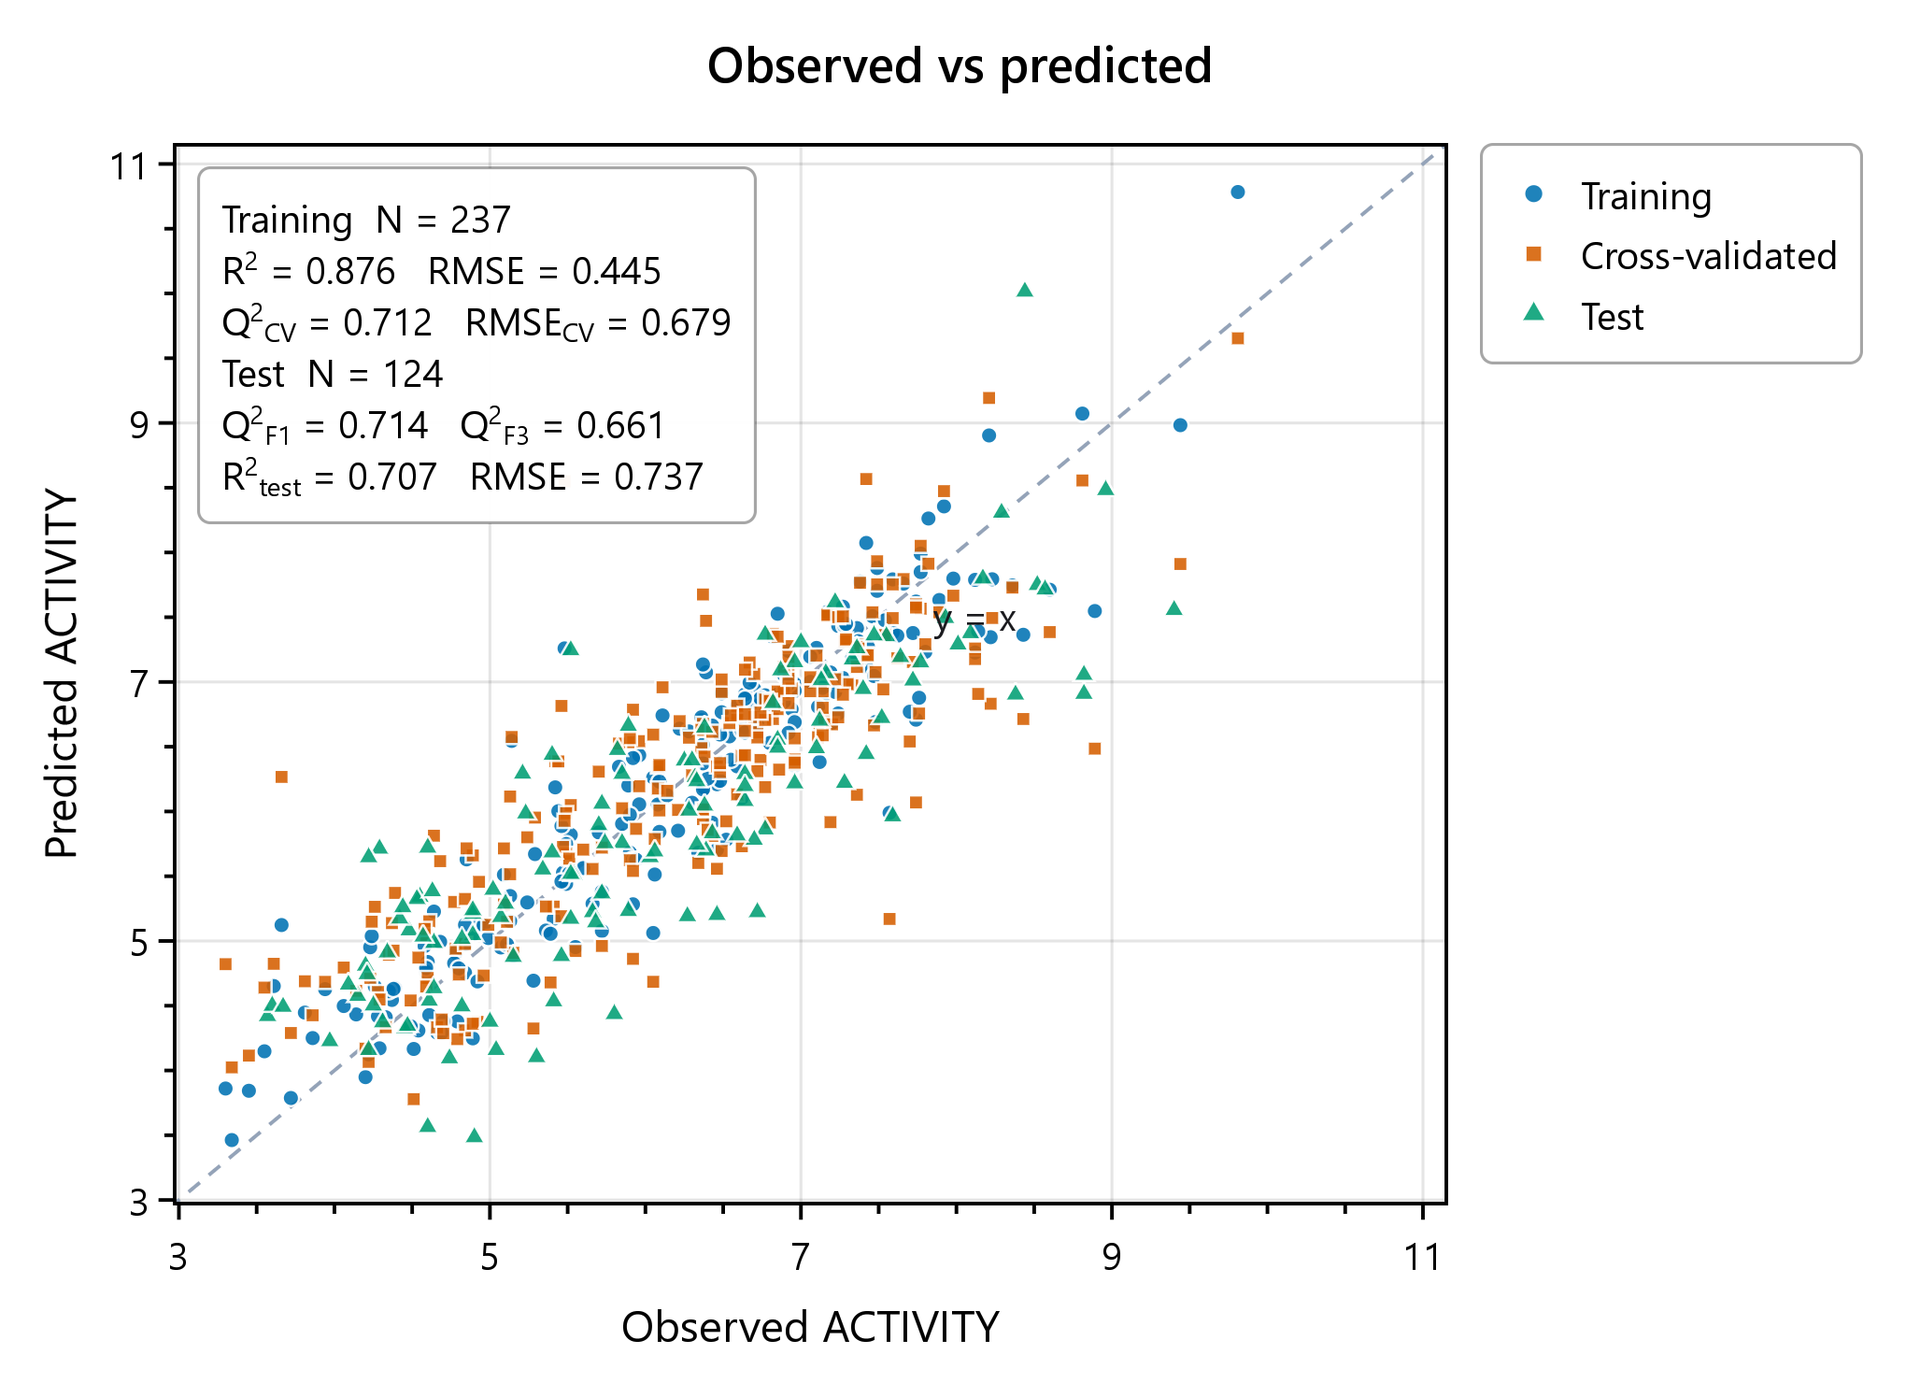
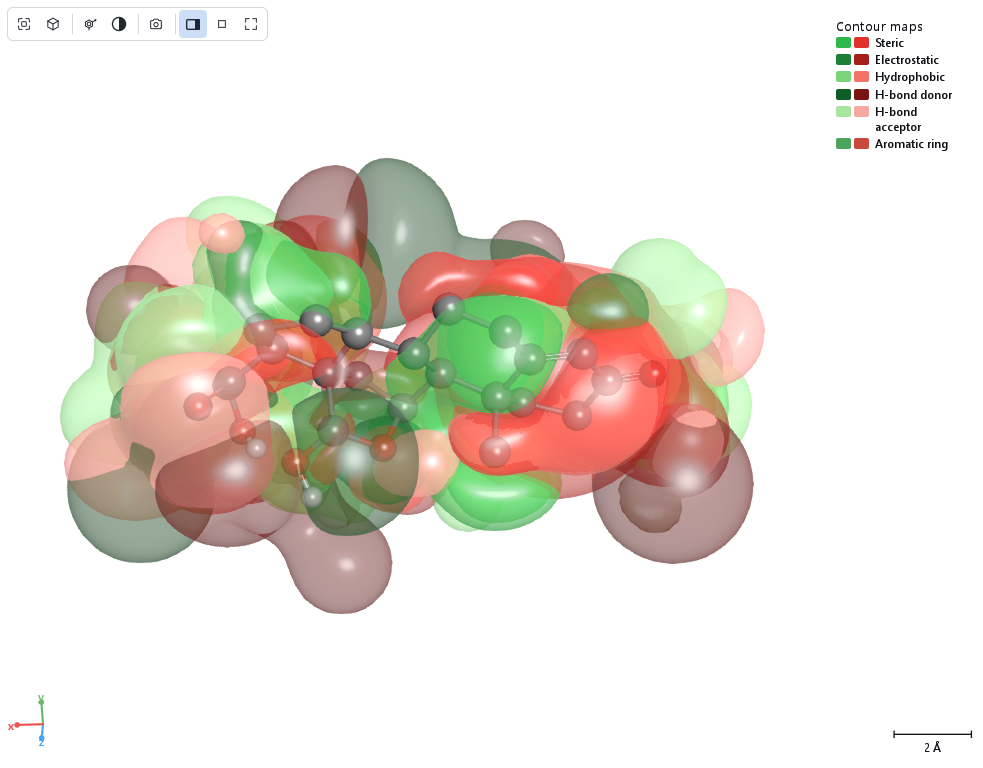
The two pictures below come straight from the program. On the left is a 2D-QSAR model of dihydrofolate reductase inhibitors, on the right a 3D-QSAR model of the corticosteroid-binding globulin steroids that ship with the program as a sample.
How accurately the engines reproduce established reference implementations and published results, and under which conditions, is set out in Accuracy and validation.
Where to start
Two programs, one engine
The package holds two programs. GeinQSAR.exe is the desktop application described in this manual. gqsar-cli.exe is the command-line program: it runs a saved workflow without a window, computes descriptors, trains and applies models, converts structure files, builds a dataset from ChEMBL or PubChem, designs a library, and lists the node types and templates. Both use the same engine and read the same files, so a workflow designed in the window and saved as a .gqflow file gives the same result when it is run from a script, for example
gqsar-cli run --flow my-model.gqflow --report report.pdfand a project saved by one machine opens on another with its workflows and dashboards. See The command line for every command.