A tour of the window
The regions of the main window, what each one is for, and the shortcuts that move between them.
The window follows the order of the work. Datasets and the user guide are listed on the left, the document you work on fills the centre, the Inspector on the right describes whatever is selected in it, and the menus and the ribbon at the top hold every command. Long calculations run in the background; their progress and messages are one click away at the bottom.
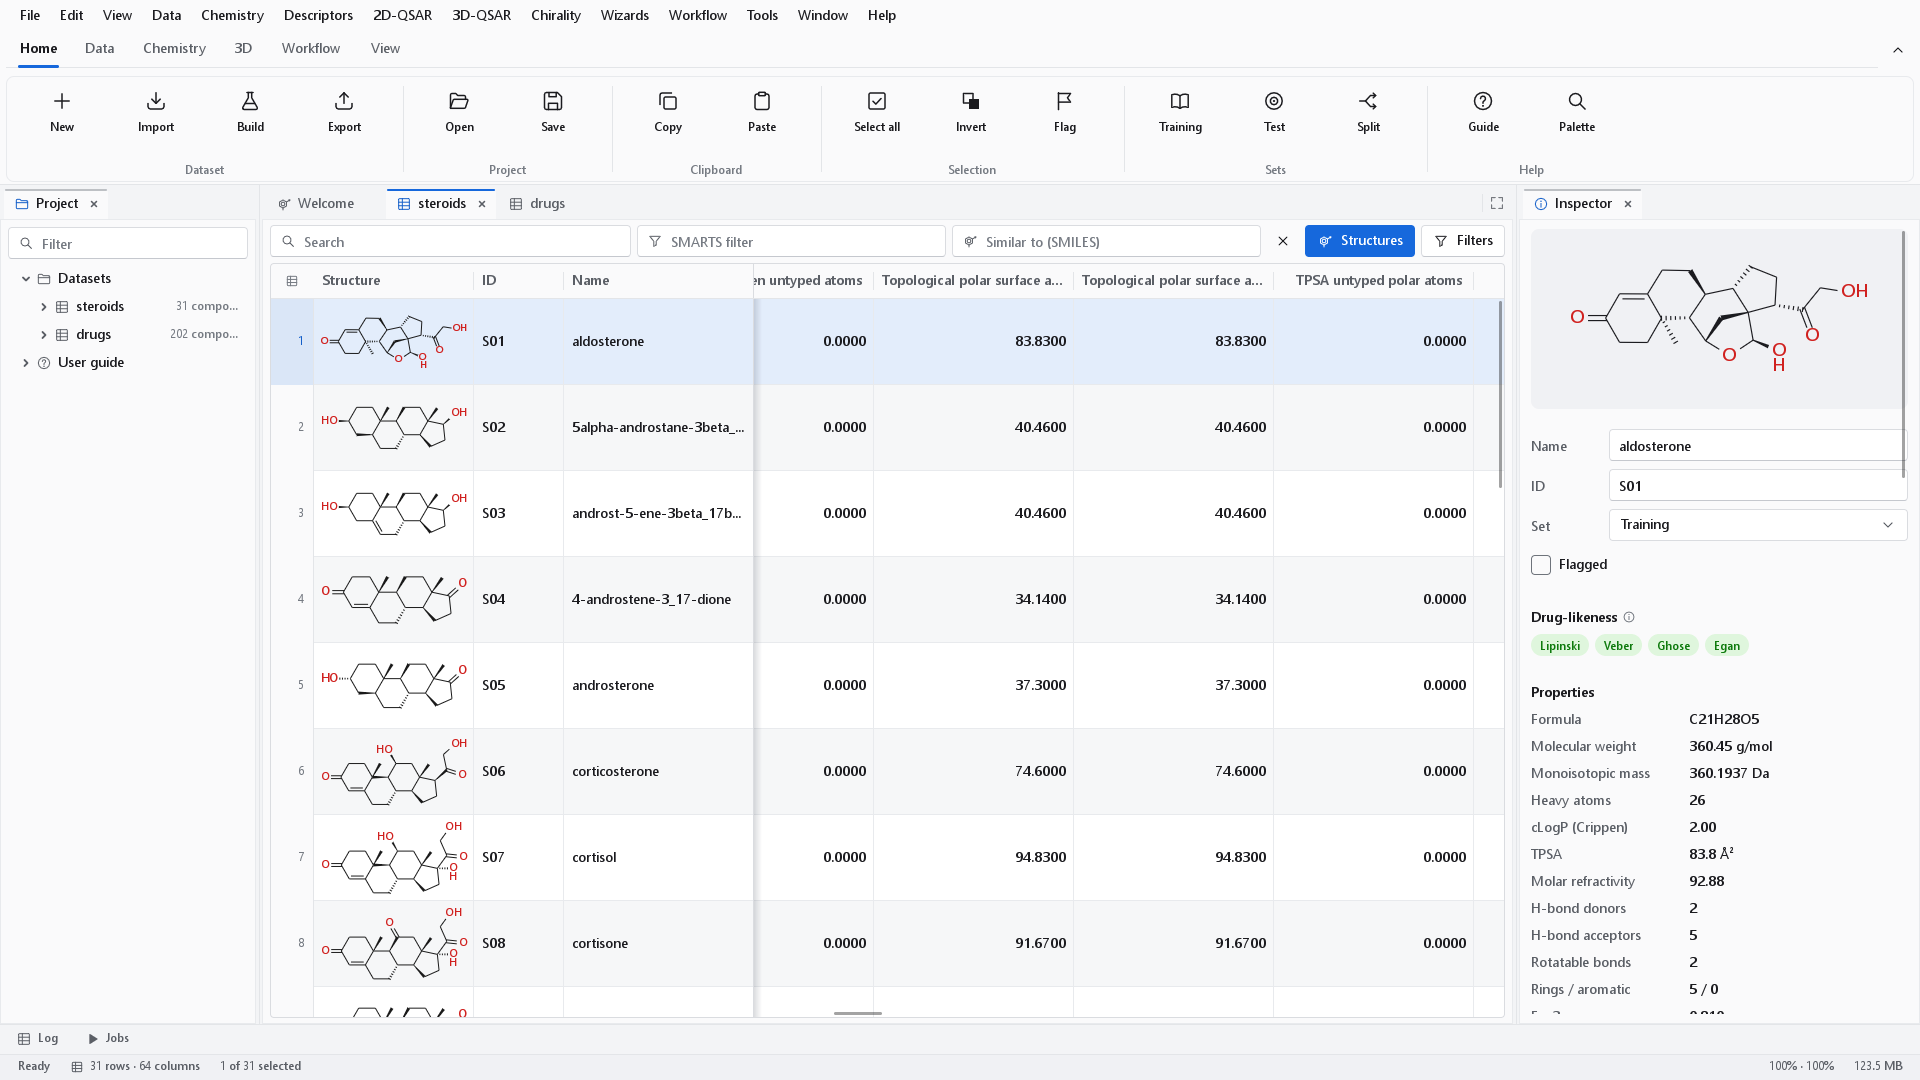
The regions
| Region | What it is for | Show or hide |
|---|---|---|
| Menu bar | Every command the program has, grouped by subject. A command that cannot run yet, such as Export without a dataset, is shown greyed rather than hidden. | Always shown, except in focus mode. |
| Ribbon | The commands used most, in six tabs. Its buttons carry short labels; the menus carry the full wording. | Ctrl+F1 reduces it to its tab row. |
| Project panel | Every open dataset with its views, column groups and sets, and the pages of the user guide. | Ctrl+B |
| Documents | The tabs in the centre: the welcome page, spreadsheets, 3D workspaces, workflows, dashboards and guide pages. | Ctrl+W closes the active one. |
| Inspector panel | The selected compound, a summary of a multiple selection, or the statistics of the column you clicked last. On a workflow it edits the selected node; on a dashboard it summarises the model. | Ctrl+Shift+B |
| Log and Jobs | Session messages, and the queue of background calculations. | Ctrl+J for the Log; the two buttons above the status bar. |
| Status bar | What the program last did, the size of the active dataset, the selection, running jobs, errors, memory and the display scale. | Always shown, except in focus mode. |
The menu bar
Fourteen menus hold every command. Menus and shortcuts lists each entry; in outline:
| Menu | Holds |
|---|---|
| File | New dataset, Open, Import dataset, Build a dataset, Replay a provenance file, Recent files, Save project, the export commands, Close document, Exit. |
| Edit | Copy, Copy with headers, Paste SMILES, the selection commands, Find, Delete rows. |
| View | The four panels, the welcome page, structures and the filter row of the spreadsheet, zoom, theme, focus mode, full screen, the ribbon, the command palette, Reset layout. |
| Data | Formula columns, the column manager, set assignment, the training/test split, duplicates, activity conversion, column statistics, the Dataset Builder. |
| Chemistry | Edit structure, Draw a new compound, Standardize structures, Clear structure filters, Open 3D workspace. |
| Descriptors | Physicochemical properties, 2D descriptor set, Choose descriptors. |
| 2D-QSAR | The 2D-QSAR model builder, Check dataset readiness, the split, Export the model matrix. |
| 3D-QSAR | The 3D-QSAR builder, the 3D workspace, conformers for the selection, molecular surfaces. |
| Chirality | The chirality and activity-cliff wizard, chirality descriptors, a stereochemistry summary. |
| Wizards | The six guided wizards in one place. |
| Workflow | New, open and save workflows, the template gallery, run and stop, layout, dashboards, the report, the job queue. |
| Tools | Settings (Ctrl+,), the data folder, the log folder. |
| Window | Window full screen, Close document, and a list of every open document. |
| Help | User guide, Keyboard shortcuts, About. |
The ribbon

| Tab | Groups and buttons |
|---|---|
| Home | Dataset: New, Import, Build, Export. Project: Open, Save. Clipboard: Copy, Paste. Selection: Select all, Invert, Flag. Sets: Training, Test, Split. Help: Guide, Palette. |
| Data | Columns: Formula, Columns, Recompute, Auto-fit, Statistics. Curate: Duplicates, p-scale, Standardize. Descriptors: Properties, 2D set, Choose. Modelling: Readiness, Split, Matrix. |
| Chemistry | Structures: Draw, Edit. Search: Find, Clear. Stereochemistry: Descriptors, Summary. |
| 3D | Workspace: Workspace, Conformers. Display: Surface. |
| Workflow | Wizards: 2D-QSAR, 3D-QSAR, Cliffs, Pharmacophore, Predict. Workflow: New, Templates, Open, Save, Report. Run: Run, Selection, Stop, Dashboards. Arrange: Layout, Fit, Group. Mouse: Select, Pan. Edit: Undo, Redo, Delete. |
| View | Panels: Project, Inspector, Log, Jobs. Appearance: Theme, Zoom in, Zoom out, Settings. Layout: Focus, 3D full screen, Reset. |
When the window is narrower, the groups of lower priority shrink first: their buttons lose their labels and stack as small icons (Selection in the first picture of this page), and the Help group folds into a single drop-down. Nothing disappears; every command stays in the menus.
The Project panel
The panel lists the open datasets under Datasets, each with its compound count. A dataset expands into:
- Views: the Spreadsheet and the 3D workspace of that dataset; a click opens or activates the view.
- Columns: the columns grouped by family (Identity, Activity, Imported, each descriptor family, Formula, Search). A click on a column scrolls the spreadsheet to it and, if it was hidden, shows it. Very large families list their first 64 columns.
- Sets: Training, Test and, when present, External, Excluded and Unassigned, with their counts. A click selects those rows.
User guide lists the pages of the built-in guide. The Filter box at the top narrows the tree to the datasets, columns and pages whose names contain what you type. Right-click a dataset for Open spreadsheet, Open 3D workspace, Columns, Export and Close dataset; right-click a column for Go to column, Statistics and Show in spreadsheet. With no dataset open the panel offers an Import dataset button.
Documents and tabs
Every document opens as a tab in the centre. When there are more tabs than fit, the strip scrolls rather than shortening the names: use the arrows at either end or the mouse wheel over the tabs, and the button with the down arrow lists every open document. Window > Documents gives the same list. The button at the right end of the tab strip switches to focus mode.
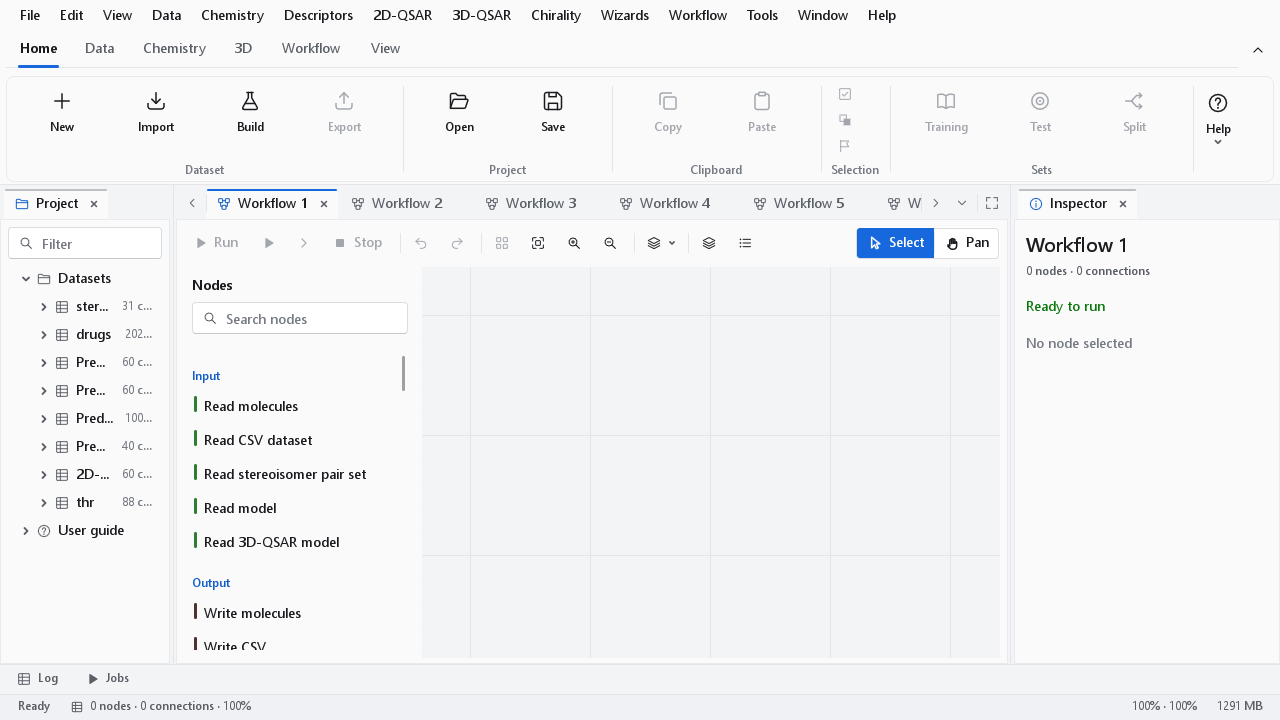
The title bar names the active document. Closing a document never closes its dataset: the dataset stays in the Project panel until you choose Close dataset there.
The Inspector
The Inspector follows the active document. In a spreadsheet it shows one of three things.
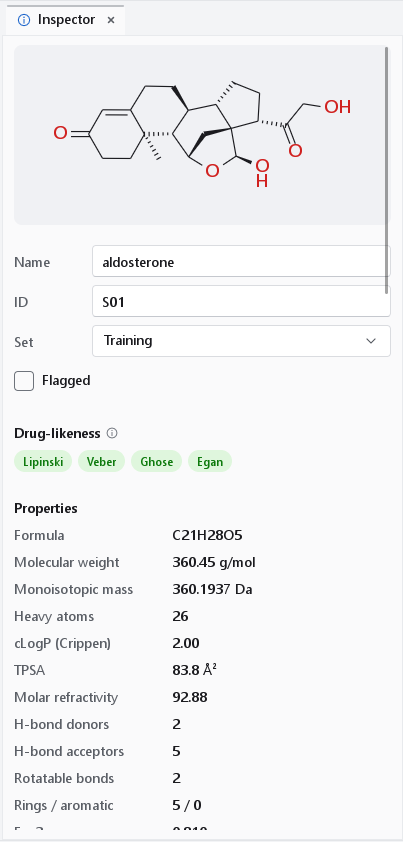
- One compound. The structure, which you can zoom; its name, ID and set, which you can change here; the flag; the drug-likeness badges (green when the rule is met, otherwise the number of violated criteria, plus an Alerts badge for structural alerts); twelve properties with Show all for the rest; and the values of the dataset's own columns for this compound.
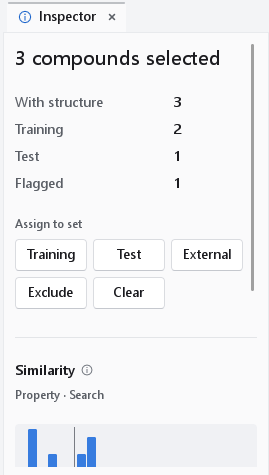
- Several compounds. How many have a structure and how many are in each set or flagged, with buttons that assign all of them to Training, Test, External or Exclude, or Clear their set.
- No row selected. The dataset name with its compound and activity counts.
Under any of these, the column you clicked last is described: its role, family and unit, a histogram with the median marked, the count of values and of missing ones, minimum, quartiles, maximum, mean and standard deviation, the mean of the selection, and a Statistics button that opens the full statistics dialog. A formula column that cannot be evaluated shows the reason here in red.
Log and Jobs
Anything that takes more than a moment (an import, descriptors, a split by distance, a duplicate search, a workflow run) runs as a background job, so the window stays responsive and you can go on working. The two buttons on the bar above the status line open the panels as a flyout; a second click closes them.
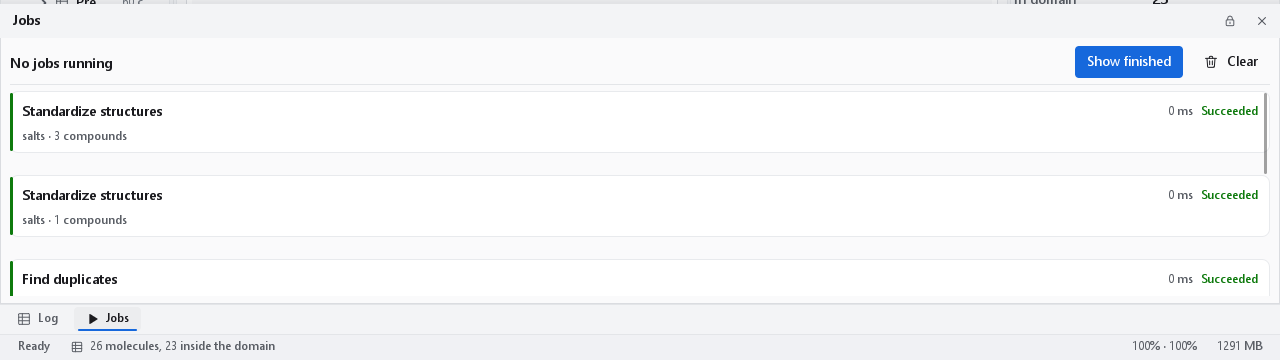
| Panel | Controls |
|---|---|
| Jobs | Running jobs with a progress bar and a cancel button each. Show finished keeps the jobs that have ended in the list, Clear removes them. A job that fails opens the panel by itself. Workflow > Cancel all jobs stops every running job. |
| Log | The messages of the session: what was imported, what was skipped and why, warnings from the chemistry. A drop-down sets the least severe level shown (All, Debug, Info, Warnings, Errors); Find searches the lines; Follow keeps the newest line in view; two buttons copy the shown lines or clear the log. |
The status bar
| Item | Meaning |
|---|---|
| Message | What the program last did ("Ready" when nothing has happened), for example "26 compounds match [OX2H]" after a substructure filter. |
| Document | The size of the active document: for a spreadsheet the rows, how many the filter shows, and the columns. |
| Selection | "6 of 31 selected", only when rows of the active dataset are selected. |
| Jobs | The running jobs with their progress. A click opens the Jobs panel. |
| Errors | The number of errors in the log. A click opens the Log. |
| Memory | The memory the program uses, in MB. It turns amber above the warning threshold of Tools > Settings > Performance. |
| Scale | The monitor scaling and the interface zoom, for example "100% · 125%". A click opens the Appearance page of the settings. |
The command palette
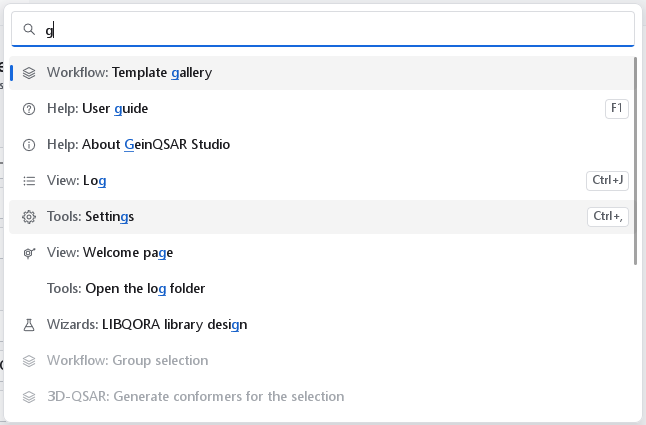
Ctrl+Shift+P, or Palette on the Home tab, opens a search box over every command. Type part of a name; the matching commands appear with their menu, their shortcut and the matched letters highlighted, and Enter runs the one in front. Commands that cannot run at the moment are listed greyed, so the palette also tells you that a command exists. It is the quickest way to a command whose menu you do not remember.
Keyboard shortcuts
Help > Keyboard shortcuts lists every command with its binding, searchable, and reports conflicting bindings. The ones used daily:
| Shortcut | Command |
|---|---|
| Ctrl+N, Ctrl+O, Ctrl+I | New dataset, Open, Import dataset |
| Ctrl+E, Ctrl+Shift+S | Export, Save project |
| Ctrl+W | Close the active document |
| Ctrl+F | Find in the spreadsheet |
| Ctrl+A, Ctrl+Shift+A, Ctrl+D | Select all, invert, clear the selection |
| F5 | Recompute formula columns |
| Ctrl+3 | Open the 3D workspace |
| F9 | Run the workflow |
| F11, Ctrl+F11, Shift+F11 | Focus mode, 3D view full screen, window full screen |
| Ctrl+, | Settings |
| F1 | User guide |