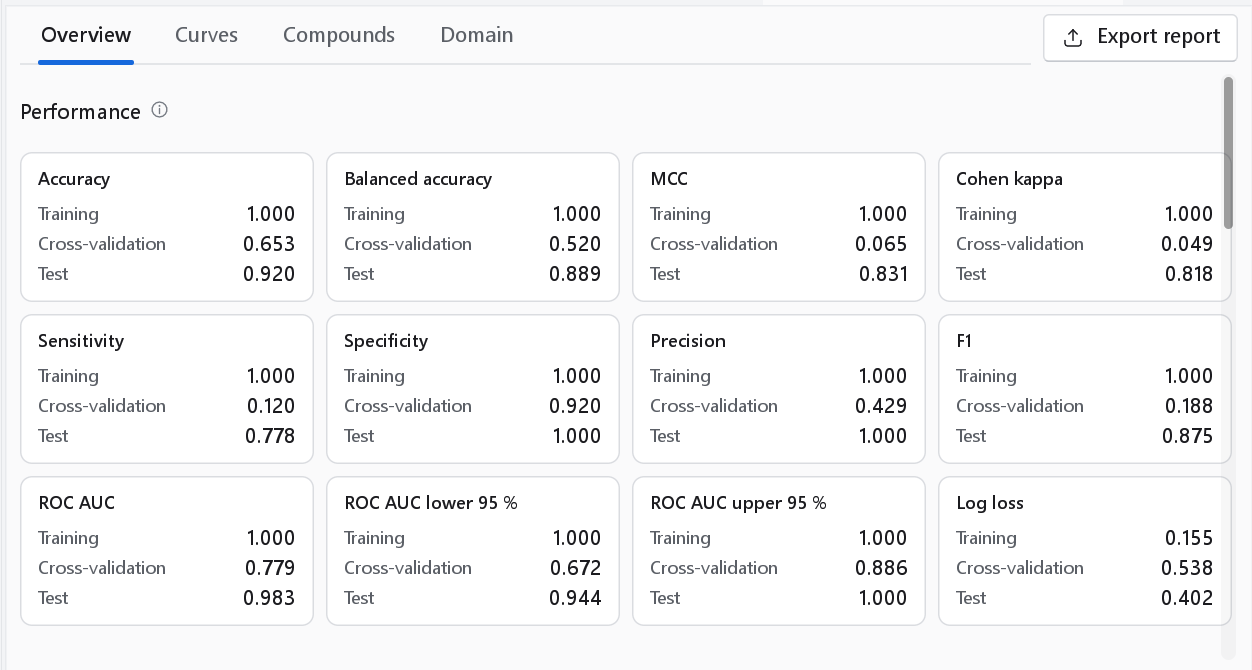
The classifier dashboard
The report of a classification model: the statistics of every set, the label-permutation test, the ROC curve and confusion matrix, every compound and the applicability domain.
The classifier dashboard opens after a classification workflow. Like the model dashboard it computes nothing of its own: the cards, the tables and the figures are read from the metric table and the outputs of the validation node, so they agree with the exported report and the files of the run. The class labels are those of the class column, or active and inactive when the classes were derived from a threshold.
It has four tabs: Overview, Curves, Compounds and Domain, with Export report at the right of the tab bar. The inspector summarises the classifier: model, compounds per set, number of classes, cross-validated accuracy and MCC, the number of compounds outside the domain and the descriptors.
Overview
Performance is one card per statistic with one line per set: Training, Cross-validation, Test and, when there is one, External. Read the cross-validation and test lines. A random forest reproduces its own training compounds almost perfectly, so its training line is close to 1.000 everywhere and says nothing about prediction.
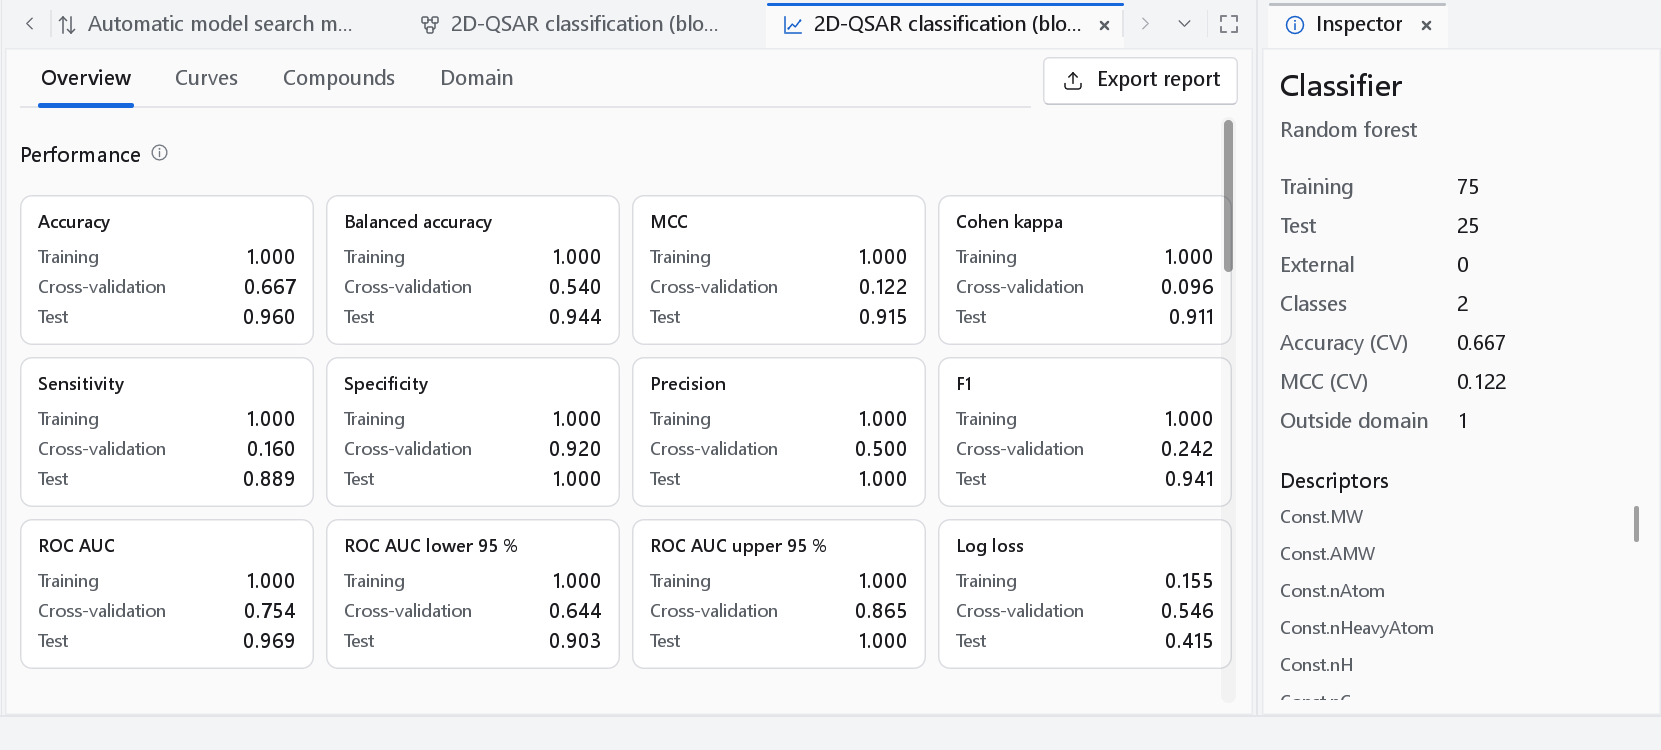
| Statistic | Definition | Reference |
|---|---|---|
| Accuracy | (TP + TN) / n: the fraction of compounds assigned to their observed class. Inflated by a majority class. | |
| Balanced accuracy | Mean of the recall of every class. A majority class cannot inflate it; 0.5 is chance for two classes. | Brodersen et al., Proc. ICPR 2010, p. 3121 |
| MCC | Matthews correlation coefficient: (TP TN - FP FN) / sqrt((TP + FP)(TP + FN)(TN + FP)(TN + FN)). +1 is a perfect prediction, 0 is chance, -1 the inverse. The single best summary for unequal classes. | Matthews, Biochim. Biophys. Acta 405:442 (1975); more than two classes: Gorodkin, Comput. Biol. Chem. 28:367 (2004) |
| Cohen kappa | Agreement of observed and predicted classes beyond what chance alone would give: 1 perfect, 0 chance. | Cohen, Educ. Psychol. Meas. 20:37 (1960) |
| Sensitivity | TP / (TP + FN): the true positive rate, or recall, of the positive class. | |
| Specificity | TN / (TN + FP): the true negative rate. | |
| Precision | TP / (TP + FP): the positive predictive value. | |
| F1 | Harmonic mean of precision and sensitivity. | van Rijsbergen, Information Retrieval, 2nd ed., Butterworths 1979 |
| ROC AUC | Area under the receiver operating characteristic curve: the probability that a positive compound scores above a negative one. 0.5 is chance. Independent of any threshold on the probability. | Hanley and McNeil, Radiology 143:29 (1982) |
| ROC AUC lower 95 %, ROC AUC upper 95 % | The limits of the confidence interval of the AUC, from the DeLong standard error. | DeLong, DeLong and Clarke-Pearson, Biometrics 44:837 (1988) |
| Log loss | Mean of -ln(probability given to the observed class). 0 is a perfect, confident prediction; ln 2 = 0.693 is what a two-class model scores when it always answers 0.5. A confident wrong probability is punished hardest. | Good, J. R. Stat. Soc. B 14:107 (1952) |
TP, FP, TN and FN count true and false positives and negatives. For two classes, sensitivity, specificity, precision and F1 refer to the positive class named in the Model section, which is a parameter of the validation node (see Classification models). With more than two classes the cards show the unweighted (macro) means of precision and F1 instead, and the Per class table gives sensitivity, specificity, precision and F1 of every class against the rest, for every set. A statistic the run could not define is left empty: a set with one class has no MCC and no ROC AUC, and a model without class probabilities has no log loss. The warnings of the run say which statistics were undefined and why.
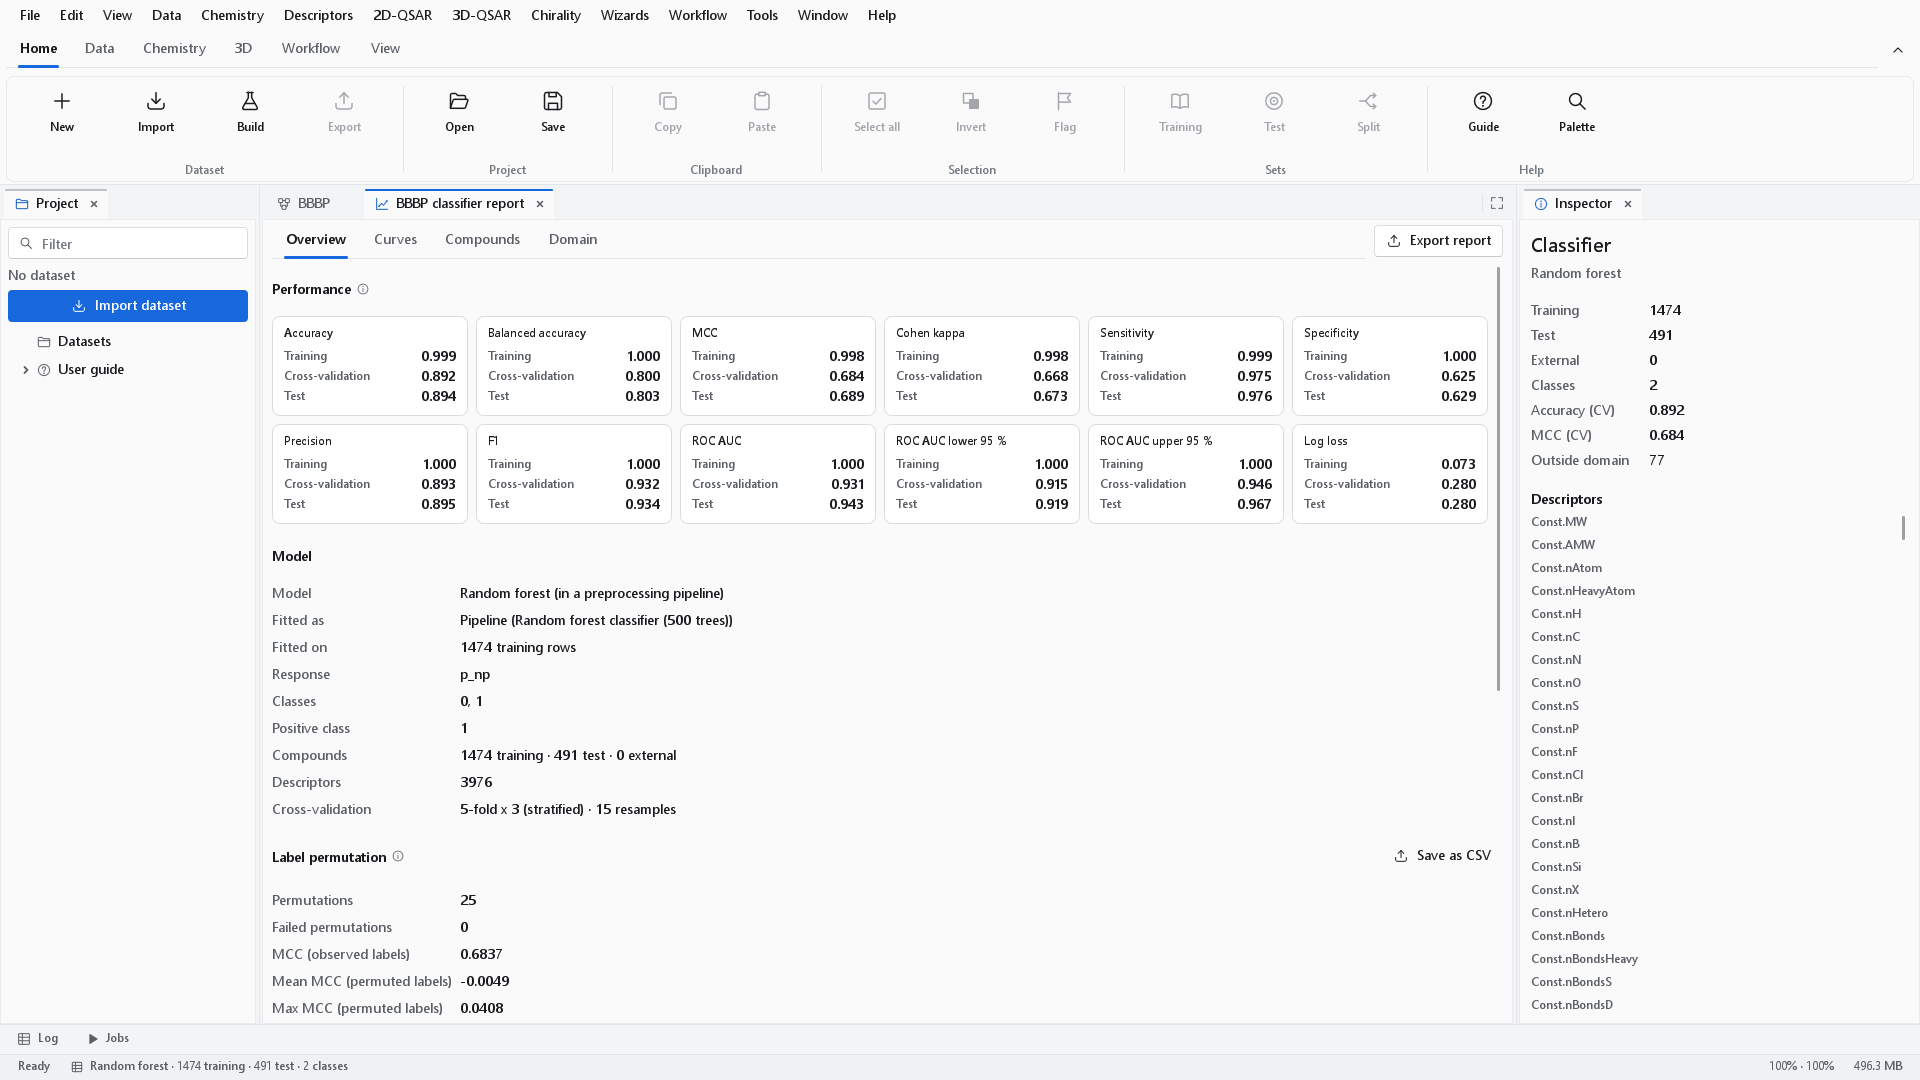
Below the cards, Model lists the model and how it was fitted, the response, the classes, the positive class, the compounds per set, the number of descriptors and the cross-validation scheme with its number of resamples. Then come Per class, Label permutation, the warnings and All metrics, the complete metric table with Save as CSV.
Label permutation
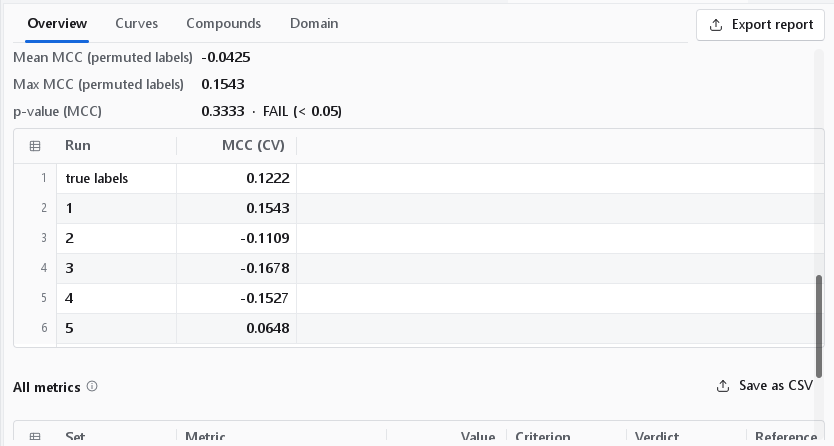
The cross-validated MCC with the true labels is compared with the same score after shuffling the labels. The section gives the number of permutations and of failed ones, the MCC with the observed labels, the mean and the largest MCC with permuted labels, and the p value: (1 + number of shuffles scoring at least as well) / (shuffles + 1) (Ojala and Garriga, J. Mach. Learn. Res. 11:1833, 2010). It passes below 0.05. The table lists the true labels in its first row and every shuffle after it.
Curves
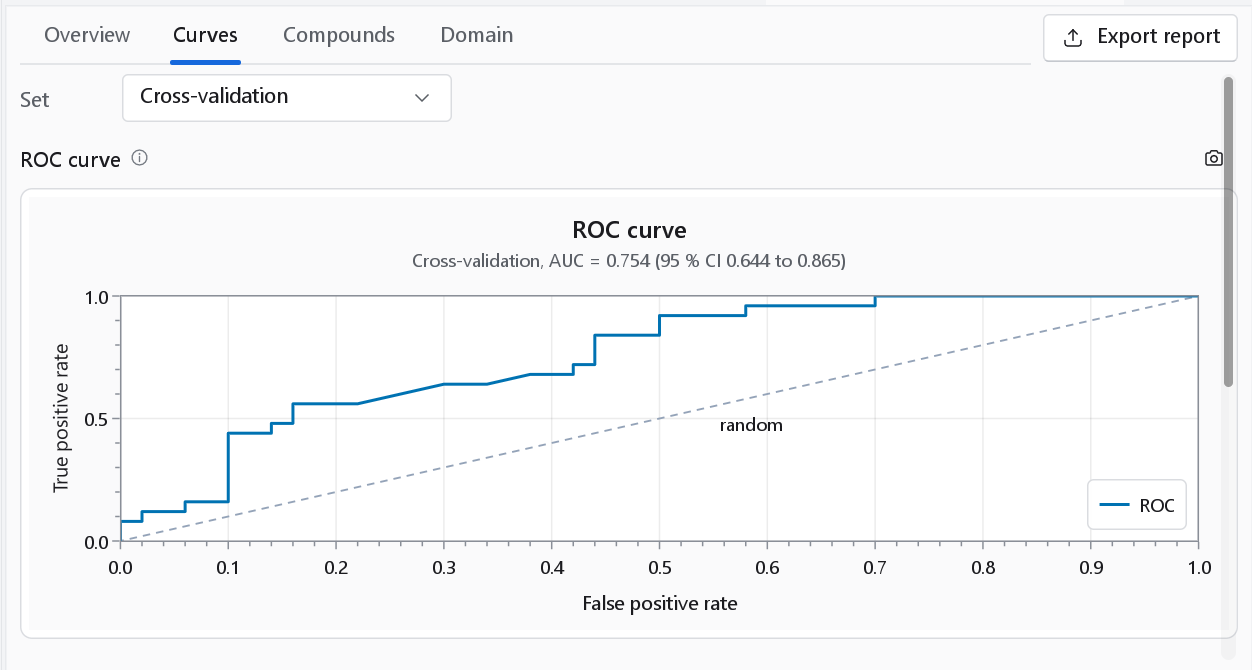
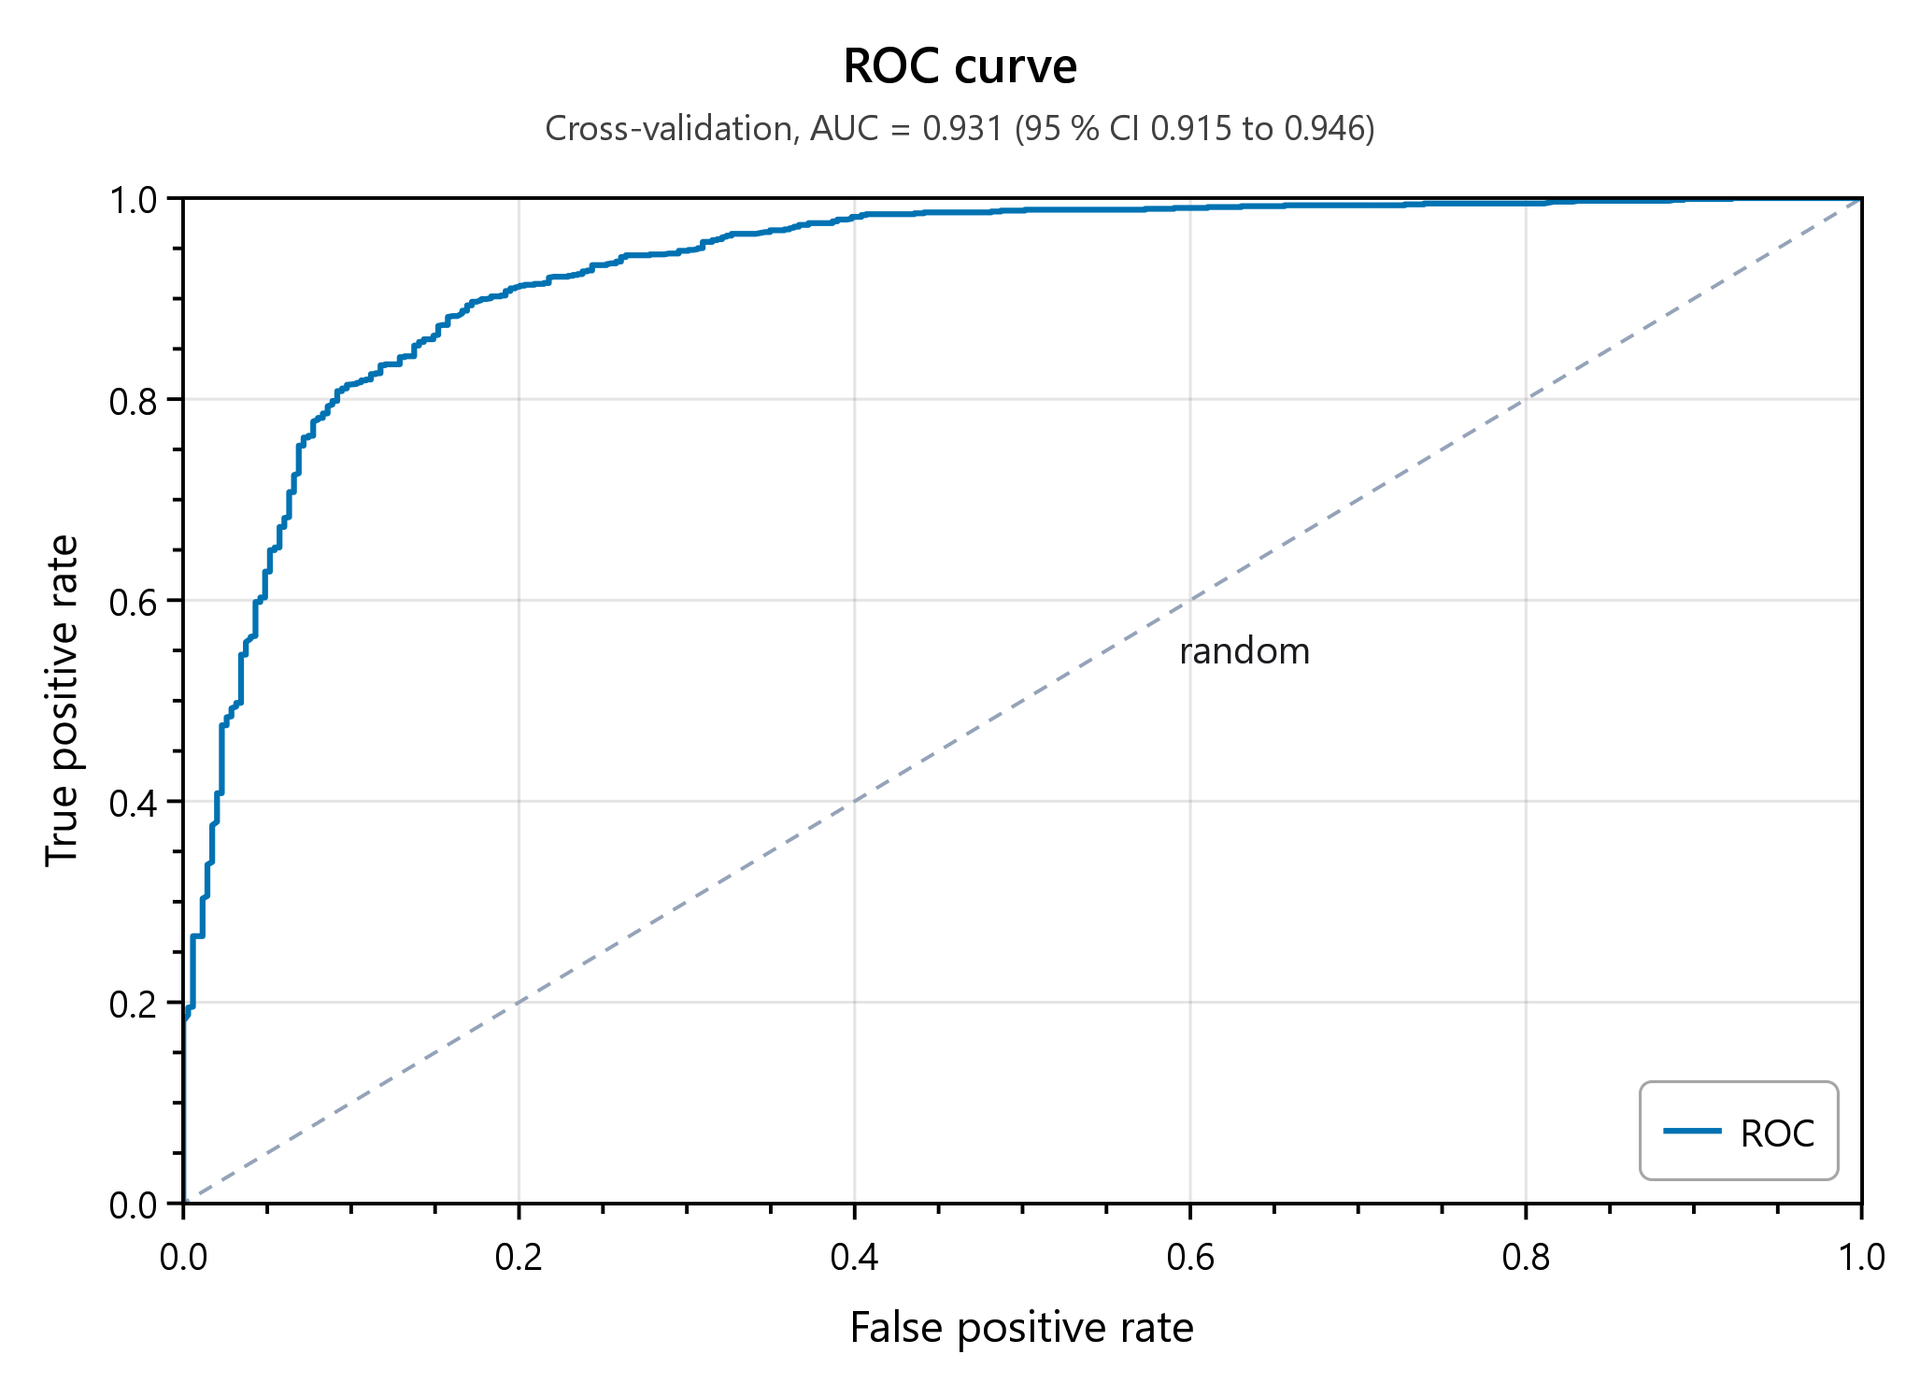
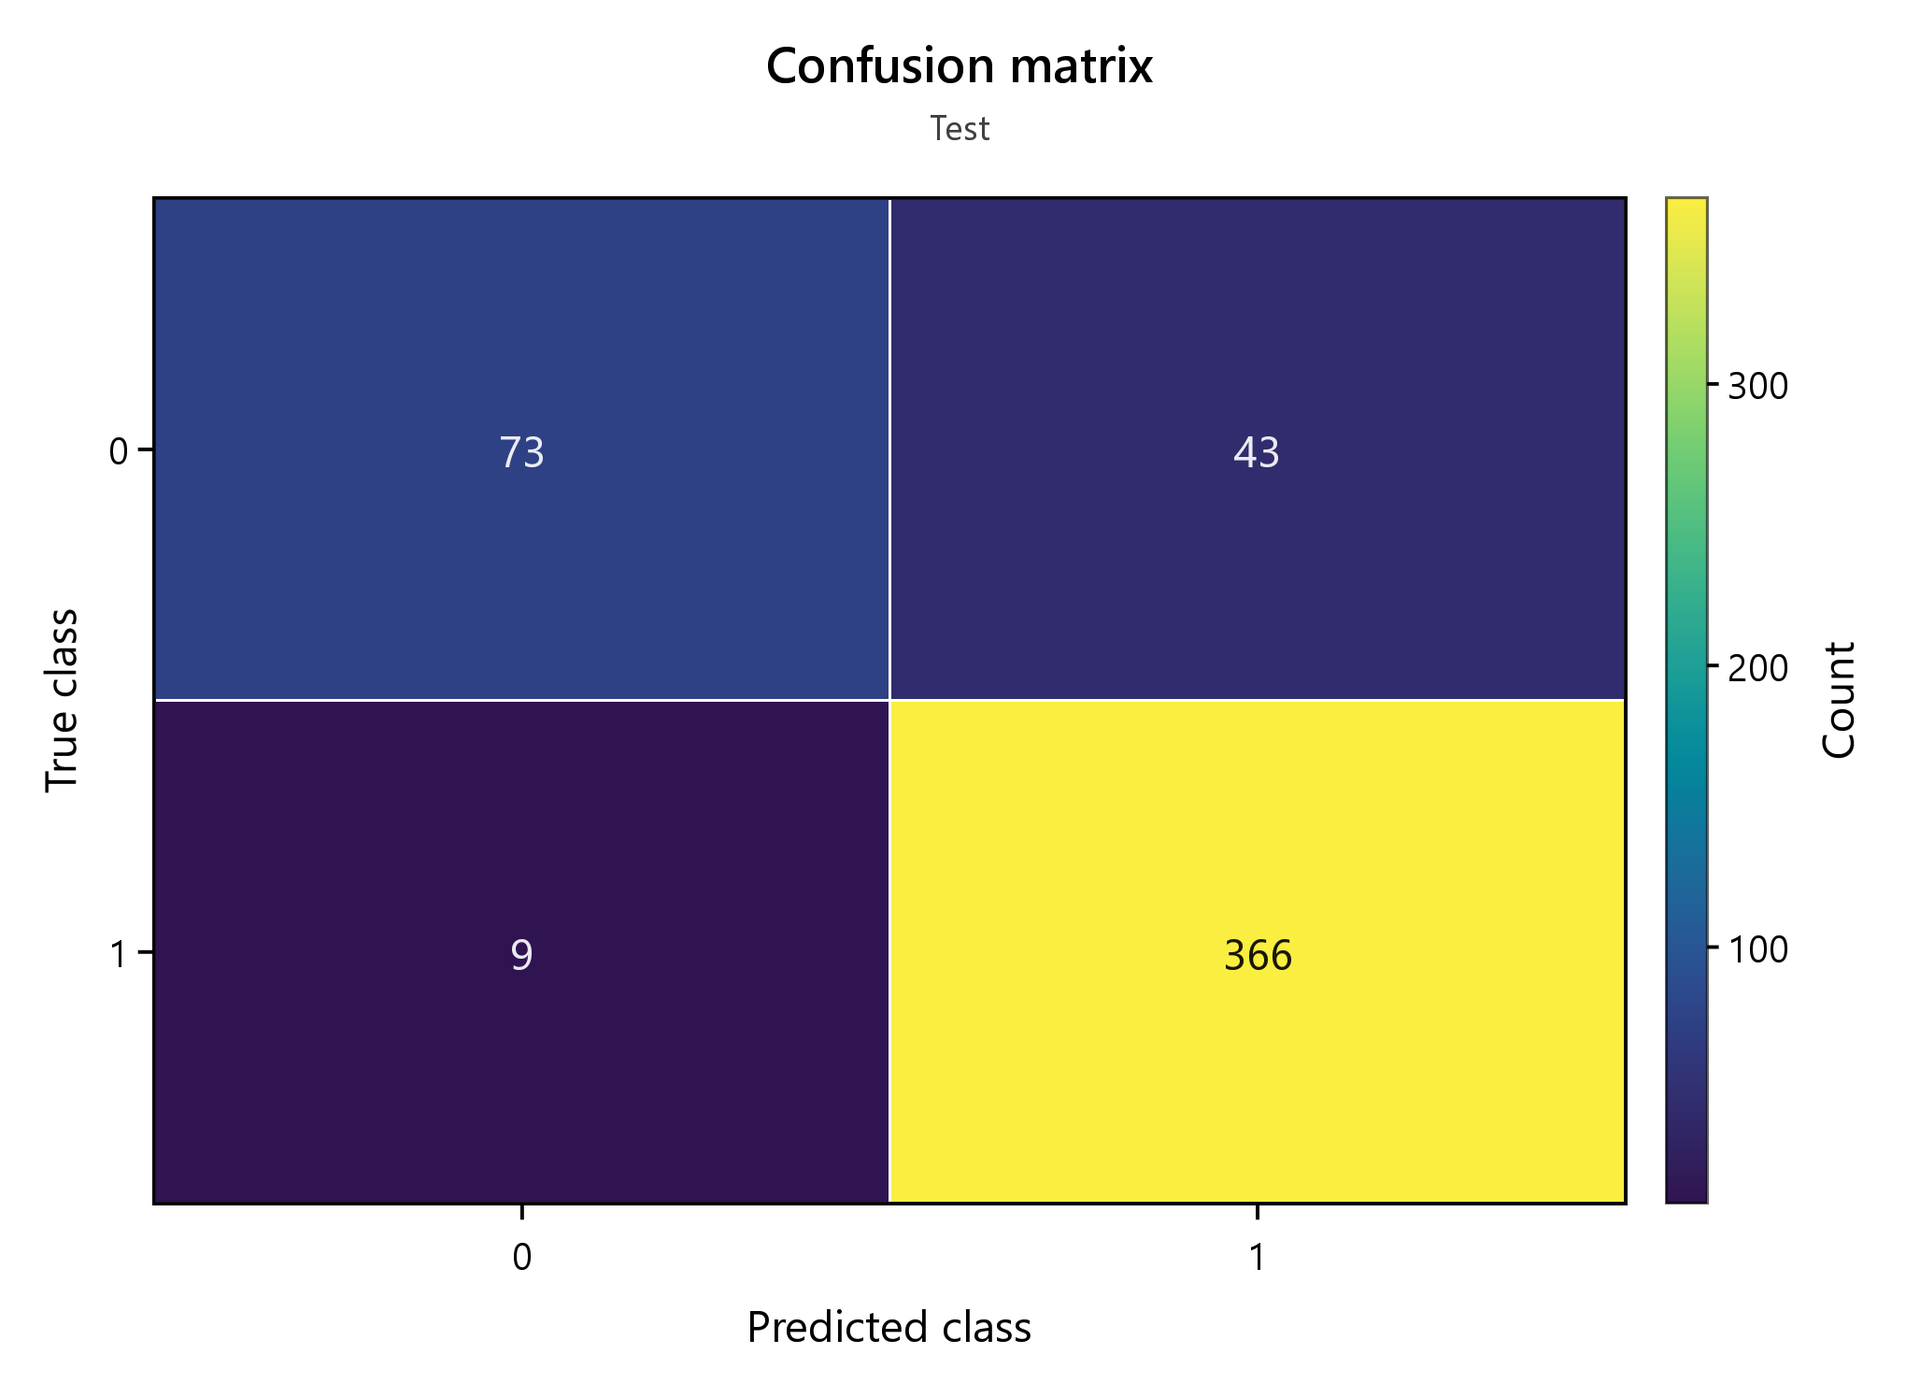
The Curves tab shows the ROC curve and the confusion matrix of one set. The Set drop-down chooses it and starts on Cross-validation, the set every training compound is predicted in without having been fitted on. The subtitle of the ROC curve gives the AUC with its 95 % confidence interval. The confusion matrix has the observed class in rows and the predicted class in columns, so the diagonal holds the correct predictions. The camera button of each chart opens the figure dialog.
Compounds
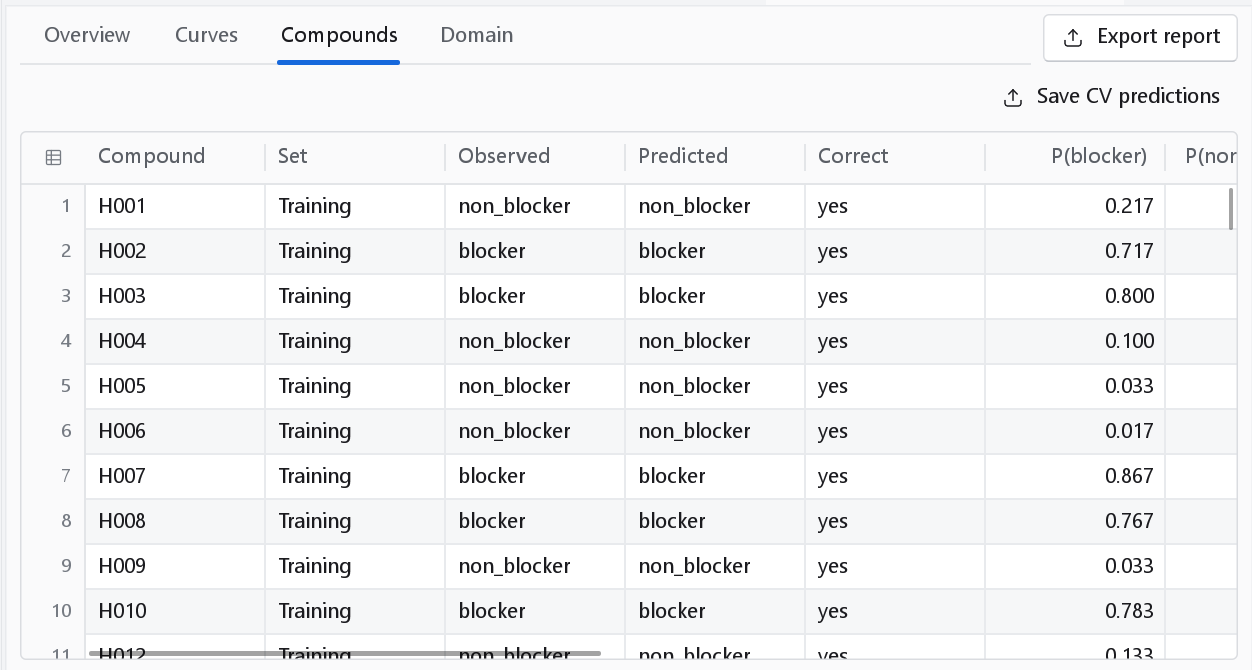
One row per compound: set, observed and predicted class by their labels, whether the prediction is Correct, one probability column per class, P(label), the cross-validated prediction with its probabilities and how often the compound was held out, and the domain flag. Save CV predictions writes the cross-validated predictions. The table shares its selection with the charts, as in the model dashboard.
Domain
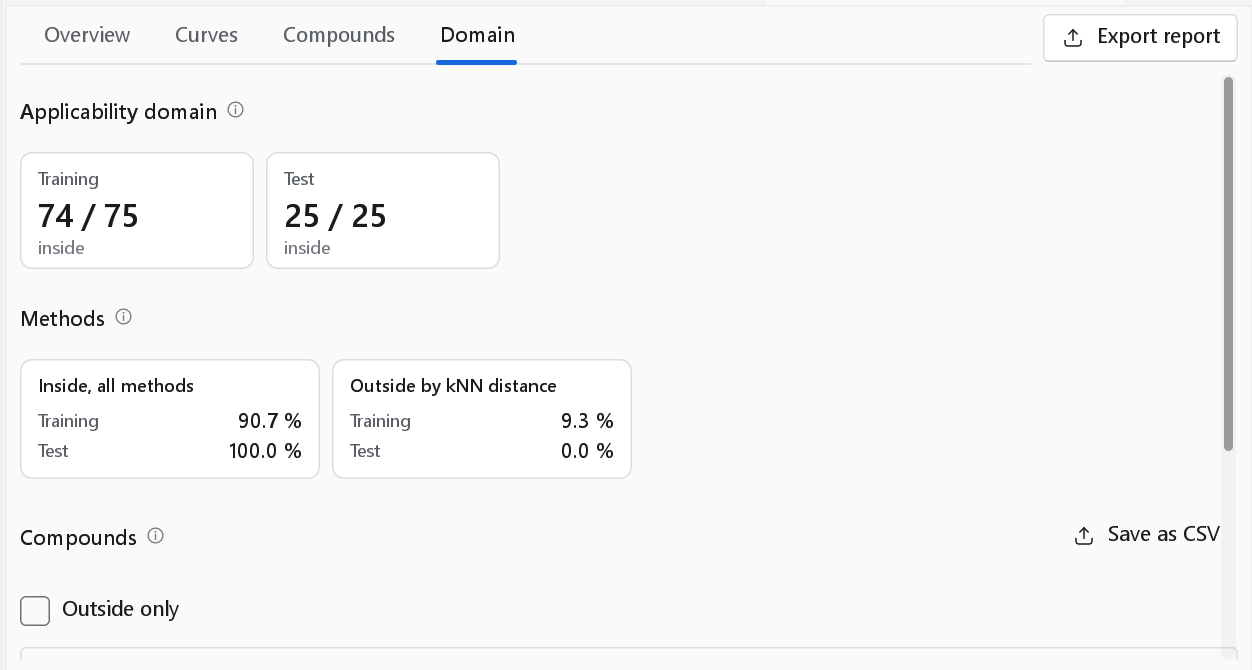
The validation report of a classifier has no domain assessment of its own. The dashboard asks the trained model for the domain verdict of every compound, so the verdicts are the ones a later prediction with this model would give. The tab shows the compounds inside per set, one card per method with the share of each set that method alone places outside, and the per-compound table with Outside only and Save as CSV. When the model was trained without an applicability domain the tab says so.
Another example