Molecular descriptors
The 52 descriptor families of GeinQSAR Studio, 11 302 columns in all: what each family encodes, how to compute it, and how a missing value is treated.
A descriptor is a number computed from a structure: a count, an index of the molecular graph, a property estimate, a bit of a fingerprint, a measure of the 3D shape. A model sees compounds only through their descriptors, so the choice of descriptors decides what a model can learn. GeinQSAR Studio computes its descriptors itself and groups them into families: blocks of columns that come from one definition. There are 52 families with 11 302 columns, 40 of them (9 896 columns) from the 2D structure and 12 (1 406 columns) from 3D coordinates.
Descriptors are computed in two places. The Descriptors menu adds them as columns to the open dataset, where they can be inspected, sorted, plotted and exported. A modelling wizard or workflow computes its own descriptors inside the workflow, from the families its recipe names, so a model never depends on columns that happen to be in a spreadsheet.
Computing descriptors in the spreadsheet
| Command | What it computes | Columns |
|---|---|---|
| Descriptors > Physicochemical properties | Wildman-Crippen logP and molar refractivity, TPSA, hydrogen-bond donors and acceptors, surface area, volume and polarisability, the drug-likeness rules, QED, ring complexity and the synthetic accessibility estimate. Runs at once. | 8 families, 54 columns |
| Descriptors > 2D descriptor set | Every 2D family with fewer than 256 columns, except the fingerprints and the count blocks (CATS, functional groups, Crippen atom types). Runs at once. | 25 families, 583 columns |
| Descriptors > Choose descriptors | Opens the Compute descriptors dialog, where any combination of families is ticked. | as ticked |
| Chirality > Add chirality descriptors | The families that concern stereochemistry and chirality, including the 3D chirality measures. |
The ribbon has the same three commands in its Descriptors group as Properties, 2D set and Choose. The E-state family (361 columns) is too wide for the 2D descriptor set; tick it in the dialog when you want it.
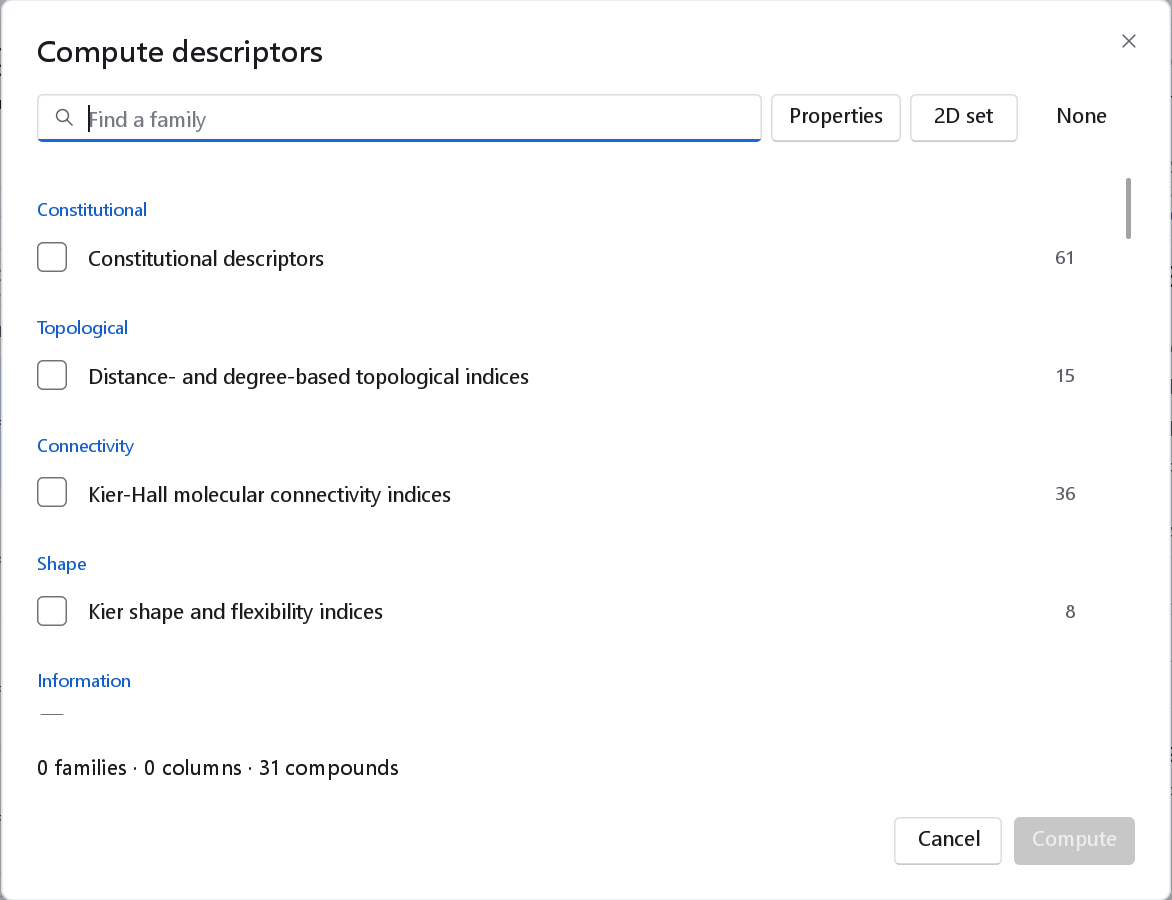
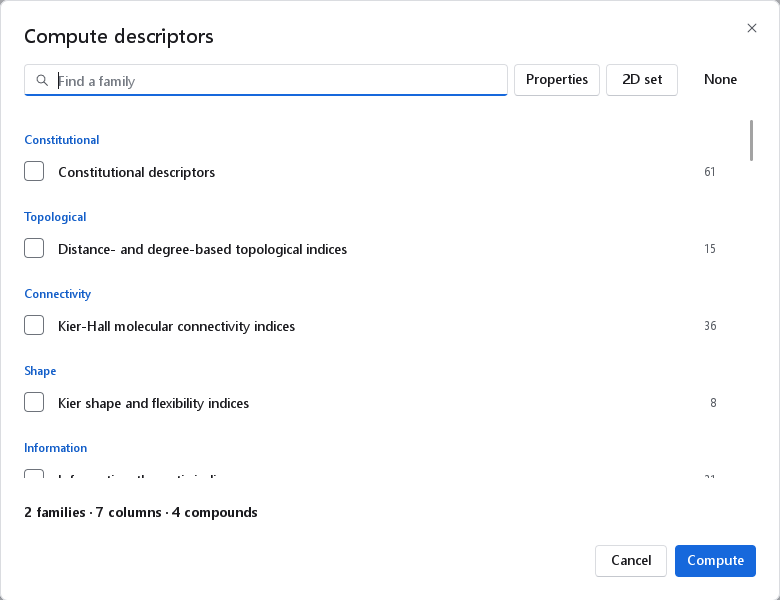
| Control | What it does |
|---|---|
| Find a family | Filters the list by family name and category as you type. |
| Properties | Ticks the families of Physicochemical properties. |
| 2D set | Ticks the families of the 2D descriptor set. |
| None | Clears every tick. |
| Family row | A check box, the family name, the number of columns, and the tag 3D for a family that needs 3D coordinates. Rest the pointer on the row for the definition. |
| Summary line | The number of families and columns ticked and the number of compounds they will be computed for. Above 2000 columns it warns that the table will be hard to read and suggests leaving out fingerprint families; with a 3D family ticked it says that compounds without 3D coordinates get empty cells. |
| Compute | Starts the calculation as a background job. Enabled once at least one family is ticked. |
The calculation runs in the Jobs panel, which shows its progress and has a cancel button; the spreadsheet stays usable. When it finishes, a notification gives the number of columns written, the number of compounds, the time taken and the number of structures skipped. Running a family again overwrites its columns; it never adds a second copy.
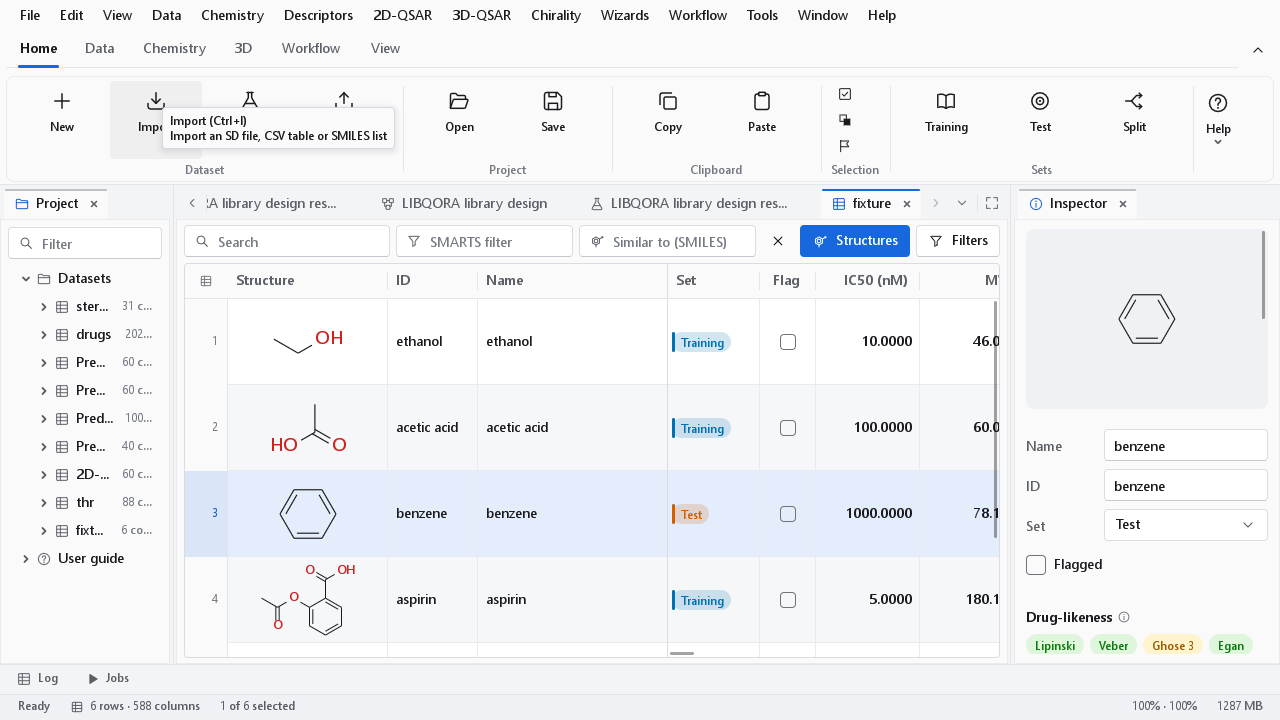
Every column name starts with a short prefix of its family, for example Const.AMW, Crippen.SLogP, BCUT.pL1, EState.Smax or ECFP4.b0887, so a block can be found, hidden or exported together. Rest the pointer on a column header to read the definition of the descriptor and its unit; click the header and the inspector shows the distribution of the column. Data > Column statistics gives the same figures for all rows or for one set.
The families
The tables list every family with the name the program shows. Classical marks the 19 families the regression recipes use as their interpretable descriptors (904 columns); fingerprint marks the three fingerprint families the recipes add to them (3 072 columns). Together these 22 families, 3 976 columns, are the table of the default recipes.
Constitutional and topological
| Family | Columns | What it encodes | When it helps |
|---|---|---|---|
| Constitutional descriptors (classical) | 61 | Molecular weight and mean atomic weight, counts of atoms, elements, bonds and rings by size, aromatic, sp3, sp2 and sp counts, the fraction of sp3 carbon, rotatable bonds, carbon-scaled property sums and formal charges. | Always. Size and composition explain a large share of most physicochemical endpoints. |
| Distance- and degree-based topological indices (classical) | 15 | Wiener, Balaban J, Harary, the Zagreb indices, Schultz and Gutman molecular topological indices, Szeged, eccentricity, radius and diameter of the molecular graph. | Branching and overall shape of the skeleton; congeneric series that differ in chain length or branching. |
| Kier-Hall molecular connectivity indices (classical) | 36 | Simple and valence chi indices of paths, clusters, path-clusters and chains, 18 of each kind. | Classic, well-studied descriptors of size, branching and heteroatom content. |
| Kier shape and flexibility indices (classical) | 8 | Kappa shape indices 1 to 3, their alpha-modified forms, the Phi flexibility index and alpha. | Shape and flexibility from the 2D graph, without 3D coordinates. |
| Information-theoretic indices (classical) | 31 | Bertz complexity and the information contents IC, TIC, SIC, CIC and BIC of neighbourhood orders 0 to 5. | Structural complexity and symmetry. |
| Gálvez topological charge indices (classical) | 21 | Topological charge indices GGI1 to GGI10 and JGI1 to JGI10, and JGT. | Charge transfer between atom pairs at a given topological distance. |
| 2D autocorrelation descriptors (classical) | 144 | Moreau-Broto, Moran and Geary autocorrelations at lags 1 to 8, weighted by mass, volume, electronegativity, polarisability, ionisation potential and intrinsic state. | How a property is distributed over the molecule; a fixed-length vector for any size of molecule. |
| Burden eigenvalues (BCUT) (classical) | 16 | Highest and lowest two eigenvalues of the Burden matrix weighted by atomic number, mass, polarisability and electronegativity. | Compact, diversity-oriented summaries of the graph. |
| Burden eigenvalues (partial charge) | 4 | The same with Gasteiger-Marsili partial charges as weights. | Electrostatic character of the skeleton. |
| Matrix-based spectral and detour indices (classical) | 9 | Leading eigenvalues and spectral sums of the adjacency, distance and detour matrices, and related indices. | Graph spectra as compact shape descriptors. |
| Walk counts and spectral moments (classical) | 27 | Molecular and total walk counts, self-returning walk counts and edge-adjacency spectral moments. | Size and branching; the counts grow very quickly with size, so they need scaling. |
| Electrotopological state indices (classical) | 361 | E-state values of 79 atom types (sum, count, maximum, minimum), hydrogen E-state values and global indices. | Strong, interpretable descriptors of polar and electronic character at the atom level. |
| Functional group counts (classical) | 125 | Counts of the built-in functional-group library. | Direct chemical interpretation: "one more carboxylic acid". |
Physicochemical, drug-likeness and property estimates
| Family | Columns | What it encodes | When it helps |
|---|---|---|---|
| Wildman-Crippen logP / MR (classical) | 3 | Atom-contribution logP and molar refractivity, and the number of atoms without a type. | Lipophilicity is the first descriptor to try for permeability, solubility, protein binding and many potencies. |
| Wildman-Crippen atom-type counts | 72 | The count of each Crippen atom type. | A transparent fragment description; mostly for analysis. |
| Burden eigenvalues (Wildman-Crippen logP contribution) | 4 | BCUT eigenvalues weighted by the logP contribution of each atom. | Distribution of lipophilicity over the graph. |
| Topological polar surface area (classical) | 3 | TPSA from N and O, TPSA including S and P, and the atoms without a contribution. | Absorption, permeability and blood-brain barrier passage. |
| Surface area, volume and polarizability (classical) | 5 | Labute approximate surface area, McGowan volume, van der Waals volume, atomic and bond polarisability. | Size-driven endpoints, without 3D coordinates. |
| Hydrogen-bond donors and acceptors (classical) | 4 | Donors and acceptors by the Lipinski definition and by GeinQSAR's own patterns. | Solubility, permeability and the rule of five. |
| Drug-likeness rules (classical) | 15 | Violations and pass flags of the Lipinski, Veber, Ghose, Egan, Muegge, lead-likeness and rule-of-three filters, and the number of structural alerts. | Filtering and annotation more than modelling. |
| QED drug-likeness (classical) | 11 | The quantitative estimate of drug-likeness, its maximum and unweighted forms, and the eight desirability functions. | Ranking compounds for drug-likeness. |
| Ring complexity and Fsp3 (classical) | 9 | Rings, aromatic rings, ring systems, spiro and bridgehead atoms, macrocycles, unusual rings, a complexity score and the fraction of sp3 carbon. | Scaffold character; aromatic ring count and Fsp3 correlate with solubility. |
| GeinQSAR synthetic accessibility estimate | 4 | An uncalibrated complexity heuristic on a scale of 1 to 10, its raw score and the numbers of stereocentres and stereo bonds. | A rough ordering only. It is not the published synthetic accessibility score and must not be quoted as one. |
Pharmacophore and fingerprints
A fingerprint encodes which substructures are present rather than a property. Its columns are many and individually meaningless, but together they describe local chemistry very well, which is why the default recipes add three of them to the classical families. They are meant for similarity searching and models, not for reading in the spreadsheet. Bit fingerprints hold 0 or 1 per column; count fingerprints hold how often the hashed feature occurs.
| Family | Columns | What it encodes | When it helps |
|---|---|---|---|
| CATS 2D pharmacophore pairs | 150 | Counts of 15 pharmacophore-type pairs at topological distances 0 to 9. | Scaffold hopping: compounds with different skeletons but similar feature arrangements. |
| CATS 2D pharmacophore pairs (scaled) | 150 | The same divided by the number of heavy atoms. | As above, independent of size. |
| ECFP4 fingerprint (1024 bits) (fingerprint) | 1024 | Circular atom environments of radius 2, folded to 1024 bits. | The standard fingerprint for similarity and machine learning; part of the default recipes. |
| FCFP4 fingerprint (1024 bits) | 1024 | The same with pharmacophoric atom features instead of atom types. | Similarity by function rather than by exact atoms. |
| MACCS 166 structural keys | 166 | The public set of 166 substructure keys. | Coarse, interpretable substructure screening. |
| Atom-pair fingerprint (1024 count bins) (fingerprint) | 1024 | Pairs of atom types with their topological distance up to 30 bonds, counted into 1024 bins. | Global shape and composition; part of the default recipes. |
| Topological-torsion fingerprint (1024 count bins) (fingerprint) | 1024 | Linear sequences of four bonded atoms, counted into 1024 bins. | Local chain chemistry; part of the default recipes. |
| Linear-path fingerprint (1024 bits) | 1024 | Simple paths of 1 to 7 bonds, folded to 1024 bits. | Substructure-style similarity. |
| 2D pharmacophore pair/triplet fingerprint (1024 count bins) | 1024 | Pharmacophore feature pairs and triplets with binned topological distances. | Feature-based similarity across scaffolds. |
| Molecular hologram (length 97) | 97 | Fragments of 4 to 7 atoms hashed into 97 bins. | Hologram-type QSAR on congeneric series. |
3D descriptors
A family marked 3D is computed from the coordinates of the molecule. Nothing in a descriptor calculation generates coordinates: a compound without them gets empty cells in every 3D column, and the reason is written to the log. Give a dataset 3D structures first, by importing an SD or MOL2 file with coordinates or by generating conformers in the 3D workspace (3D-QSAR > Generate conformers for the selection). In a workflow, put a Generate 3D structure or conformer node before the descriptor node; a descriptor node that is given no 3D coordinates at all for a 3D family stops and says so. 3D descriptors depend on the conformer, so compare them only between structures prepared the same way. Families that need partial charges get Gasteiger-Marsili charges when the molecule has none.
| Family | Columns | What it encodes | When it helps |
|---|---|---|---|
| Geometric 3D descriptors | 28 | Principal moments of inertia and their ratios, radius of gyration, asphericity, dimensions, 3D Wiener, Harary and Balaban indices, Petitjean shape and gravitational indices. | Overall 3D size and shape, rod against disc against sphere. |
| WHIM descriptors | 119 | 17 weighted holistic invariant molecular indices for each of 7 atomic weightings. | Size, shape, symmetry and atom distribution in 3D. |
| GETAWAY descriptors | 273 | Leverage-weighted autocorrelations from the molecular influence matrix, lags 0 to 8, 7 weightings, and global indices. | 3D geometry with atom properties. |
| 3D-MoRSE descriptors | 224 | Electron-diffraction-like signals at 32 scattering values for 7 weightings. | Detailed 3D structure as a fixed-length vector. |
| RDF descriptors | 210 | Radial distribution function from 1.0 to 15.5 Å for 7 weightings. | Interatomic distance distribution. |
| 3D autocorrelation descriptors | 228 | Moreau-Broto, Moran and Geary autocorrelations over 1 Å distance bins from 1 to 12 Å. | Property distribution in space. |
| 3D surface area and volume | 11 | Solvent-accessible surface and its partitions, 3D polar surface, van der Waals surface and volume, sphericity. | Conformation-dependent surface properties. |
| Charged partial surface area (CPSA) | 29 | Surface areas weighted by positive and negative partial charges, and their differences and fractions. | Polar interactions and solvation. |
| Electric moments (3D) | 8 | Dipole moment and its components along the principal axes, quadrupole eigenvalues and norm. | Overall charge separation. |
| Ultrafast shape recognition (USR / USRCAT) | 60 | 12 shape moments of atomic distance distributions and 48 moments by pharmacophore atom class. | Fast shape similarity. |
| 3D pharmacophore pair counts | 168 | 21 feature-type pairs in 8 distance bins. | Spatial arrangement of pharmacophore features. |
Chirality-aware families
Two enantiomers have the same graph, the same atom counts and the same internuclear distances, so every family above gives them identical values, and a model built on those descriptors predicts the same activity for both. The families below are the ones that tell stereoisomers apart. Five 2D families separate enantiomers (the stereochemical counts, the chirality-corrected indices, the chirality autocorrelation, the chiral ECFP4 and the chiral atom pairs), and in 3D the 3D chirality measures do; the ZE-isomerism and relative stereo families separate E/Z isomers and diastereomers only. They need perceived stereochemistry (CIP labels), which the wizards switch on by default. See Chirality and activity cliffs for the analysis that shows when a data set needs them.
| Family | Columns | What it encodes | When it helps |
|---|---|---|---|
| Stereochemical counts | 38 | Counts of stereocentres and CIP labels, a meso flag, the number of stereoisomers and stereo-complexity indices. | Any set with defined stereochemistry. |
| Chirality-corrected topological indices | 51 | Connectivity, Zagreb, Wiener, Gutman and Balaban indices with a chirality correction, and their antisymmetric parts. | Enantiomer pairs with different activities. |
| ZE-isomerism corrected topological indices | 25 | The same indices with an E/Z correction. | Sets with E/Z isomers. |
| Chirality autocorrelation | 24 | Autocorrelations at lags 1 to 8 with the CIP parity as the atomic property. | Where in the molecule the stereocentres sit. |
| Relative stereo descriptors | 15 | Like and unlike pairs of stereocentres, by distance, and ring cis/trans relations. | Diastereomer series. |
| Chiral ECFP4 fingerprint (1024 bits) | 1024 | ECFP4 with the CIP parity in the atom invariant. | A fingerprint model on a set with enantiomers. |
| Chiral atom-pair fingerprint (1024 counts) | 1024 | Atom pairs with parity-extended atom types. | As above, for atom-pair models. |
| 3D chirality measures (3D) | 48 | Continuous chirality measure, the Osipov-Pickup-Dunmur index, signed chiral volumes, twist and axial descriptors, and chirality-signed MoRSE and RDF. | Signed 3D chirality, axial and helical chirality. |
In the wizards the check box Chirality-aware families next to the family list adds the seven 2D families in one tick. They are not part of any recipe because they add fingerprint columns; tick them for a data set that holds stereoisomers. The Selection drop-down of a wizard also offers the presets chirality-aware 2D (24 families, 2 953 columns) and chirality-aware 3D (13 families, 2 890 columns).
Missing values
A descriptor that cannot be computed for a structure is a missing value, shown as an empty cell and written as an empty field to a CSV file. It is never replaced by zero, because zero is a value. The cases are:
- A family fails for one compound: only that family's cells of that compound stay empty, and the reason is written to the log as "row N: family: message".
- A computed value is infinite: it is set to missing, with a warning.
- The structure cannot be prepared at all: its whole row of descriptors is empty and the compound is counted as skipped in the notification.
- A 3D family and a compound without 3D coordinates: the 3D cells of that compound are empty.
A model cannot use an empty cell, so missing values are imputed inside the model: the Missing values setting of the wizard (mean, median or k nearest neighbours) is fitted on the training compounds only, refitted in every cross-validation fold, and stored with the model so that a new compound is treated the same way. With None a training node refuses a table with gaps. A column that is constant or nearly duplicates another is removed by the descriptor filter of the same step. See The 2D-QSAR wizard, Preprocessing.
References
The code cites these original definitions; the tooltip of a family gives the same reference.
- Constitutional and ring counts: Todeschini and Consonni, Molecular Descriptors for Chemoinformatics, Wiley-VCH 2009; Lovering, Bikker and Humblet, J. Med. Chem. 52:6752 (2009) for Fsp3; Veber et al., J. Med. Chem. 45:2615 (2002).
- Topological indices: Wiener, J. Am. Chem. Soc. 69:17 (1947); Balaban, Chem. Phys. Lett. 89:399 (1982); Gutman and Trinajstić, Chem. Phys. Lett. 17:535 (1972); Schultz, J. Chem. Inf. Comput. Sci. 29:227 (1989); Petitjean, J. Chem. Inf. Comput. Sci. 32:331 (1992).
- Connectivity: Randić, J. Am. Chem. Soc. 97:6609 (1975); Kier and Hall, J. Pharm. Sci. 65:1806 (1976). Shape: Kier, Quant. Struct.-Act. Relat. 4:109 (1985), 8:221 (1989).
- Information content: Bertz, J. Am. Chem. Soc. 103:3599 (1981); Basak and Magnuson, Arzneim.-Forsch. 33:501 (1983).
- Topological charge: Gálvez, García, Salabert and Soler, J. Chem. Inf. Comput. Sci. 34:520 (1994). Autocorrelation: Moreau and Broto, Nouv. J. Chim. 4:359 (1980); Moran, Biometrika 37:17 (1950); Geary, Incorp. Statist. 5:115 (1954).
- Burden eigenvalues: Burden, J. Chem. Inf. Comput. Sci. 29:225 (1989); Pearlman and Smith, J. Chem. Inf. Comput. Sci. 39:28 (1999). Walk counts: Rücker and Rücker, J. Chem. Inf. Comput. Sci. 33:683 (1993).
- E-state: Hall and Kier, J. Chem. Inf. Comput. Sci. 35:1039 (1995); Kier and Hall, Pharm. Res. 7:801 (1990).
- logP and molar refractivity: Wildman and Crippen, J. Chem. Inf. Comput. Sci. 39:868 (1999). TPSA: Ertl, Rohde and Selzer, J. Med. Chem. 43:3714 (2000). Surface area: Labute, J. Mol. Graph. Model. 18:464 (2000).
- Drug-likeness: Lipinski et al., Adv. Drug Deliv. Rev. 23:3 (1997); Ghose, Viswanadhan and Wendoloski, J. Comb. Chem. 1:55 (1999); Egan, Merz and Baldwin, J. Med. Chem. 43:3867 (2000); Muegge, Heald and Brittelli, J. Med. Chem. 44:1841 (2001); Brenk et al., ChemMedChem 3:435 (2008). QED: Bickerton et al., Nat. Chem. 4:90 (2012).
- Fingerprints: Rogers and Hahn, J. Chem. Inf. Model. 50:742 (2010); Carhart, Smith and Venkataraghavan, J. Chem. Inf. Comput. Sci. 25:64 (1985); Nilakantan et al., J. Chem. Inf. Comput. Sci. 27:82 (1987); Durant et al., J. Chem. Inf. Comput. Sci. 42:1273 (2002); Schneider et al., Angew. Chem. Int. Ed. 38:2894 (1999) for CATS; Tong et al., J. Chem. Inf. Comput. Sci. 38:669 (1998) for holograms.
- 3D: Todeschini and Gramatica, Quant. Struct.-Act. Relat. 16:113 (1997) for WHIM; Consonni, Todeschini and Pavan, J. Chem. Inf. Comput. Sci. 42:682 (2002) for GETAWAY; Schuur, Selzer and Gasteiger, J. Chem. Inf. Comput. Sci. 36:334 (1996) for 3D-MoRSE; Hemmer, Steinhauer and Gasteiger, Vib. Spectrosc. 19:151 (1999) for RDF; Stanton and Jurs, Anal. Chem. 62:2323 (1990) for CPSA; Ballester and Richards, J. Comput. Chem. 28:1711 (2007) for USR.
- Chirality: Golbraikh, Bonchev and Tropsha, J. Chem. Inf. Comput. Sci. 41:147 (2001) and 42:769 (2002); Zabrodsky and Avnir, J. Am. Chem. Soc. 117:462 (1995); Osipov, Pickup and Dunmur, Mol. Phys. 84:1193 (1995).