Structure quality tools
Checking that the receptor is worth docking into: backbone geometry, disorder, and what the structure tree tells you about what is missing.
Docking assumes the receptor is right. It is worth spending a few minutes checking that assumption, particularly on a structure you did not produce yourself, because every problem in the receptor is inherited silently by every result that follows.
The Ramachandran plot
Analyze › Ramachandran Plot plots the backbone torsion angles of every residue against the regions that real protein structures occupy. A residue outside those regions has a backbone conformation that is either genuinely strained or simply modelled wrongly.
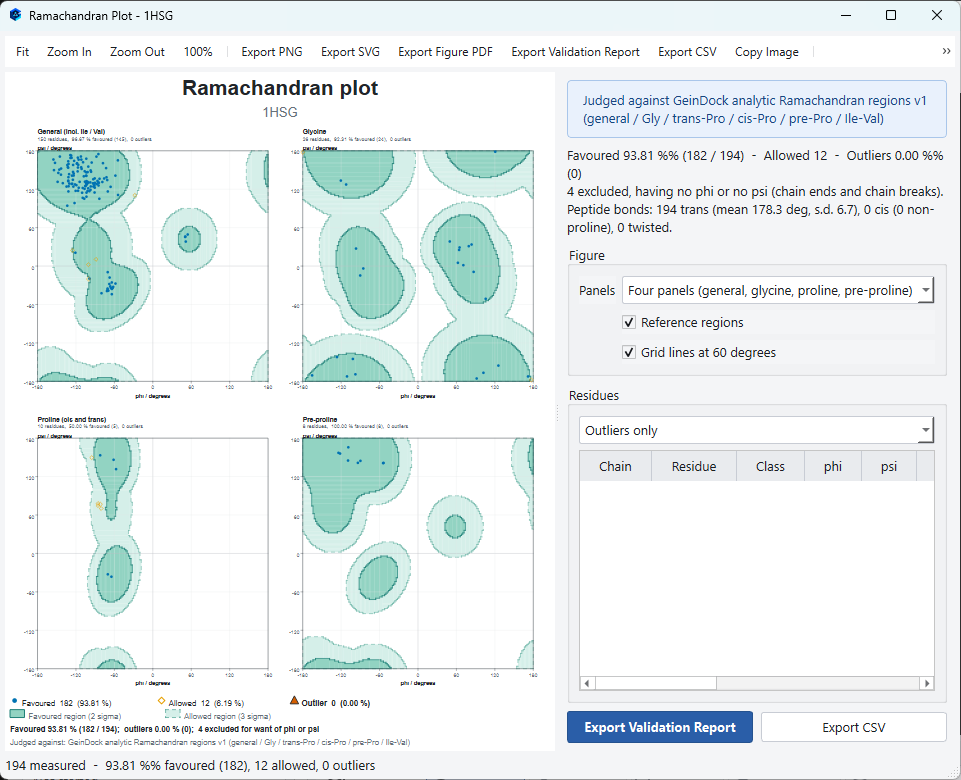
Why there are four panels
Glycine has no side chain and can adopt conformations no other residue can. Proline is locked by its ring. The residue before a proline is restricted by it. Isoleucine and valine are restricted by their branching. Plotting all of these on one chart would flag correct residues as outliers and let real outliers pass, so each class is judged against its own reference regions.
| Panel | What it holds |
|---|---|
| General | Everything that does not belong to one of the special classes, including isoleucine and valine. |
| Glycine | Glycine alone, which has much wider allowed regions. |
| Proline | Proline, split into its cis and trans forms. |
| Pre-proline | Residues immediately before a proline. |
Choosing the layout
The Panels choice in the window sets how the figure is divided.
| Panels | When to use it |
|---|---|
| Four panels (general, glycine, proline, pre-proline) | The layout described above, and the one to use for assessing a structure. |
| Six panels (every residue class) | Gives each residue class a panel of its own. Use it when you want to see the classes that the four panel figure draws together. |
| Combined, one panel | Every residue over a single set of regions. It is the compact, familiar picture for a slide or a small figure, but it places residues of different classes over regions that were not drawn for them, so do not judge outliers from it. |
Reading the summary
The block at the top right reports the percentage of residues in favoured regions, the number merely allowed, and the number of outliers, together with a count of residues excluded because they have no phi or psi angle, which is normal at chain ends and at breaks. It also reports the peptide bond geometry, including how many bonds are cis and how many are twisted.
| Figure | What is normal | What it means if it is not |
|---|---|---|
| Favoured | Above about 98 percent for a well refined structure. | A markedly lower figure suggests a poorly refined or heavily modelled structure. |
| Outliers | Zero, or a very small number. | Each outlier is a residue worth looking at. One in the binding site matters far more than one on a surface loop. |
| Cis peptide bonds | A small number, almost all before proline. | A cis bond that is not before a proline is unusual and is usually a modelling error. |
| Twisted peptide bonds | None. | A twisted bond is a geometry problem in the model. |
The residue table
Every measured residue is listed with its chain, name, class and its two angles. The selector above the table filters it, so you can list the outliers alone. Export Validation Report writes the whole assessment to a document and Export CSV writes the angles as data.
Checking the structure tree
The Structure panel is a quality tool as much as a navigation one. Three things are worth a glance on any new structure.
| Check | What to look for |
|---|---|
| Residue count per chain | Against what you expect for that protein. A short count means unresolved regions, and if a missing loop borders your binding site the pocket is open where it should be closed. |
| The Ligands branch | Whether anything you meant to remove is still there, and whether anything you meant to keep was removed. |
| The Ions and Buffers branch | Whether a catalytic metal is present. A metal dependent enzyme docked without its metal will not reproduce anything. |
Colour by B-factor
View › Receptor Colour › By B-factor is the fastest structural quality check there is. It colours each atom by how well ordered it is in the crystal. Warm regions are poorly ordered, which means their coordinates carry more uncertainty.
The order to check things in
- Look at the structure. Load it, draw it as a cartoon, and see whether it looks like the protein you expected. Missing regions and unexpected chains are obvious at this stage and expensive later.
- Check the tree. Residue counts, ligands, ions and waters, as above.
- Colour by B-factor. Ten seconds, and it tells you whether the binding site is well determined.
- Run the Ramachandran plot. Look at the outliers and ask whether any of them are near your site.
- Validate the binding site. Redocking validation is the end to end test. If the first four checks pass and this one fails, the problem is in the box or the settings rather than the structure.