The 2D interaction diagram
Turning a pose into a figure: what the diagram shows, how to control what it draws, and which export format to choose.
The three dimensional view shows you the truth, and it is difficult to put in a report. The two dimensional interaction diagram flattens a pose into a picture that reads at a glance and prints cleanly: the ligand drawn as a structure, the contacting residues arranged around it, and every contact drawn in the colour of its class.
Select a pose, then choose Analyze › 2D Interaction Diagram.
Reading the diagram
| Element | What it means |
|---|---|
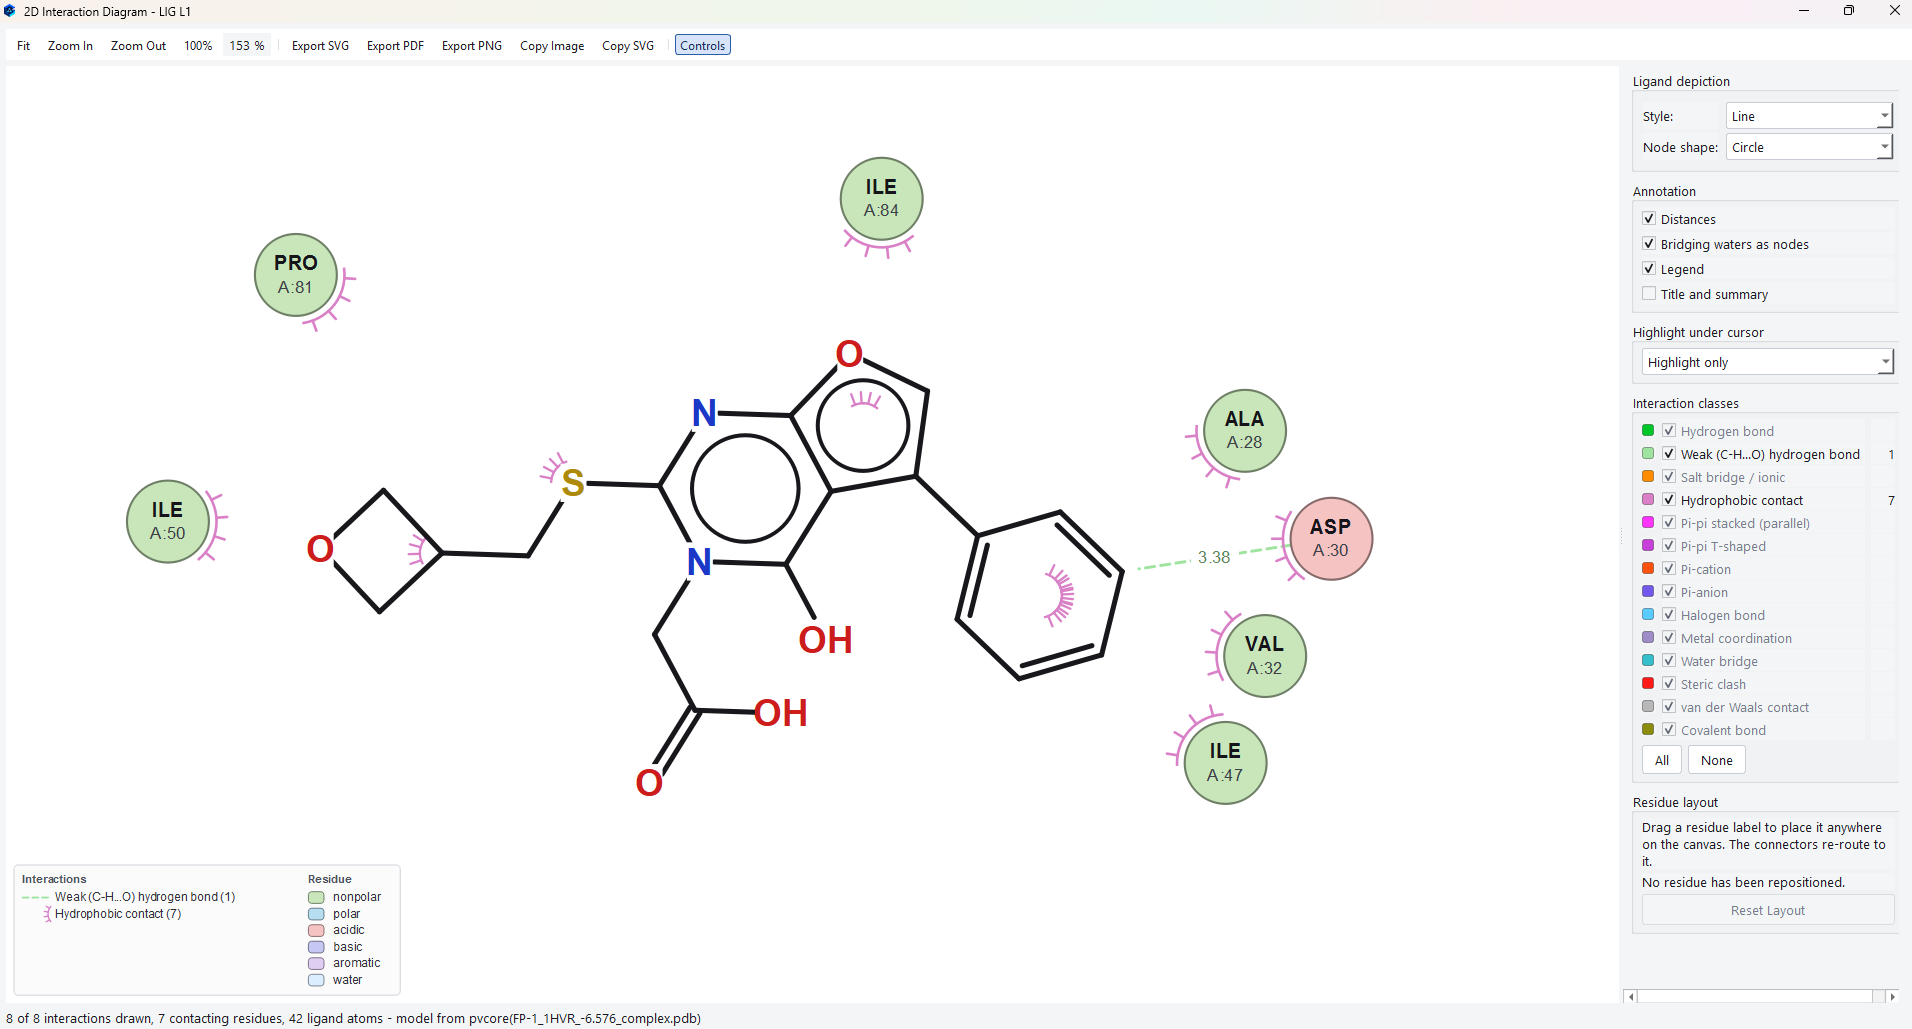
| The structure in the middle | Your ligand, drawn from its actual atoms rather than from a template, so what you see is the compound that was docked. |
| The circles around it | The residues that contact it, labelled with the three letter code, the chain and the sequence number. |
| The colour of each circle | The chemistry of that residue: nonpolar, polar, acidic, basic, aromatic, or a retained water. |
| Dashed lines | Directional contacts, with the distance labelled. The colour gives the class. |
| Eyelash arcs | Hydrophobic contact, which has no single direction to draw. |
| The legend | Every class present in this diagram, with its count. |
| The status line | How many contacts were drawn out of how many exist, how many residues are involved, and which pose file the diagram came from. |
Controlling the depiction
Controls opens the panel on the right.
| Group | What it does |
|---|---|
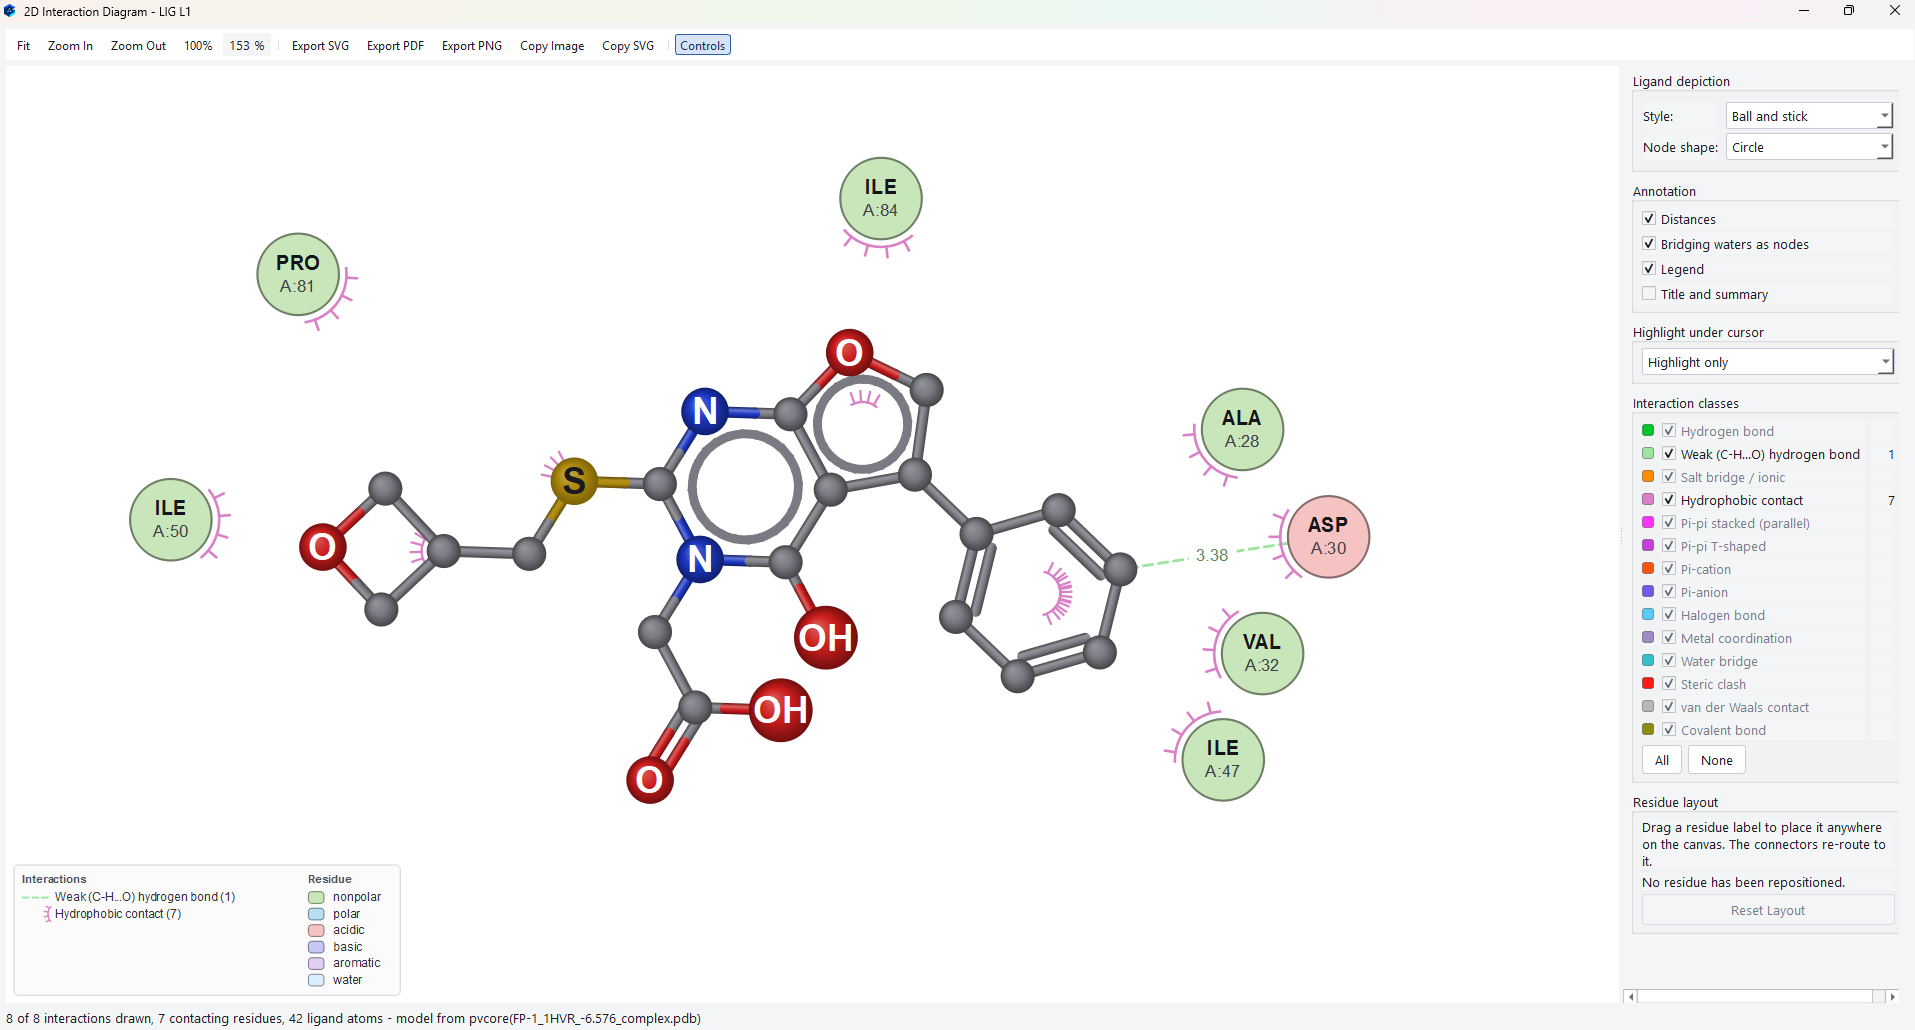
| Ligand depiction | How the ligand itself is drawn. Style offers Line, the compact choice for a small figure, Stick, which gives the bonds more weight, and Ball and stick, which makes each atom individually visible; Node shape sets the shape used for the residue markers. |
| Annotation | Whether to label distances, whether to draw bridging waters as nodes of their own, whether to include the legend, and whether to print a title and summary at the top. |
| Highlight under cursor | What happens when you hover over part of the diagram. |
| Interaction classes | One checkbox per class, each showing how many of that class are present. All and None set them together. |
| Residue layout | Drag any residue marker to move it; the connector re-routes itself. Reset Layout puts everything back. |
Exporting
| Command | When to use it |
|---|---|
| Export SVG | For anything that will be edited afterwards or printed at an unknown size. Vector output stays sharp at any magnification and can be recoloured in a drawing program. |
| Export PDF | For a figure going straight into a document at a fixed size. |
| Export PNG | For a slide, or for anywhere that will not accept vector art. |
| Copy Image and Copy SVG | Puts the figure on the clipboard so it can be pasted directly into a document. |
Fit, Zoom In and Zoom Out control the view, and the percentage beside them reports the current zoom. The zoom affects only what you see; exports are produced at their own resolution.
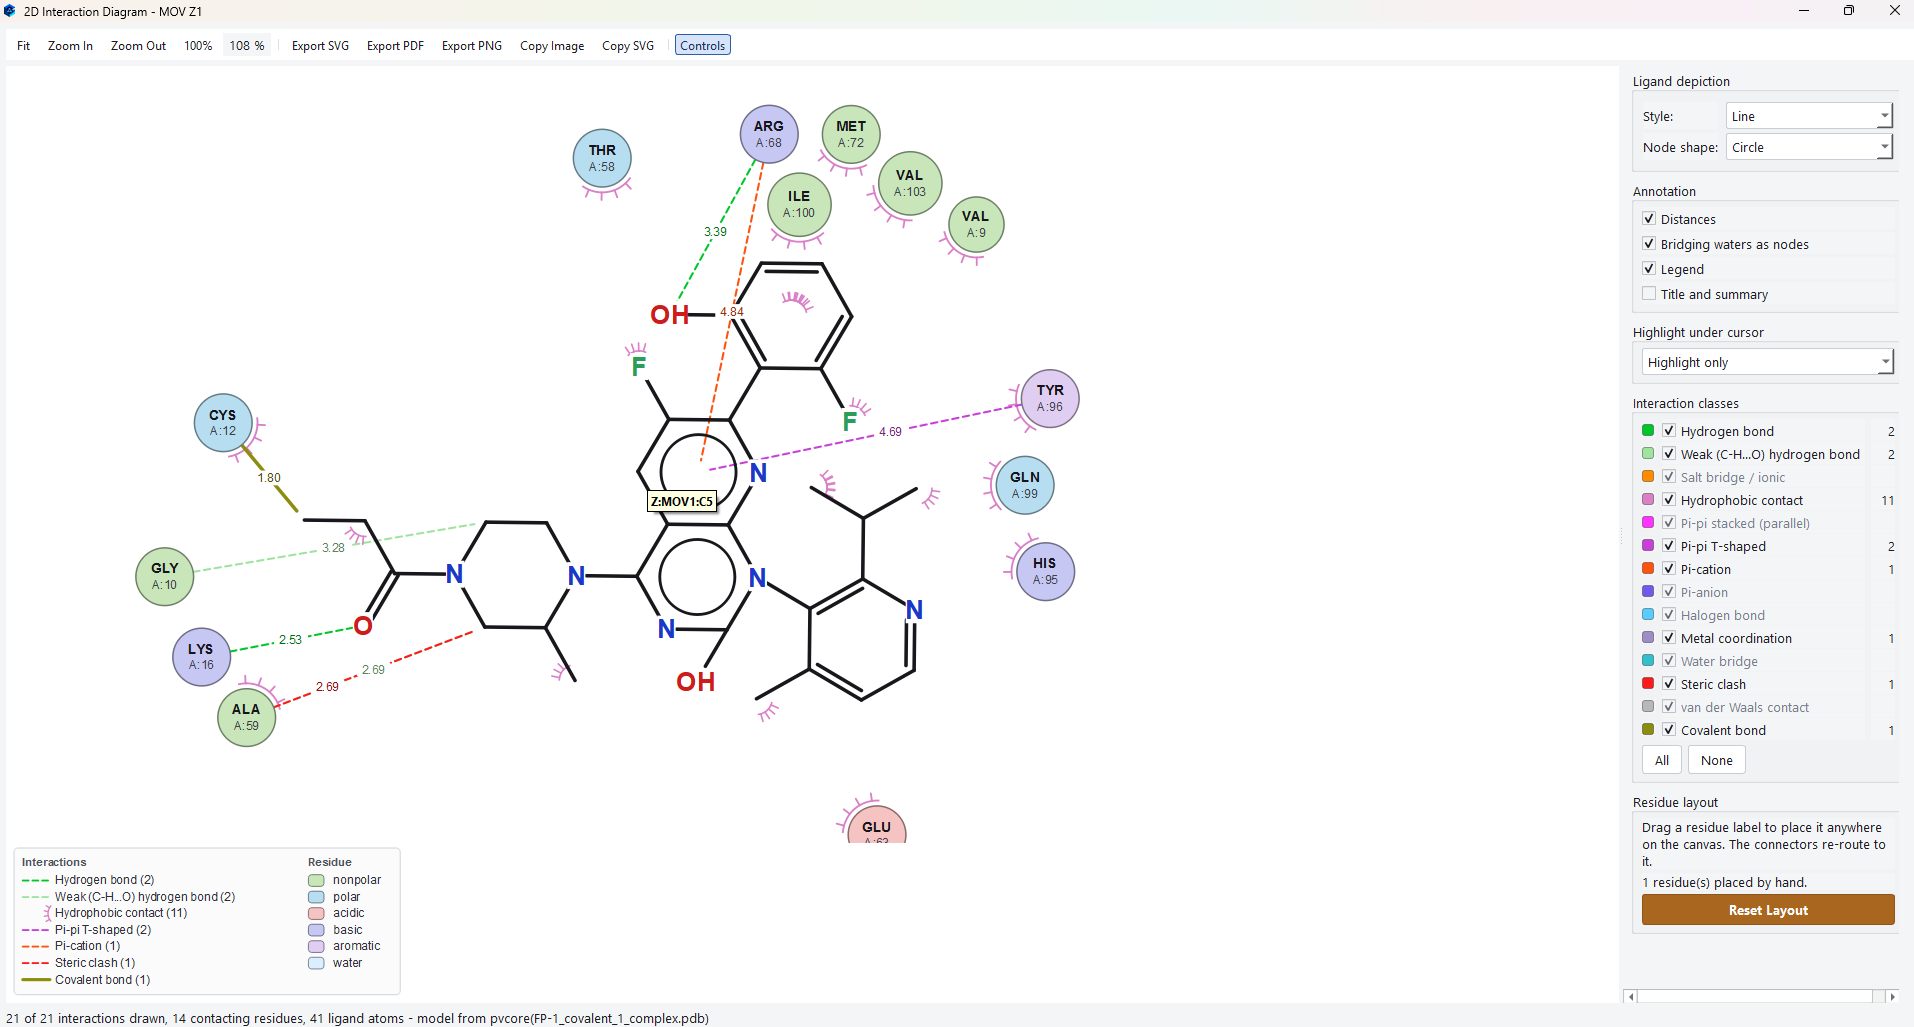
A covalent complex
In a covalent run the bond to the receptor is drawn as its own interaction class, so a figure of a covalent complex states plainly that the compound is bonded rather than merely bound.