GeinDock Suite
Prepare a protein, prepare the compounds you want to test, tell the software where on the protein to look, and read the poses it finds. This guide walks through every screen of the application, from the first structure you open to the interaction diagram you put in a paper.
GeinDock Suite is a molecular docking application for Windows and Linux, built by Geinforce Technology Private Limited. It covers the whole of a docking study in one place: cleaning and protonating a receptor, building three dimensional ligands from files, text or a drawing, defining the binding site and checking that it is sound, running one of four docking protocols, and then ranking, clustering and interpreting the poses that come back.
From version 3.2 the suite also includes GeinDFT, a companion application for density functional theory and molecular visualisation. It is installed in its own folder, runs on the same licence, and can be added at any time from Tools › Get GeinDFT. See Installing the software.
Start here
Install the software
Which installer to choose, what it places on disk, how to add GeinDFT, and how updates arrive.
Activate your licence
Sign in or enter your two keys, read what your licence covers, and renew when the period ends.
Take the tour
The menu bar, the toolbar, the Docking Panel and the dockable panels around the viewer.
Watch the video tutorials
Docking walkthroughs, from preparing a protein to reading the poses, played right here in the guide.
Meet the Co-Scientist
The built in research assistant that sets up, runs and explains a study on request.
Choose a docking mode
Ligand, flexible, constraint or covalent, with a short decision guide.
What the software does
Prepare a receptor
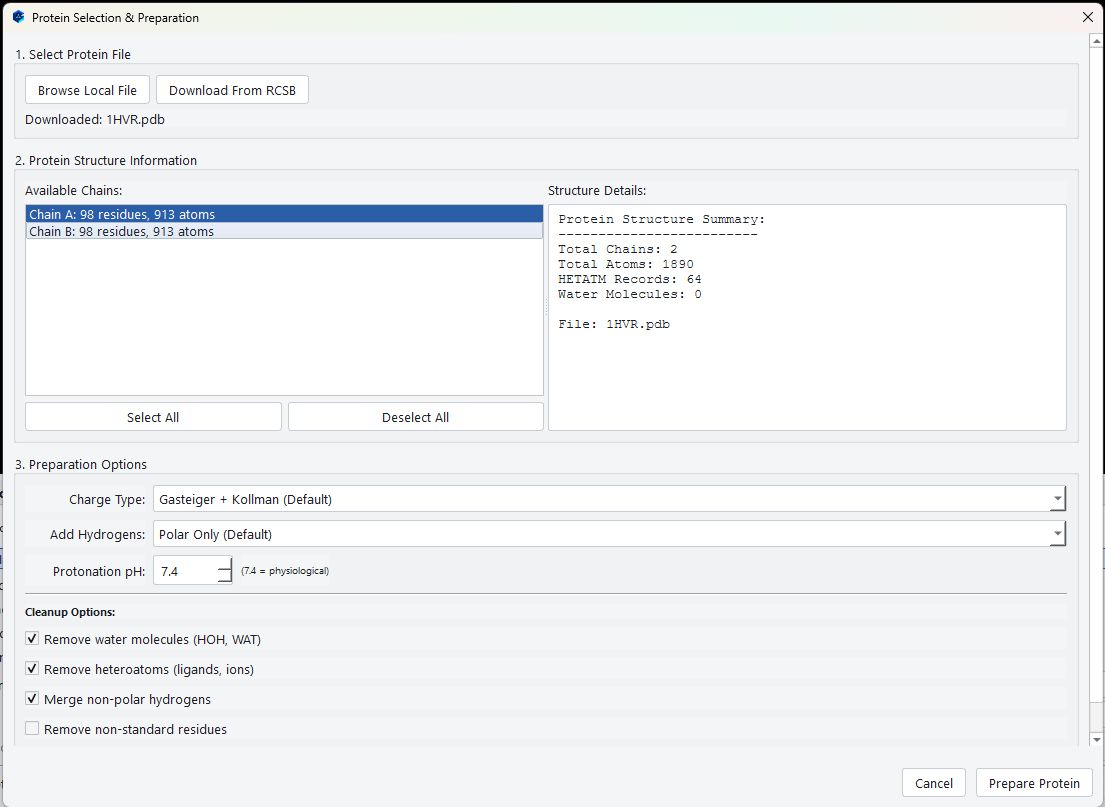
Open a structure from disk or fetch one from the Protein Data Bank by its four character identifier. The preparation dialog reports the chains, atom counts, heteroatoms and waters it found, then lets you choose which chains to keep, how to protonate the structure, and what to strip out before docking. Preparation runs inside the dialog, so the receptor is ready by the time the dialog closes.
Check the binding site before you trust it
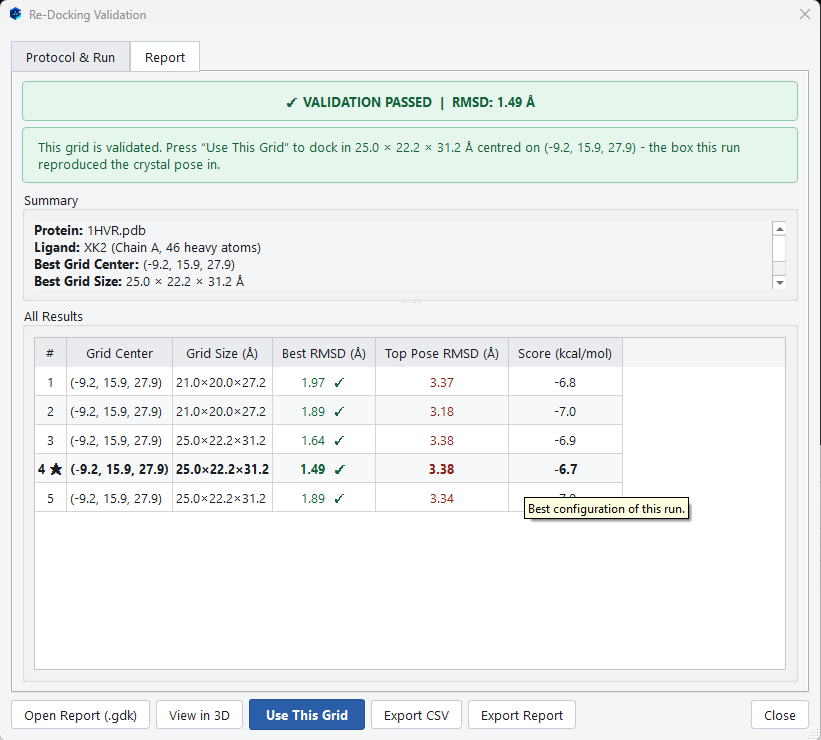
A search box in the wrong place guarantees a wrong answer, so the software can test the box rather than asking you to assume it is right. The redocking protocol takes the ligand that was crystallised with your structure, docks it back with several grid configurations, and measures how close it lands to where the crystal put it.
Read the poses in depth
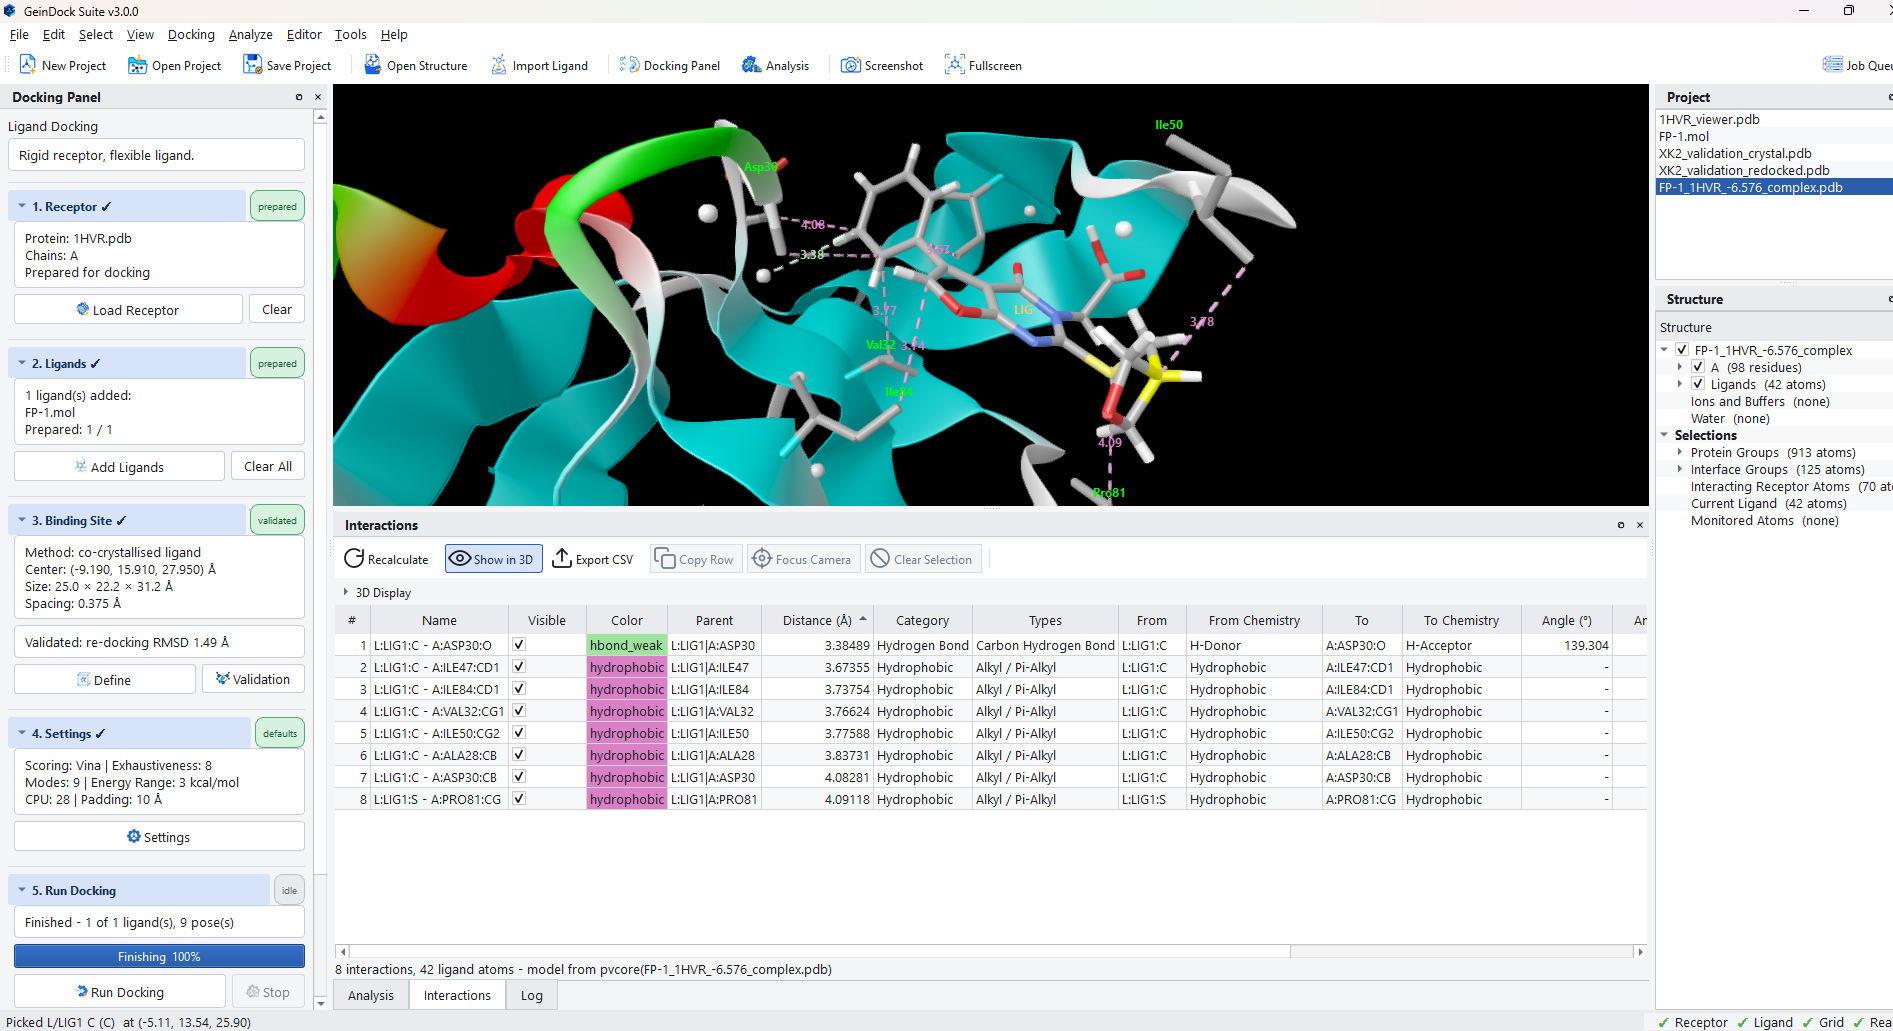
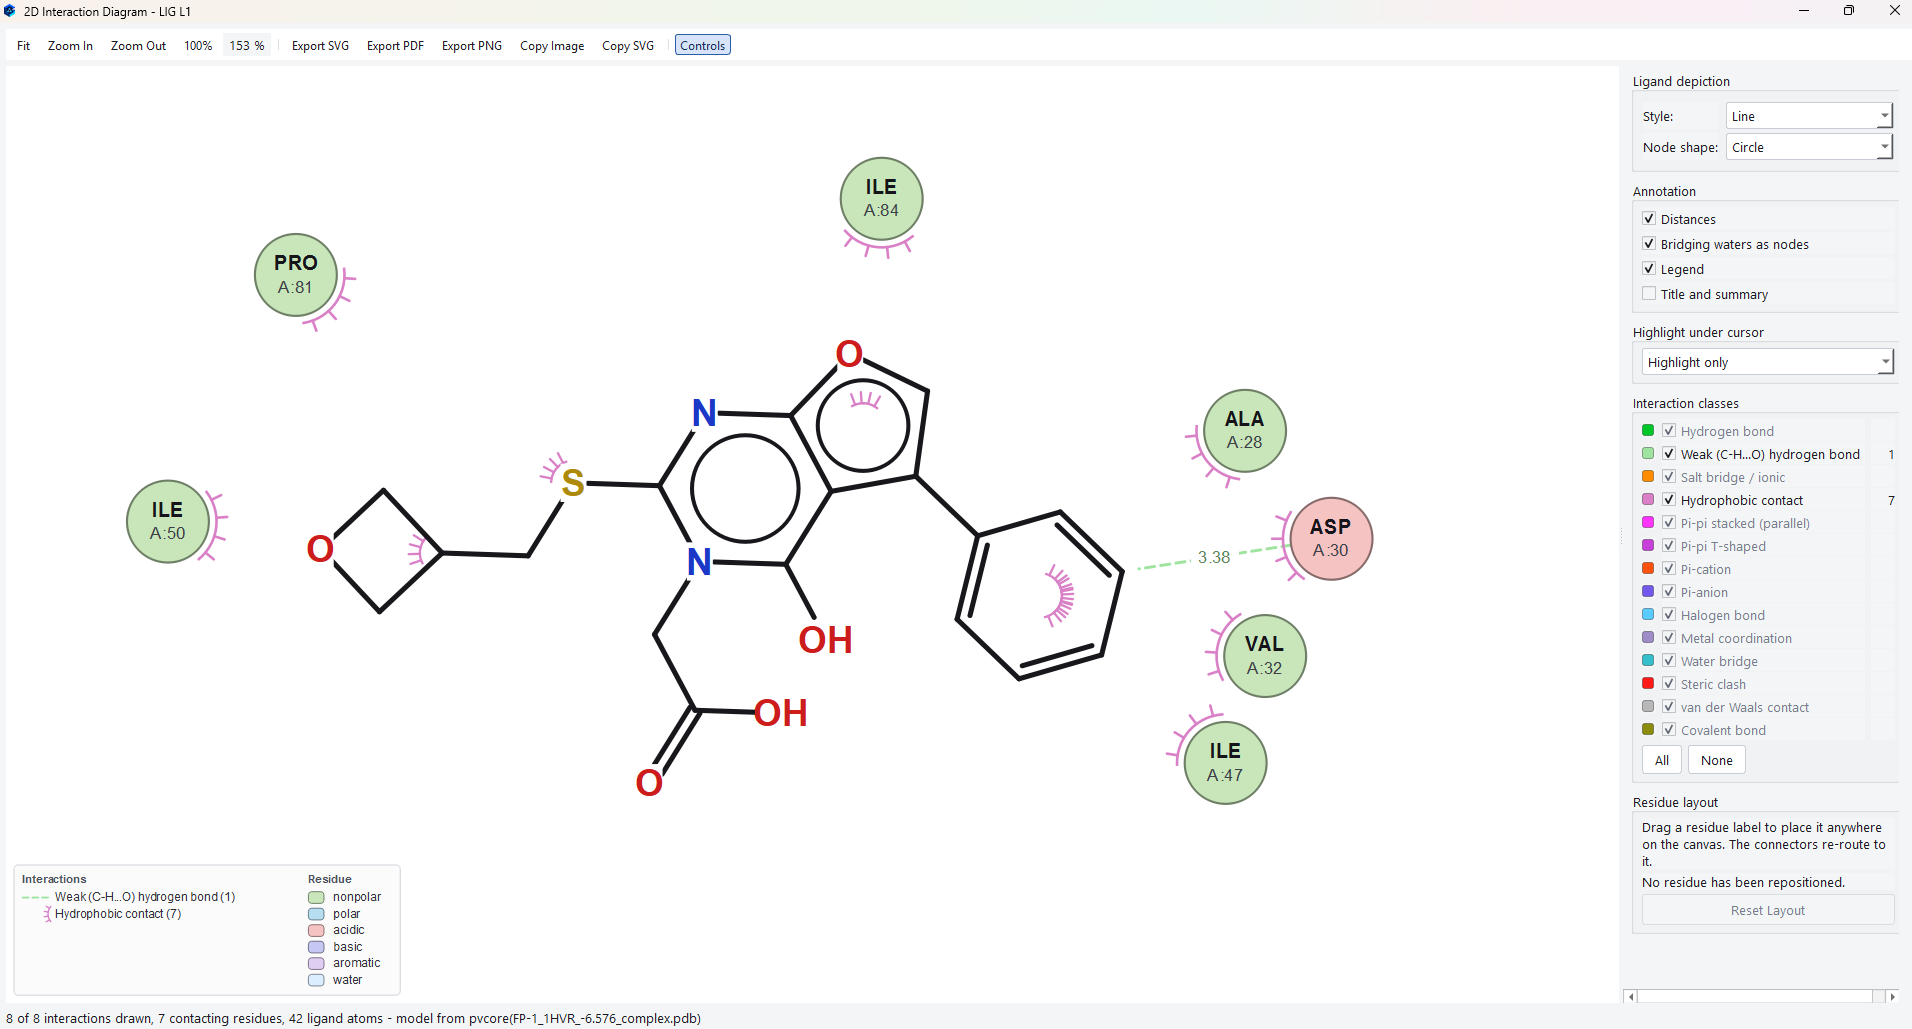
Poses arrive in a sortable table grouped by ligand. Selecting one draws it in the receptor, and the interaction tools break the contact down into hydrogen bonds, hydrophobic contacts, aromatic stacking, salt bridges, halogen bonds, metal coordination and more, in three dimensions, as a publication ready two dimensional diagram, and as a contact map.
Ask the Co-Scientist
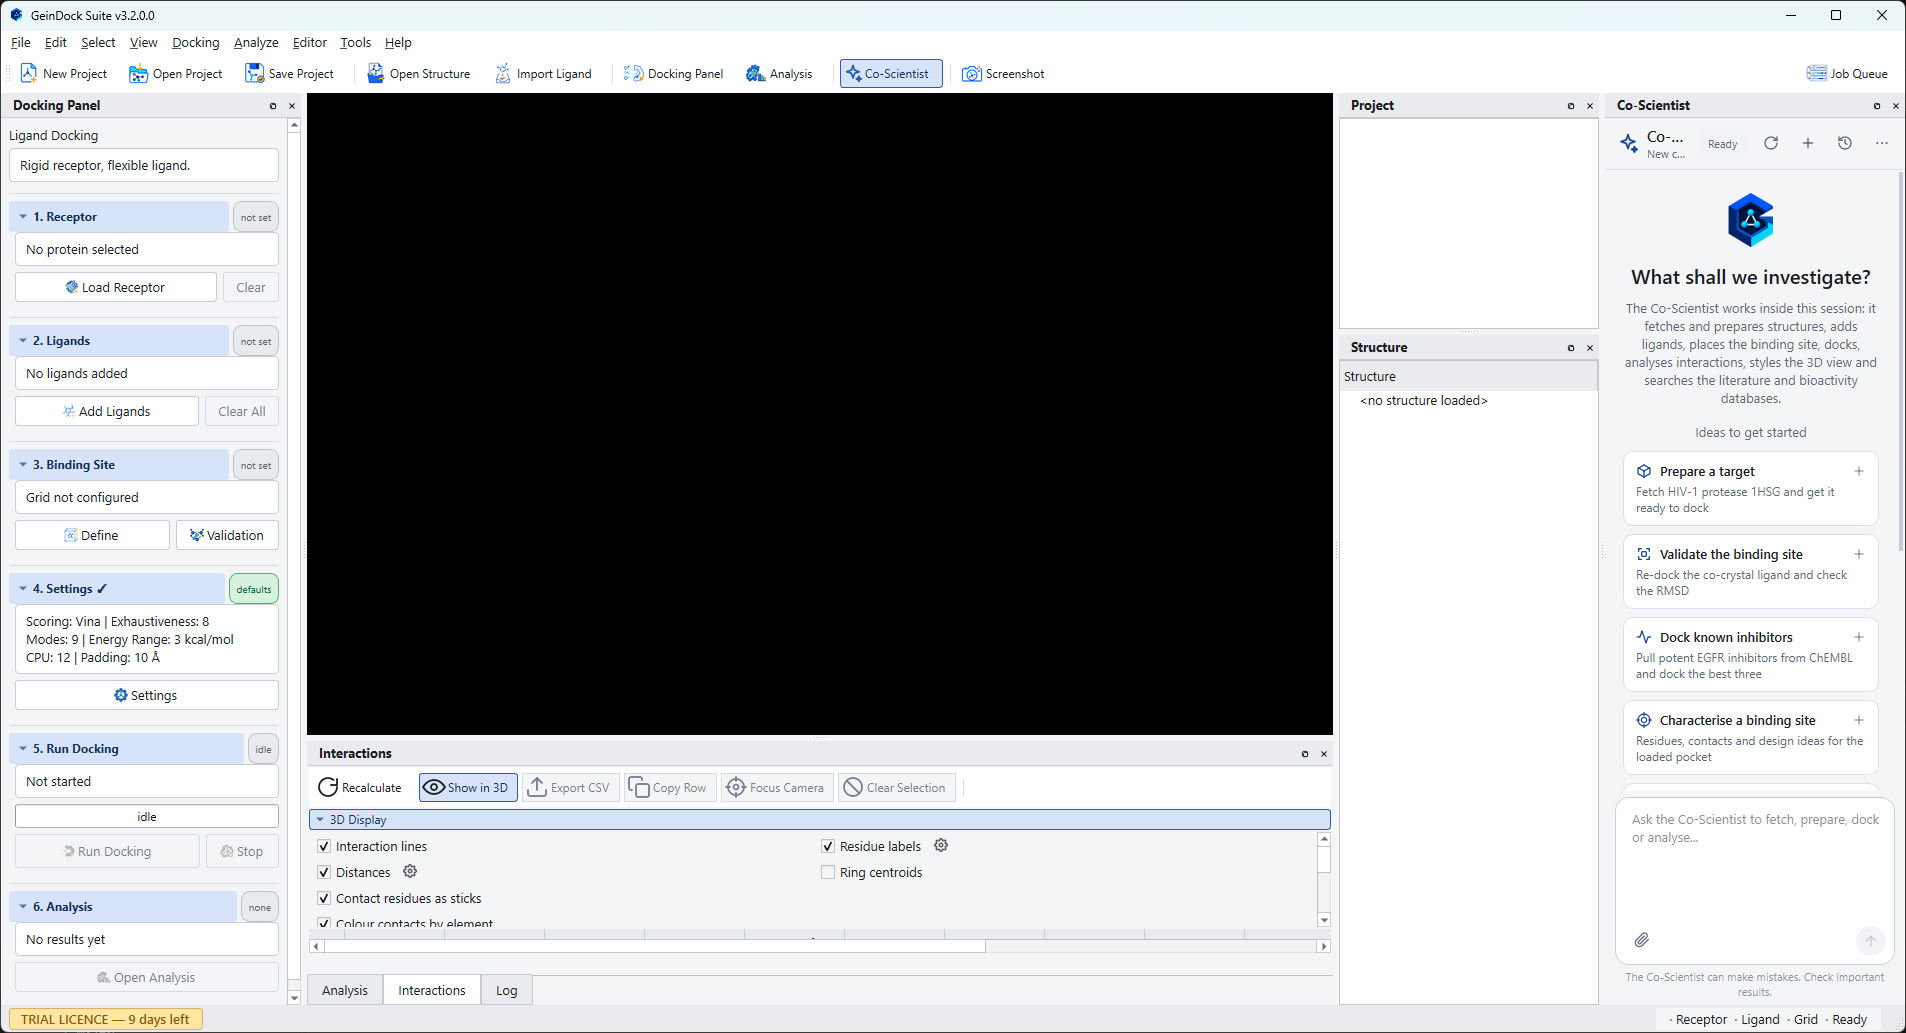
The GeinDock Co-Scientist is a research assistant in a panel at the right of the window. Describe what you want in ordinary language and it carries the steps out in the session you have open, using the same Docking Panel, viewer and result panels described in this guide, then explains what it found. It can also search public structure, bioactivity and literature databases and write a report of the study. It needs an activated licence and an internet connection, it asks before starting a long run or replacing your work, and its answers should be checked like any other. See Meet the Co-Scientist.
How this guide is organised
| If you want to | Read |
|---|---|
| Install the software and activate it | Installing and Activation |
| Understand what each screen is for | A tour of the software |
| Run your first docking job start to finish | The Docking Panel |
| Clean up a protein properly before docking | Step 1: Receptor |
| Get a good binding site box rather than a guess | Step 3: Binding site |
| Prove that the box can reproduce a known pose | Binding site validation |
| Decide between the four docking protocols | Which mode do I need? |
| Let receptor side chains move during docking | Flexible docking |
| Force poses to satisfy a geometric condition | Constraint docking |
| Dock a compound that bonds to the protein | Covalent docking |
| Judge whether a pose is worth believing | The pose table and Clustering poses |
| Produce a figure for a report or a paper | The 2D interaction diagram and The 3D viewer |
| Have the assistant set up, run or explain a study | Meet the Co-Scientist and Working with the Co-Scientist |
| Know what the assistant sends, and how much of it you may use | Conversations, allowance and privacy |
Conventions used in this guide
Commands you choose from the menu bar are written as a path, for example
Docking › Docking Mode › Covalent Docking. Keys are written like
Ctrl+D. Names of buttons and fields are written in bold exactly as they appear
in the application, and file names and paths are set in a monospaced face.
Every screenshot in this guide was taken from GeinDock Suite running on Windows: the Co-Scientist figures from v3.2, the rest from v3.0, where those screens have not changed since. Figures on your own screen will differ in the numbers they report, because the search is stochastic and the core count is read from your machine.
Getting help
If something in the software does not behave the way this guide describes, please tell us. Include the docking mode you were in and, if you can, the saved project file.
- Email: [email protected]
- Phone: +91 9960867592
- Web: geinforce.com