Interaction analysis
What contacts the software detects, how to read the table and the geometry it reports, and how to turn a pose into a figure.
A score tells you how well the software thinks a compound binds. The interaction analysis tells you why, and it is the part of a docking result that you can actually check against what you know about the target.
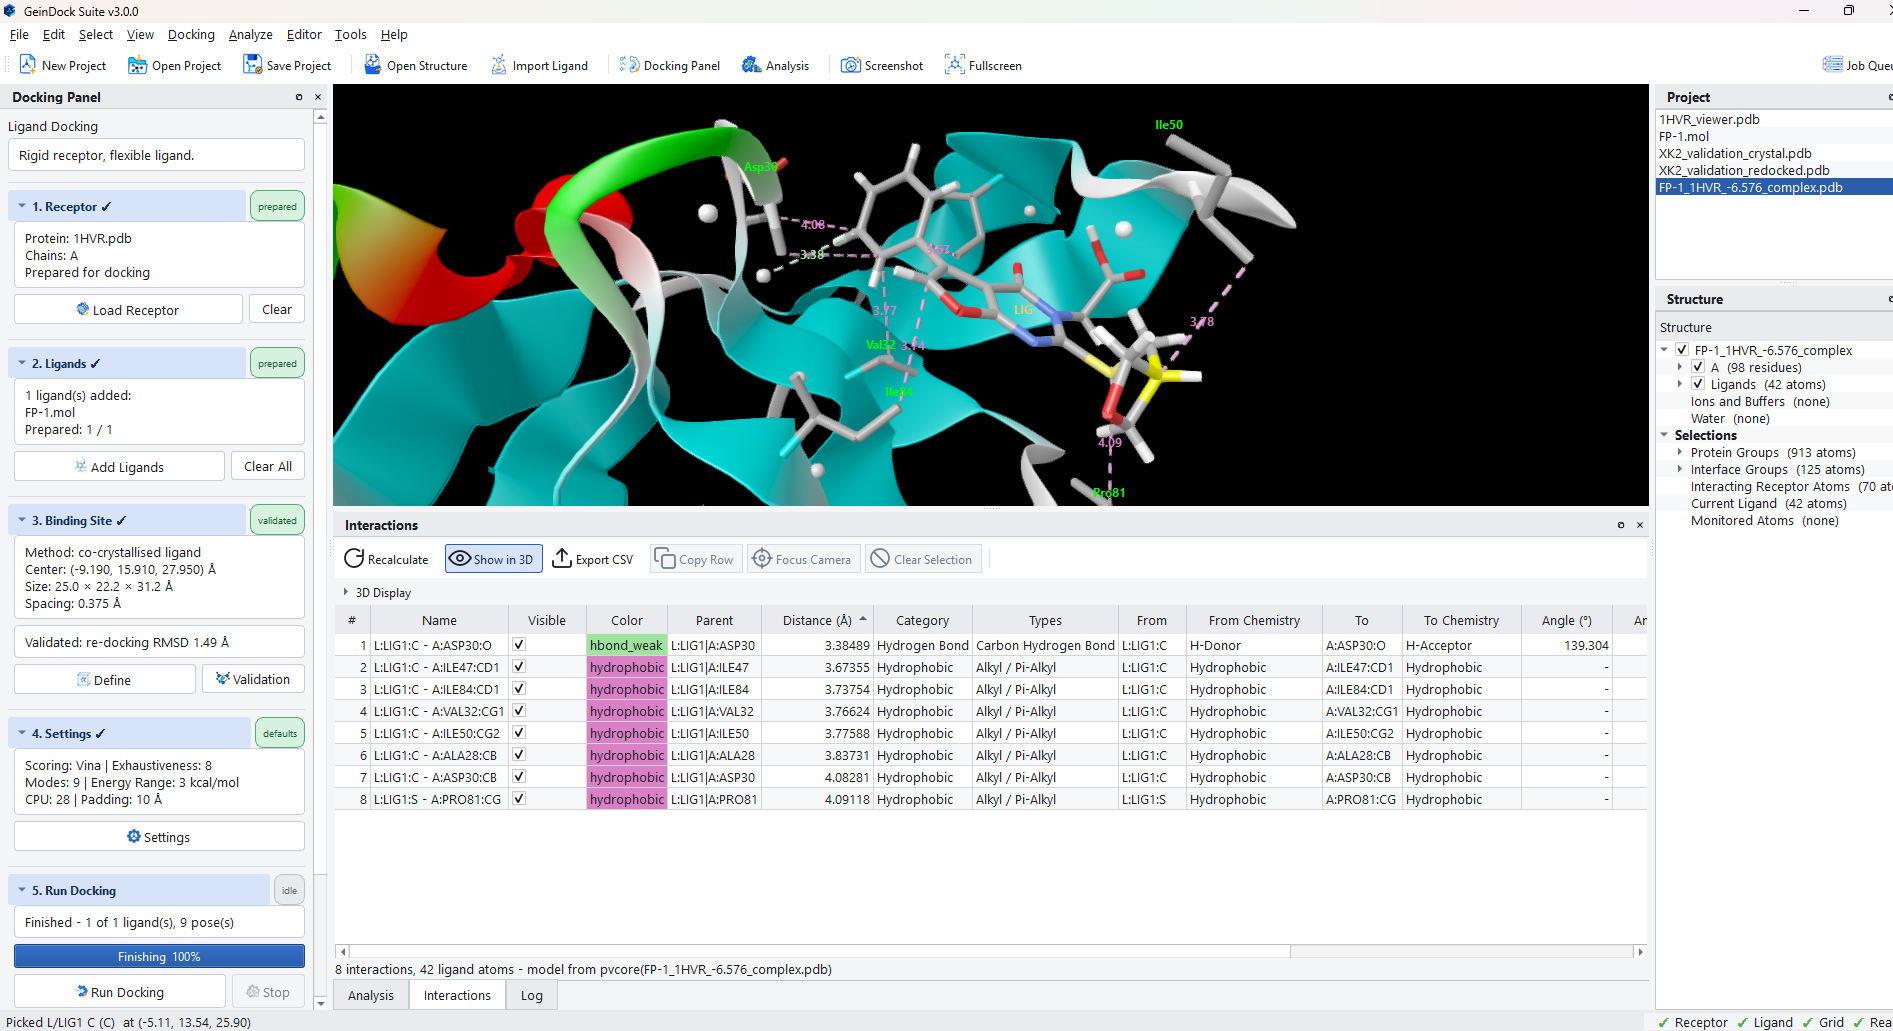
Select a pose in the pose table, then open the Interactions tab beside Analysis, or choose Analyze › Show Interactions.
What is detected
Fourteen classes of contact are recognised. Each has its own colour, its own line style in the viewer, and its own row colour in the table.
| Class | What it is |
|---|---|
| Hydrogen bond | A conventional donor to acceptor contact between nitrogen, oxygen or sulfur, with the donor and acceptor geometry reported. |
| Weak hydrogen bond | A carbon donor to an oxygen acceptor. Individually weak, but common and worth counting. |
| Salt bridge or ionic | An electrostatic contact between opposite formal charges. Often the single strongest interaction in a pose. |
| Hydrophobic contact | Non polar surfaces in contact. Usually the most numerous class, and collectively responsible for much of the affinity. |
| Pi-pi stacked | Two aromatic rings face to face. |
| Pi-pi T-shaped | Two aromatic rings edge to face. |
| Pi-cation | A cation over an aromatic face. |
| Pi-anion | An anion over an electron poor aromatic face. |
| Halogen bond | A halogen acting as an electron acceptor towards a donor. |
| Metal coordination | A ligand atom coordinating a bound metal ion. |
| Water bridge | A retained water mediating a contact between the receptor and the ligand. Only appears when waters were kept during preparation. |
| Steric clash | Atoms closer than they should physically be. A few small clashes are normal; several large ones mean the pose is strained. |
| van der Waals contact | Ordinary close packing without a more specific classification. |
| Covalent bond | The bond formed in a covalent run, reported as a contact in its own right. |
The table
| Column | What it tells you |
|---|---|
| # | The row number, which is also the label used in the viewer. |
| Name | The two atoms involved, written as chain, residue and atom on each side. |
| Visible | Whether this contact is drawn in the viewer. Untick to remove a distracting contact from a figure without recalculating anything. |
| Color | The class colour, which is also the colour of the line in the viewer. |
| Distance (Å) | The measured separation. Sorting by this brings the closest and therefore usually the most important contacts to the top. |
| Category and Types | The broad class and the specific subtype, for example hydrophobic and then alkyl or pi-alkyl. |
| From and To | The two partners, with the chemical role each plays, such as donor and acceptor. |
| Angle columns | The geometry of the contact. For a hydrogen bond, a donor angle well below about 120 degrees is a weak or poorly formed bond however short it looks. |
The toolbar above the table carries the actions.
| Button | What it does |
|---|---|
| Recalculate | Redetects the contacts. Use it after changing which pose is current, or after editing the structure. |
| Show in 3D | Draws the contacts in the viewer, and turns the option block underneath on. |
| Export CSV | Writes the full table, geometry included, to a file. |
| Copy Row | Puts the selected contact on the clipboard as text. |
| Focus Camera | Moves the viewer to look straight at the selected contact. |
| Clear Selection | Deselects, which also removes the highlight in the viewer. |
| The class drop-down | Reads All interactions until you pick a single class, and then the table lists only the contacts of that class. Use it to read through one kind of contact, such as the hydrogen bonds, in a long table. |
Controlling what the viewer draws
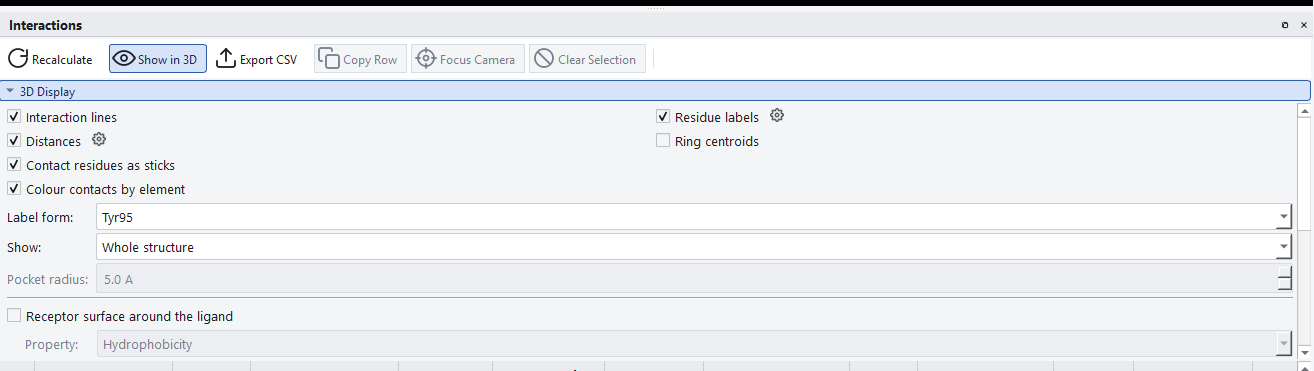
The 3D Display block controls the figure the viewer produces. It is collapsible, so once you have it the way you want it you can fold it away and give the table the whole panel.
| Option | What it does |
|---|---|
| Interaction lines | Draws the dashed lines between the contacting atoms. |
| Distances | Labels each line with its measured distance. The gear beside it opens the label typography settings. |
| Residue labels | Names each contacting residue in the viewer. |
| Ring centroids | Marks the centre of each aromatic ring, which is what the stacking interactions are actually measured to. |
| Contact residues as sticks | Draws the contacting residues as sticks so you can see the atoms involved rather than a cartoon ribbon. |
| Colour contacts by element | Colours those sticks by element rather than by the receptor colour scheme. |
| Label form | How residue labels are written, for example Tyr95. |
| Show | How much of the receptor to draw. Whole structure hides nothing. Binding pocket: every residue within the radius keeps each residue with an atom inside the radius in the field underneath, which shows the lining of the site whether or not a residue makes a contact. Interacting residues only: hide the rest keeps just the ligand and the residues that make a detected contact, which is the view to choose for a publication figure. |
| Pocket radius | How far from the ligand to keep receptor atoms in pocket mode. |
The receptor surface
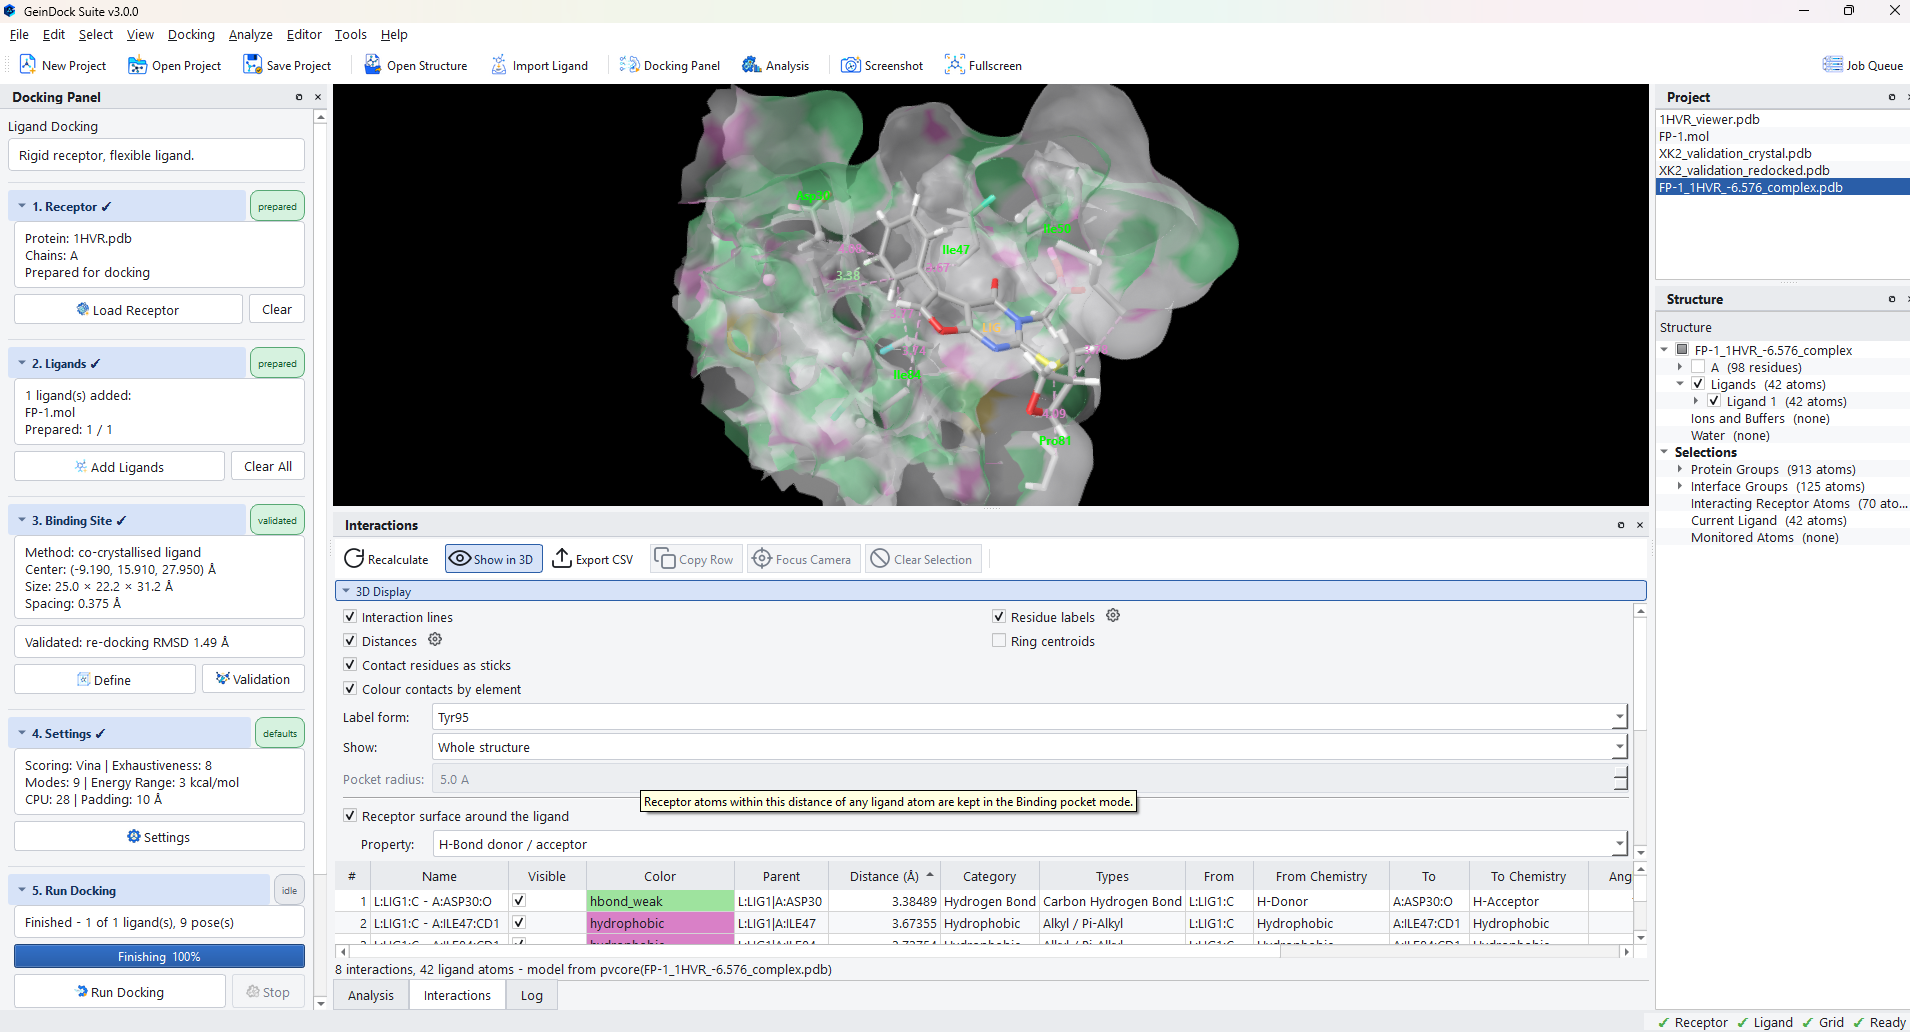
Receptor surface around the ligand draws a molecular surface over the pocket, coloured by a property you choose. This is the fastest way to see the shape of a site and how well the compound fills it.
| Control | What it does |
|---|---|
| Property | What the surface is coloured by: hydrophobicity, hydrogen bond donor and acceptor character, charge, and so on. |
| Surface | Which surface definition to compute. |
| Site radius | How much of the receptor around the ligand to cover. The plus and minus buttons beside the field expand and contract the surface by 1 Å a click, which is quicker than typing when you only want to see a little more of the pocket. |
| Opacity | How transparent the surface is, so that the pose stays visible through it. |
Filtering by class
Below the display options is a checkbox for each of the fourteen contact classes. Unticking a class removes it from the viewer and from the diagram without recalculating, which is how you produce a figure that shows the polar contacts alone.
Labels and typography
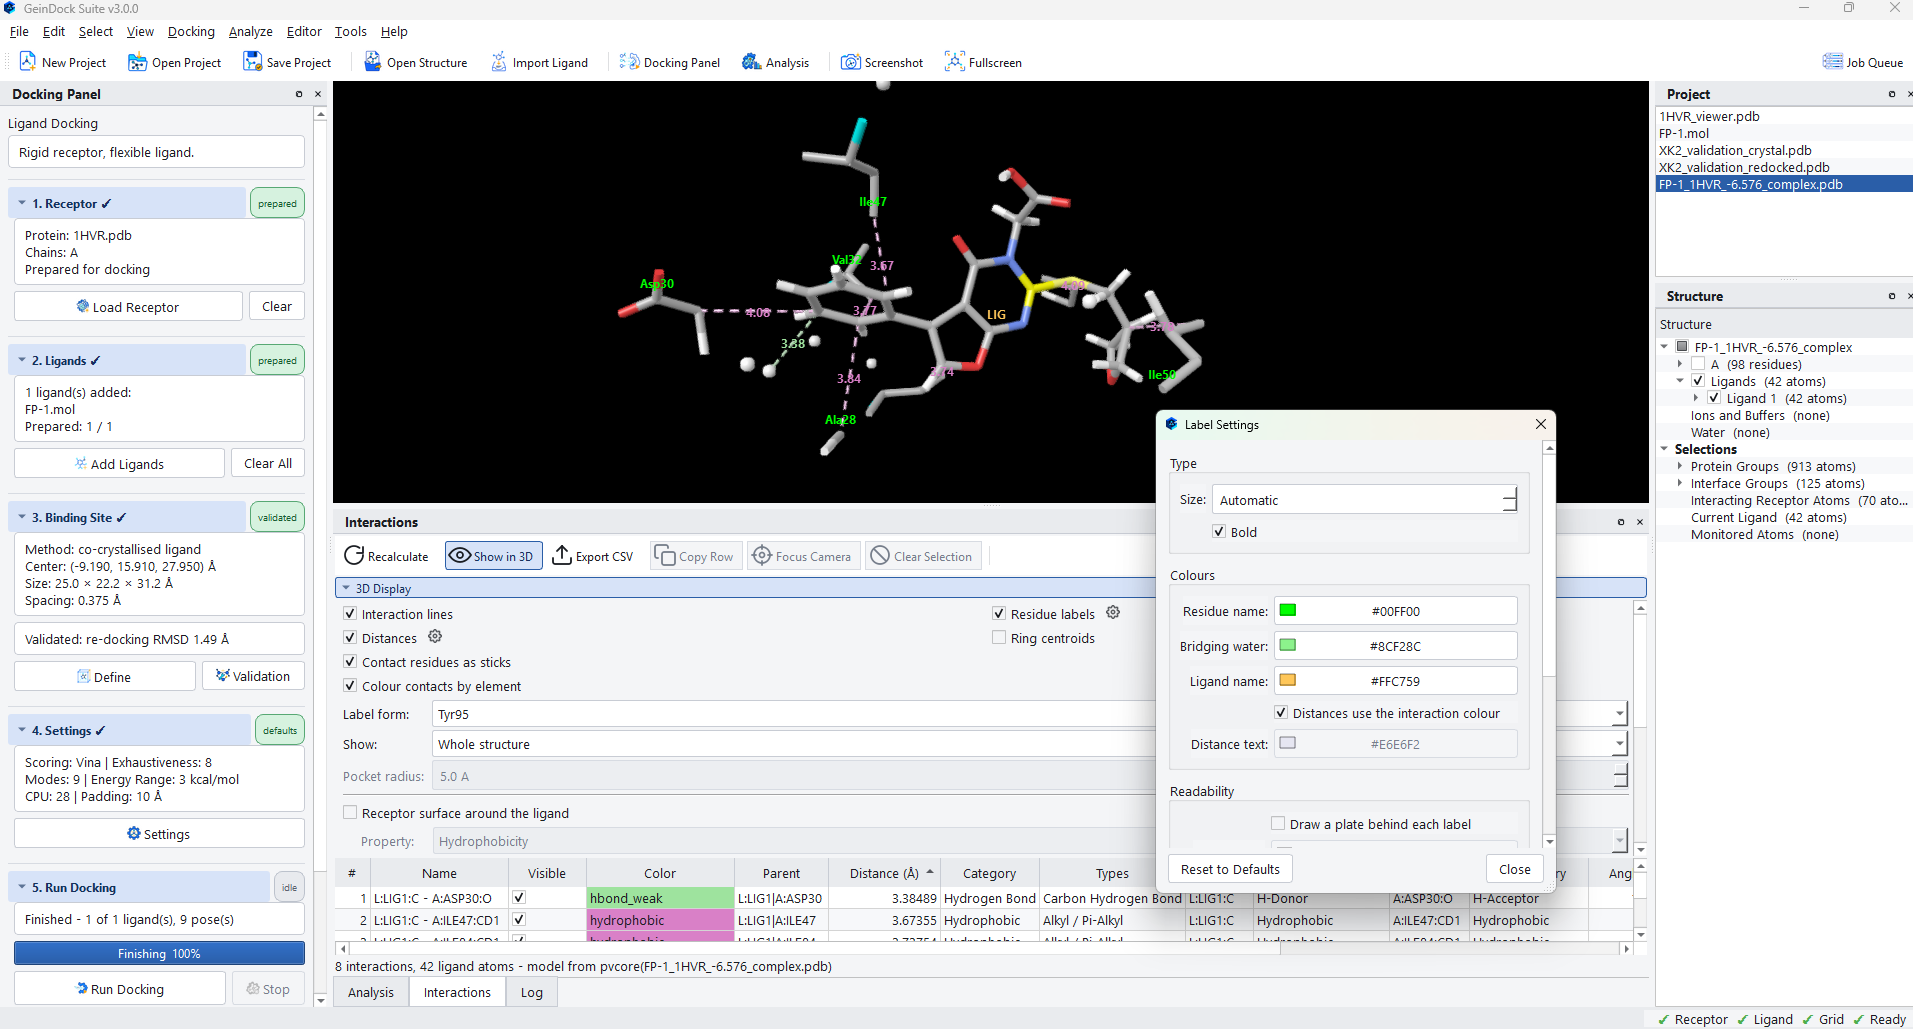
Every label the viewer draws is governed by one settings dialog, reachable from the gear beside Distances, from the gear beside Residue labels, or from Analyze › Label Settings.
| Setting | What it controls |
|---|---|
| Size | Label height. Automatic scales with the viewport, which is usually right; fix it when you are producing a figure at a specific size. |
| Bold | Weight. Worth turning on for a figure that will be reduced. |
| Residue name, Bridging water, Ligand name | The colour of each kind of label, so they can be told apart at a glance. |
| Distances use the interaction colour | Colours each distance label to match the contact it belongs to, which makes a dense figure much easier to read. |
| Draw a plate behind each label | Puts a solid backing behind the text. Turn this on when labels fall over a pale surface or a light background. |
The contact map
Analyze › Contact Map steps back from the ligand and shows the residue to residue contacts of the whole structure as a matrix. It answers a different question from the interaction list: not what the ligand touches, but how the protein is packed.
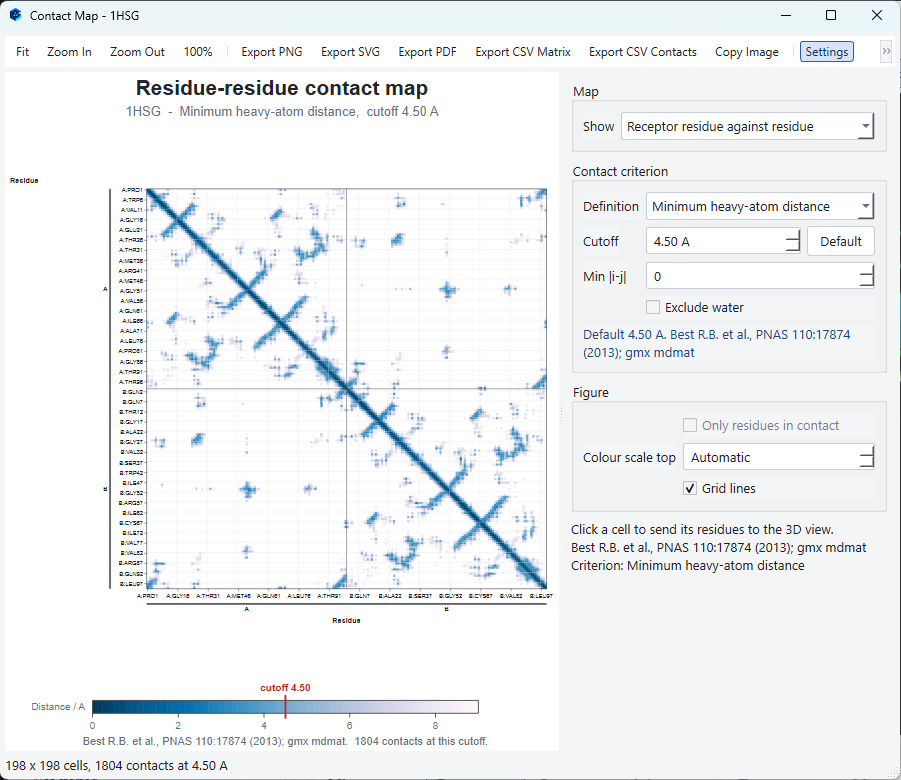
| Control | What it does |
|---|---|
| Show | Which contacts to map: the receptor against itself, or the receptor against the ligand. |
| Definition | What counts as a contact. The default measures between side chain beta carbons, using the alpha carbon for glycine. |
| Cutoff | The distance at which two residues count as in contact. The 8.0 Å default is the usual convention. |
| Min separation | Ignores residues that are close in sequence, which removes the trivial diagonal and leaves the interesting long range contacts. |
| Exclude water | Leaves retained waters out of the map. |
The map exports to PNG, SVG or PDF, and the underlying numbers export as either a full matrix or a list of contacts.