Clustering poses
Grouping the poses of a run by similarity, reading the dendrogram and the distance matrix, and using the cluster populations to judge whether the search converged.
A docking run reports several poses, and the scores alone do not tell you whether they are variations on one answer or several different answers. Clustering groups the poses by how similar they are, which turns that judgement into a number you can report.
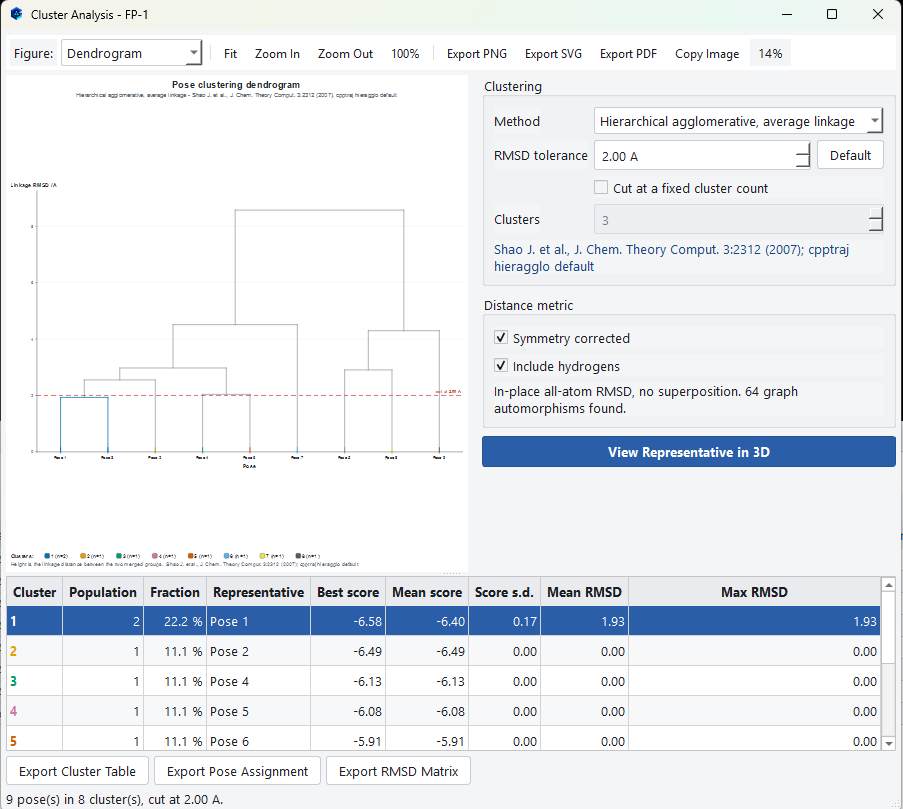
Select a ligand in the pose table, then choose Analyze › Cluster Analysis.
Why clustering matters
Two runs can produce the same top score and mean entirely different things.
| What the clustering shows | What it means |
|---|---|
| A few poses, most of them in one large cluster | The search converged. It found essentially one binding mode from several starting points, and the top pose is a fair representative of it. This is the result you want. |
| Many clusters, each holding one pose | The search did not converge. Every pose is its own answer, and the top one is the best of a set of unrelated guesses rather than the consensus of a search. Raise exhaustiveness, tighten the box, or check the ligand conformer before you rely on it. |
| Two well populated clusters with similar scores | There are two plausible binding modes and the scoring function cannot separate them. This is worth reporting rather than hiding, and it is often the most interesting result of the three. |
The controls
| Control | What it does |
|---|---|
| Method | How the tree is built. The default is hierarchical agglomerative clustering with average linkage, which is the standard choice for pose clustering and is the one the literature reference under the control describes. |
| RMSD tolerance | Where the tree is cut. Two poses closer than this count as the same binding mode. The 2.0 Å default is the usual convention for drug sized ligands. |
| Cut at a fixed cluster count | Cuts the tree to give exactly the number of clusters you name instead of cutting at a distance. Useful when you want to compare several ligands on the same footing. |
The distance metric
| Option | What it does |
|---|---|
| Symmetry corrected | Accounts for the ways a molecule can be mapped onto itself. Without this, a symmetric ligand flipped end for end looks completely different from itself, and the clustering reports two binding modes where there is one. Leave it on. |
| Include hydrogens | Whether hydrogens count towards the distance. Heavy atoms alone is the more common convention; including hydrogens makes the measure more sensitive to rotations of hydroxyl and amine groups. |
The cluster table
| Column | What it tells you |
|---|---|
| Cluster | The cluster number, coloured to match the dendrogram and the matrix. |
| Population | How many poses fell into it. This is the number that tells you whether the search converged. |
| Fraction | The population as a share of all poses. |
| Representative | The pose that best stands for the cluster, and the one to show in a figure. |
| Best score and Mean score | The scores within the cluster. A large gap between them means the cluster holds one good pose and several mediocre ones. |
| Score s.d. | How much the scores vary within the cluster. |
| Mean RMSD and Max RMSD | How tight the cluster is. A cluster whose maximum RMSD is close to your tolerance is only just a cluster. |
View Representative in 3D loads the representative pose into the viewer, which is the quickest way to see what a cluster actually is.
The RMSD matrix
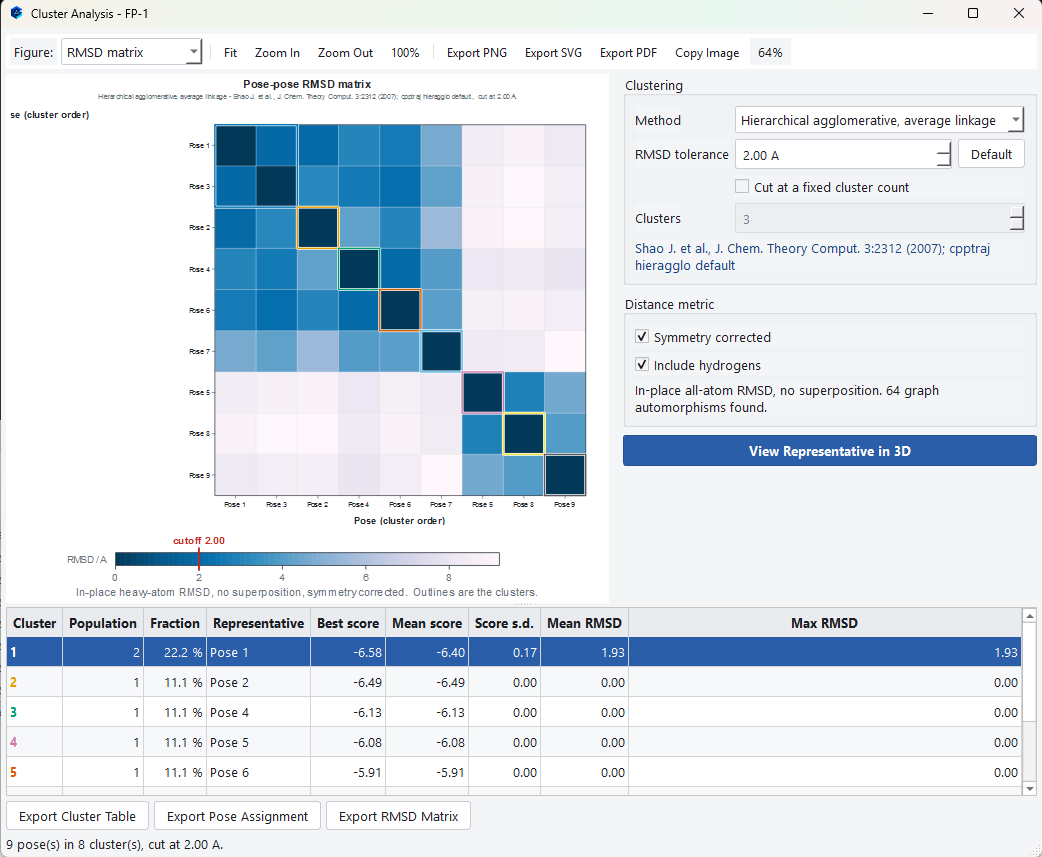
The Figure selector switches the picture between three figures: Dendrogram, Population vs score, which plots one marker per cluster by its best score and its population so that a binding mode that is both well populated and well scored stands out, and RMSD matrix, a pose to pose distance matrix. The matrix shows every pairwise distance at once, with the clusters outlined, and it is often easier to read than the tree when there are many poses.
Exporting
The figure exports to PNG, SVG or PDF, or copies to the clipboard. Three further exports give you the numbers.
| Export | What it contains |
|---|---|
| Export Cluster Table | The table as shown, one row per cluster. |
| Export Pose Assignment | One row per pose, naming the cluster it fell into. This is the file to join against your pose table. |
| Export RMSD Matrix | The full pairwise distance matrix, for your own analysis. |