The 3-D viewer and playback
Looking at the structure and the trajectory: representations, presets, periodic boundaries, measurements, images and movie frames.
The viewer draws structures and trajectories with the program's own renderer. It opens a finished job with its trajectory in one step, plays the run at any speed, follows the binding site frame by frame, measures distances and angles, and writes images and movie frames for publication. Every figure of a results package says what happened; the viewer shows it, and it is the place to check any feature of a figure that you cannot explain.
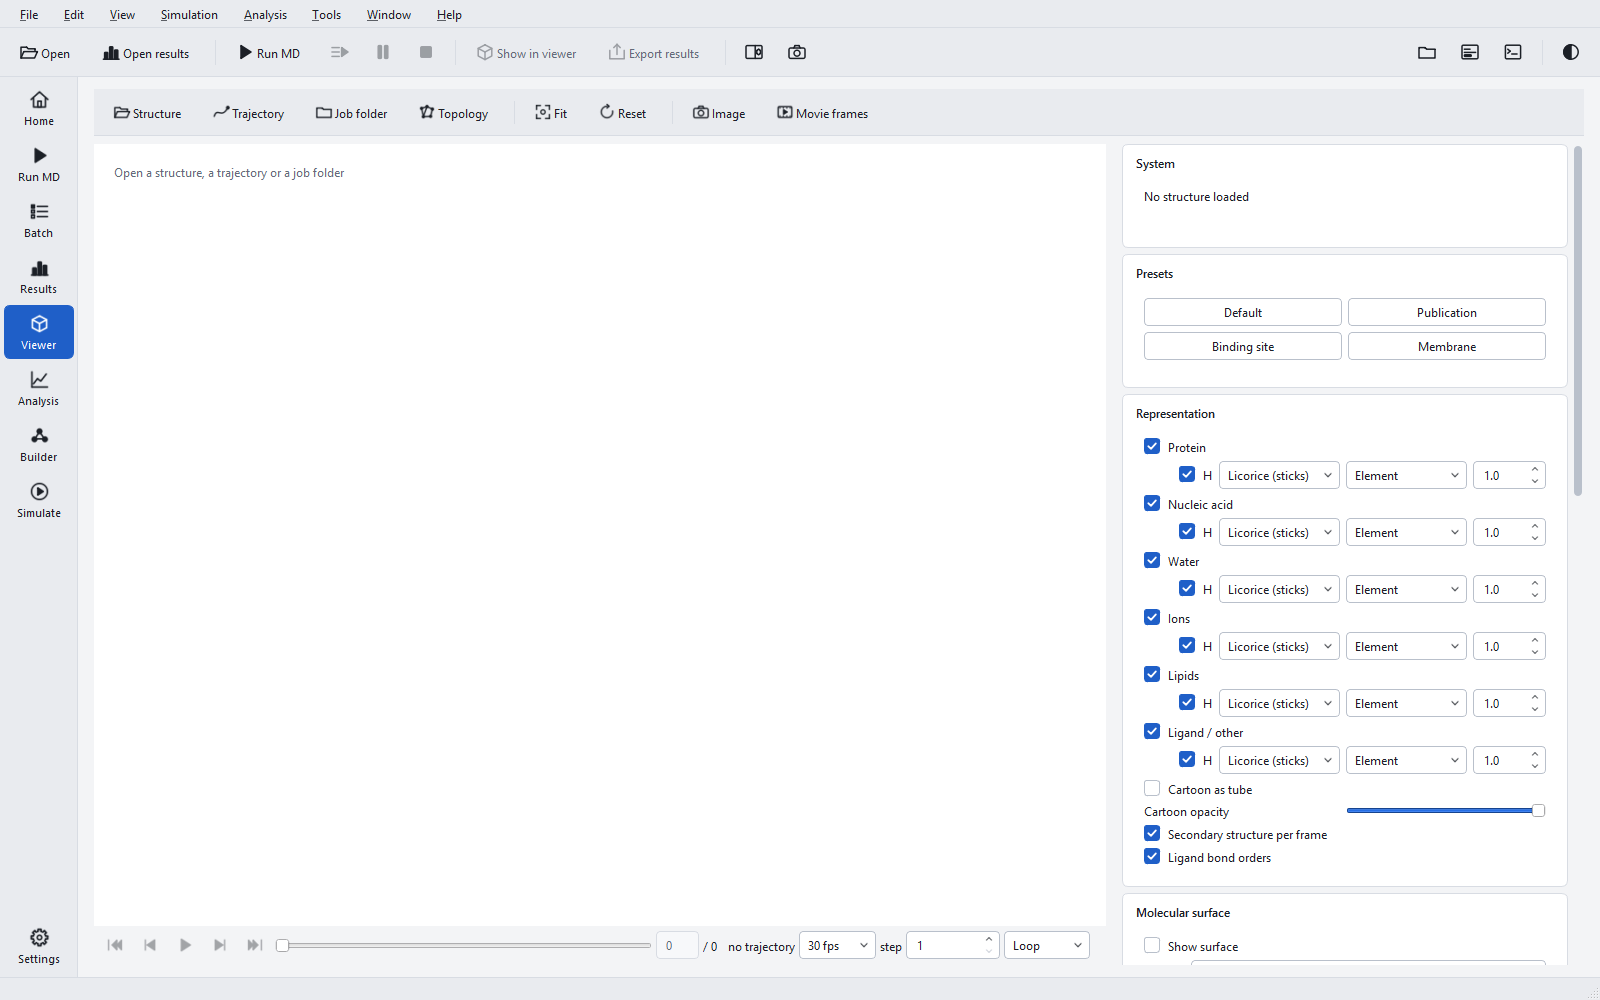
Opening something to look at
| Button | Opens | Notes |
|---|---|---|
| Structure | A .gro, .pdb, .ent or .pqr file. | The starting point for anything that is not a job. |
| Trajectory | An .xtc or .trr trajectory (also a multi-model .gro or .pdb). | The structure must be open first, with the same number of atoms; a matching structure and topology next to the trajectory are found automatically. |
| Job folder | System, topology and production trajectory of a job or run folder, and the bond orders of the ligand. | The quickest route for a finished job; with several trajectories you choose one. |
| Topology | Bonds, masses and molecules from a .top file. | Exact bonds instead of bonds guessed from distances. |
From the Results page, Show in viewer does the same as Job folder for the open job and its first replica. The Viewer page itself is F3.
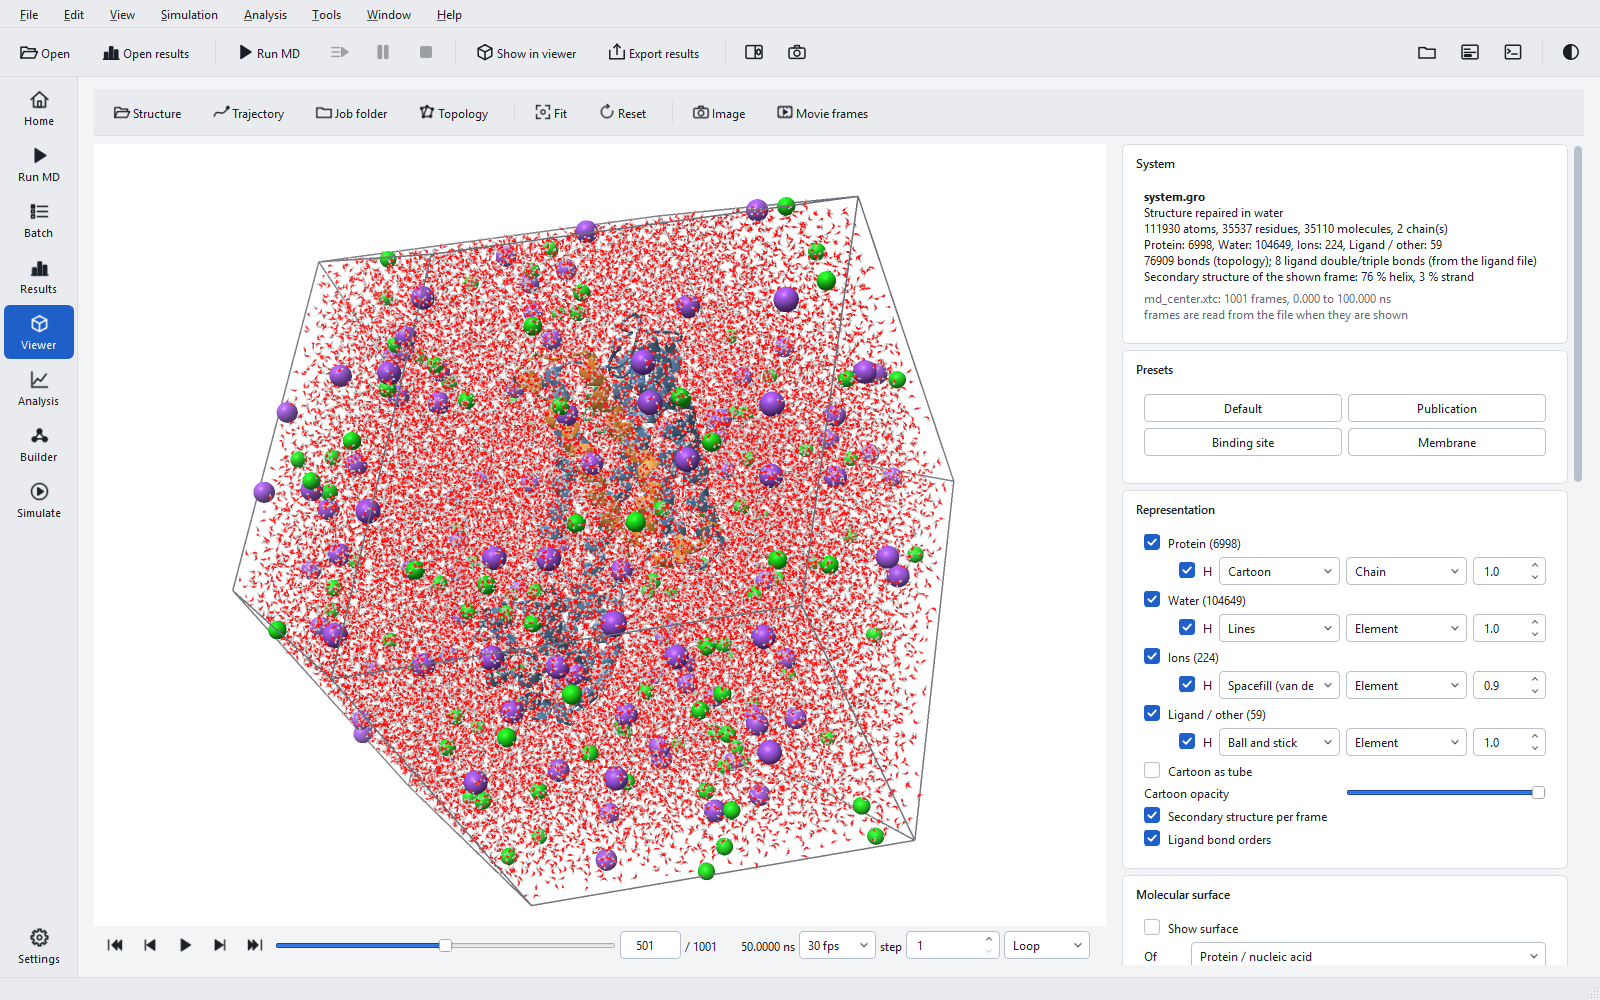
Moving around
| Action | Mouse or key |
|---|---|
| Rotate | Drag with the left button; arrow keys |
| Roll about the viewing axis | Shift and drag with the left button |
| Move (pan) | Drag with the right or middle button, or Ctrl and drag |
| Zoom | Mouse wheel; + and − |
| Centre on an atom | Double-click the atom |
| Fit the view to the visible atoms | Fit or F |
| Reset orientation and fit | Reset or R |
| Orthographic or perspective | O |
| Pick an atom | Click it (what a click does is set under Labels and measurements) |
Presets
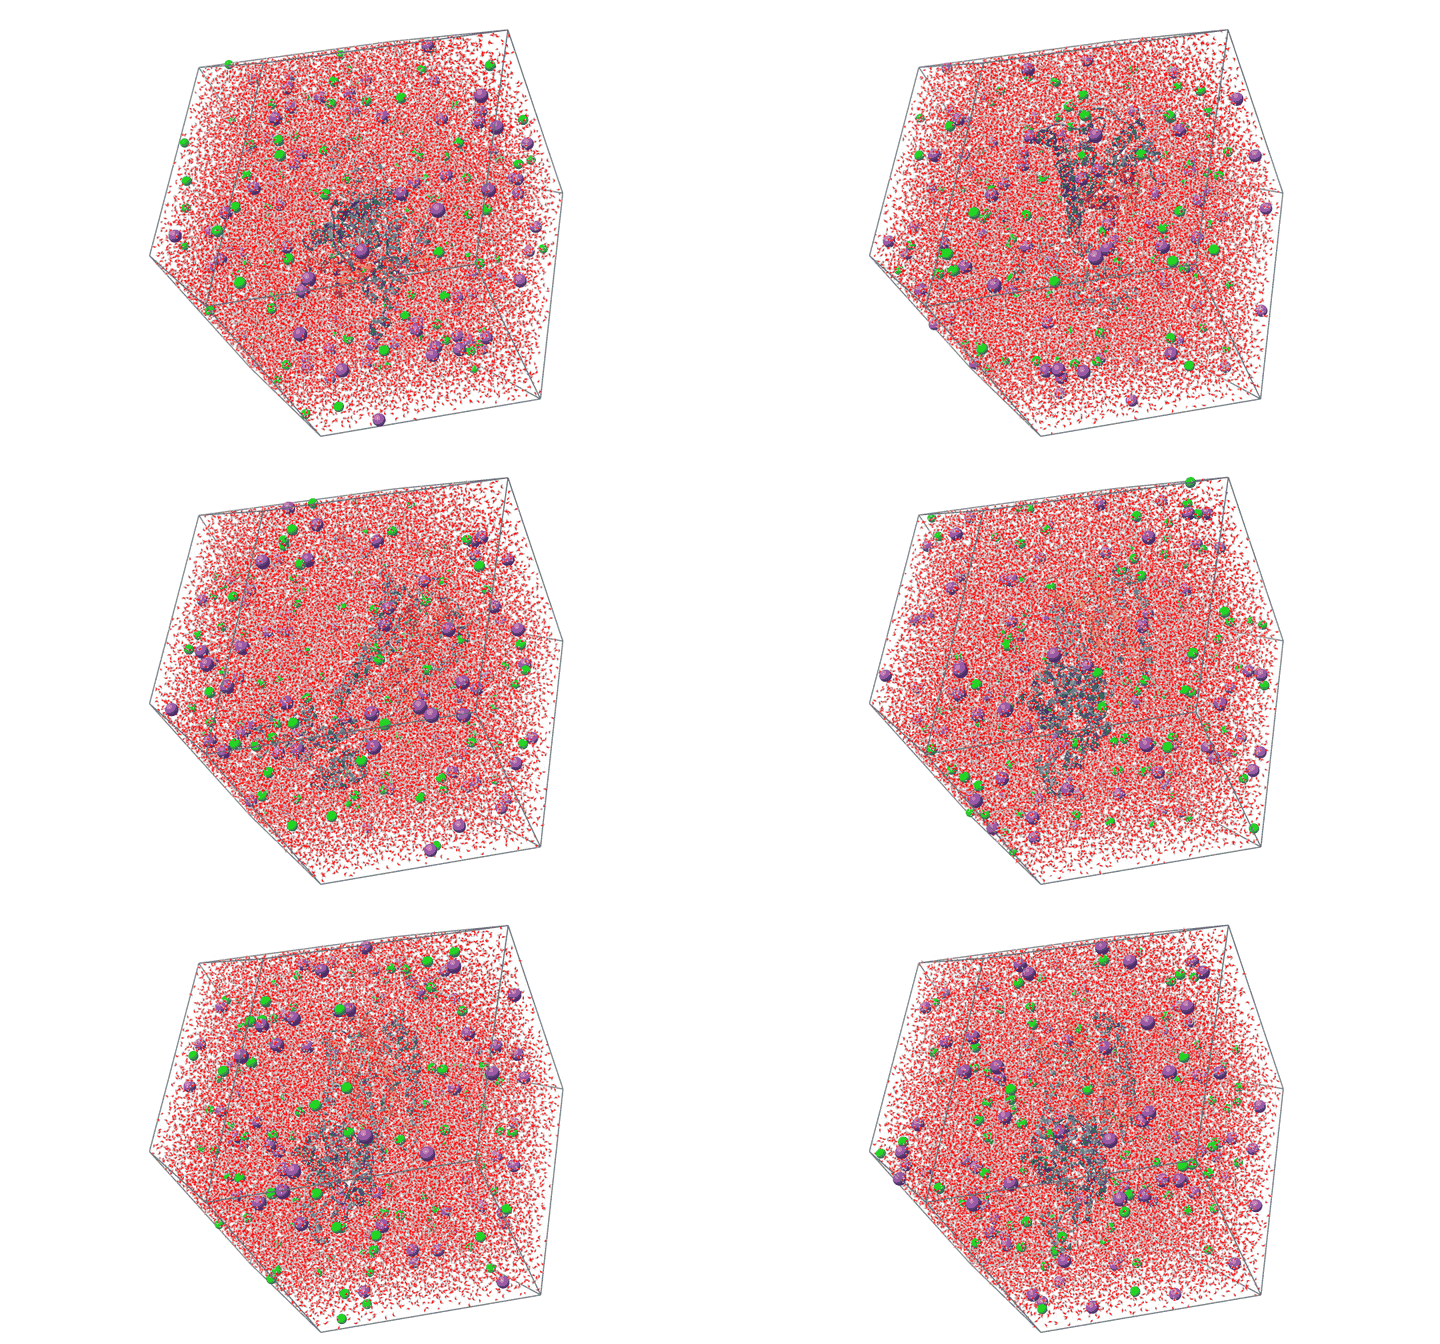
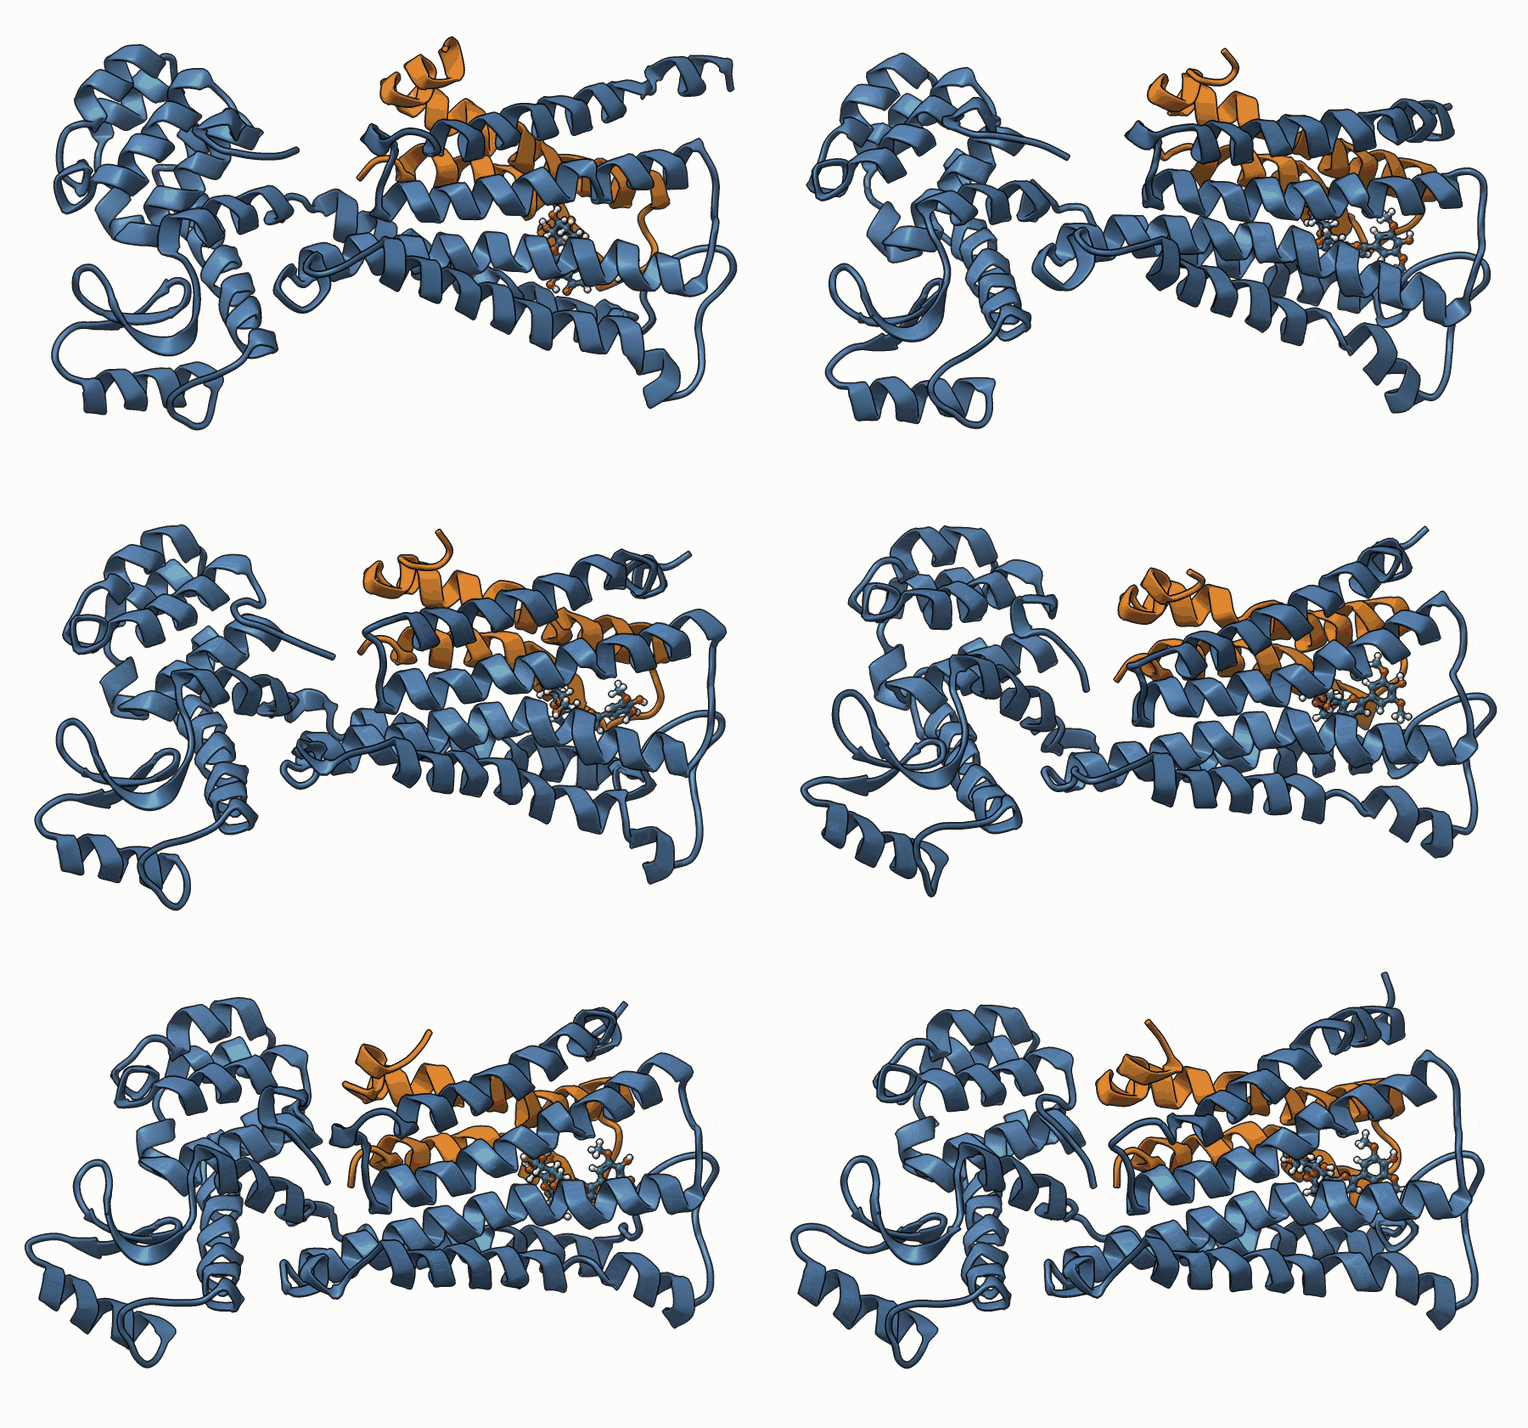
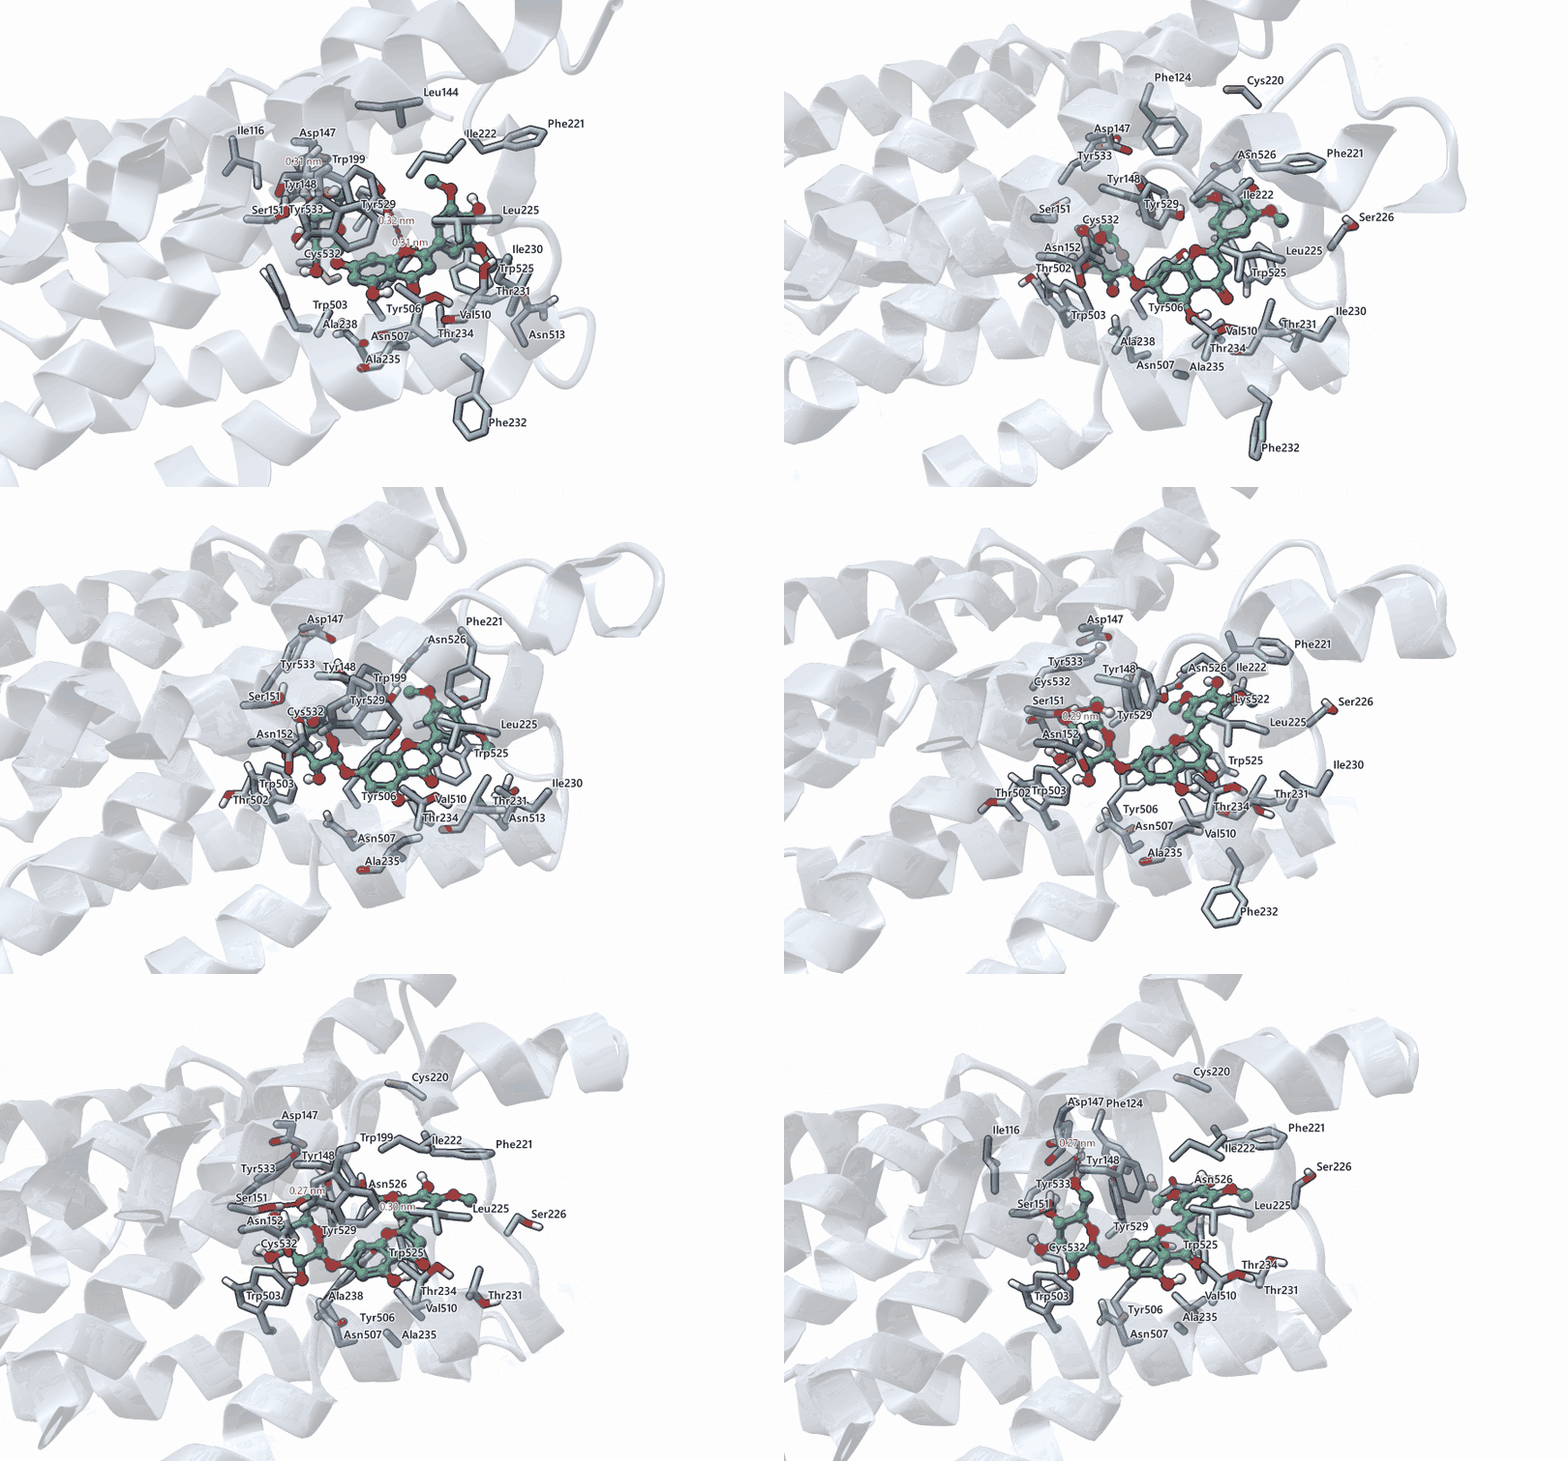
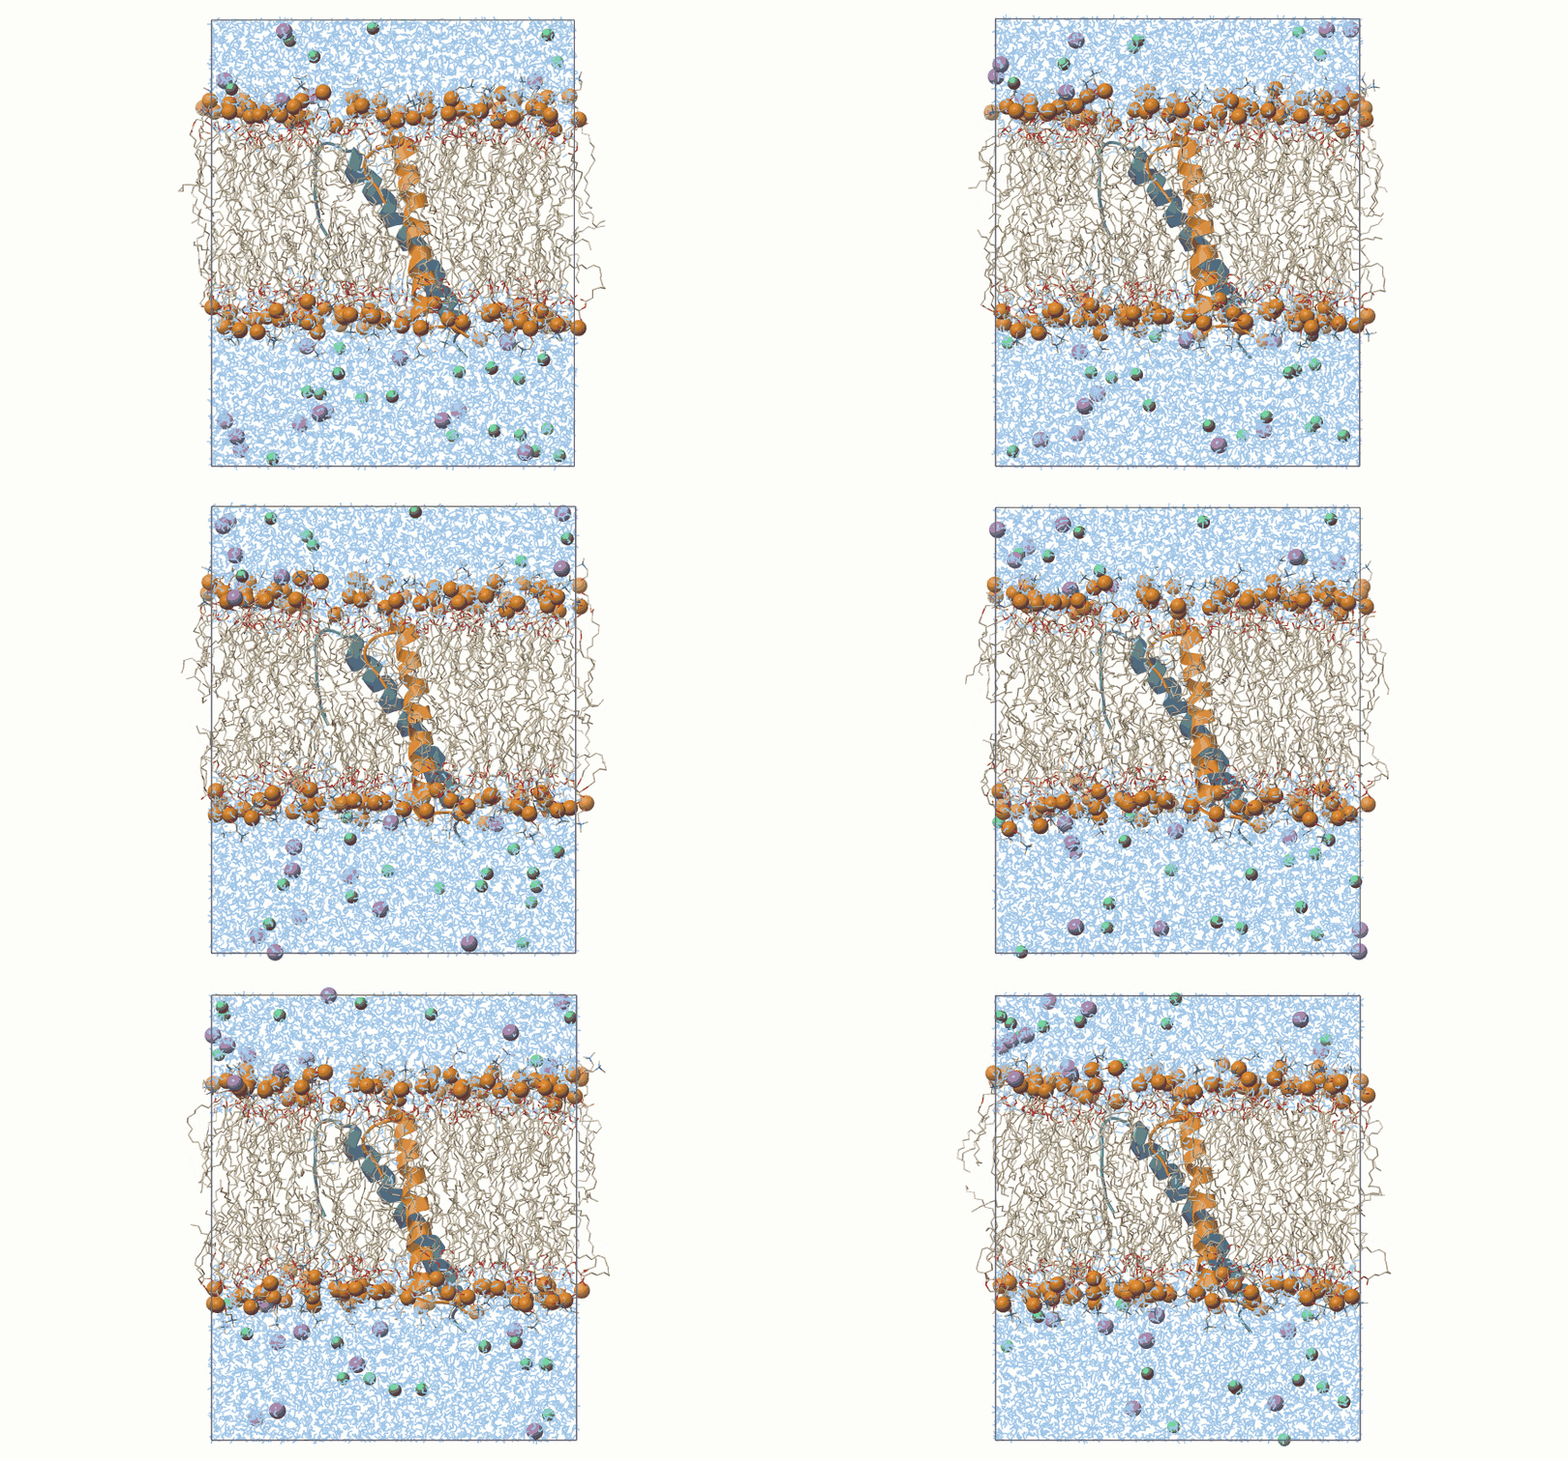
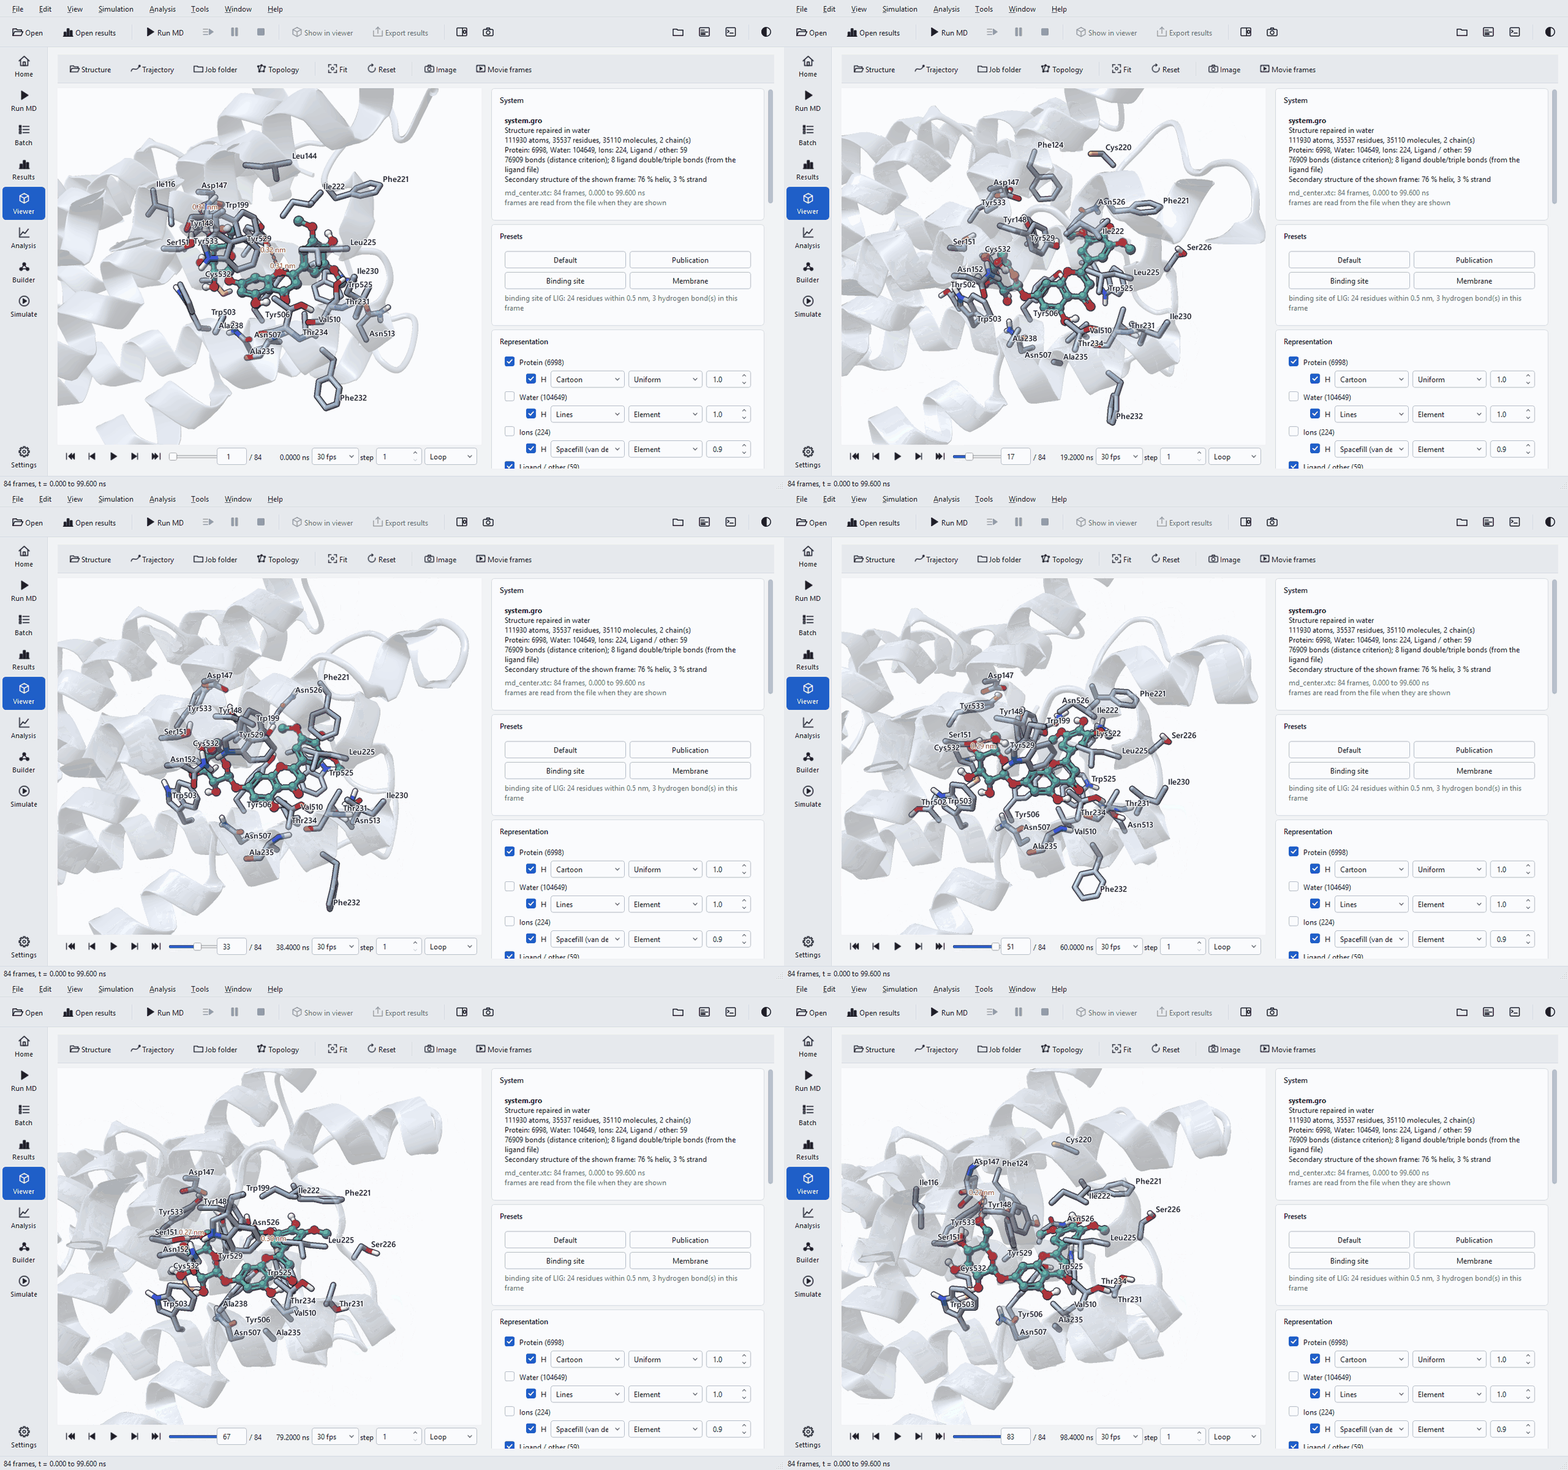
A preset sets the representation, colours, display options and camera for a common purpose in one click. It is applied once; everything it sets can be changed afterwards. The animations below are real trajectory frames drawn by the viewer.
| Preset | What it shows | Use it for |
|---|---|---|
| Default | Everything: cartoon by chain, ligand ball and stick, ions as spheres, water as lines, box drawn, perspective view. | Checking the whole system: solvation, ions, the box and whether anything left it. |
| Publication | Protein and ligand only, outlines, ambient occlusion, weaker depth cue, white background, orthographic camera. | Figures of the complex. |
| Binding site | The ligand with green carbons and polar hydrogens, the residues within 0.5 nm as labelled sticks, protein-ligand hydrogen bonds with distances, everything in front of the site clipped away; the camera looks into the pocket from its most open side. | Following the binding mode during playback and relating it to the interaction diagram. |
| Membrane | A side view with the membrane normal pointing up, lipids as thin sticks with phosphorus atoms as spheres, cartoon, ions, water as lines, box drawn, orthographic. | Membrane systems: bilayer thickness, the position of the protein, water in the bilayer. |

Labels and hydrogen bonds of the Binding site preset are recomputed in every frame, so residues come and go as the ligand moves. Its hydrogen bonds use the same criteria as the analysis (donor-acceptor distance up to 0.35 nm, hydrogen-donor-acceptor angle up to 30°), so what you see in a frame is what the analysis counted in that frame.
Representations and colours
The Representation panel has one row per class of molecule: Protein, Nucleic acid, Water, Ions, Lipids and Ligand / other, each with a check box to show it, the atom count, an H box for hydrogens, a style, a colouring and a radius factor.
| Setting | Choices |
|---|---|
| Style | Hidden, Lines, Points (small spheres), Licorice (sticks), Ball and stick, Spacefill (van der Waals), Cartoon |
| Colouring | Element, Chain, Residue type, Residue name, Molecule, Secondary structure, Rainbow (N to C), Uniform, B-factor / RMSF |
| Cartoon as tube, Cartoon opacity | A tube instead of helices and arrows; a translucent cartoon to see through it. |
| Secondary structure per frame | Helices and strands assigned again for every displayed frame with the DSSP method, so the cartoon follows unfolding during playback. |
| Ligand bond orders | Double and triple bonds of the ligand from the ligand file, else perceived; for display only. |
B-factor / RMSF colouring colours by the B-factor column of the structure or, with Per-residue values (.xvg), by a per-residue file such as the residue RMSF written by the rmsf analysis. That puts the RMSF figure of the Results page onto the structure. Nucleic acids are drawn as sticks; there is no cartoon for them.
Display and quality holds the render Quality (Automatic, Draft: single pass, Medium: FXAA, High: 2 x 2 supersampling, Ultra: 3 x 3 supersampling), Ambient occlusion, Silhouette outlines, Depth cueing (fog), Orthographic projection, the Background (Theme, White, Black, Light gradient, Dark gradient) and a Front clip plane that cuts away what is in front of the region of interest.
Molecular surface
Show surface draws a Gaussian molecular surface Of the protein (or nucleic acid), the protein with the ligand, or the ligand alone, with a chosen Colour and Opacity. Below 100 % opacity the nearest layer is drawn transparent, so a ligand inside a pocket stays visible through the protein surface.
Playback
| Control | What it does |
|---|---|
| First, previous, play / pause, next, last | Also Home, comma, Space, full stop and End. |
| Slider and frame box | Drag, or type a frame number and press Enter. |
| Time | The simulation time of the shown frame, in ns. |
| Speed | 1, 2, 5, 10, 15, 24, 30 or 60 frames per second (30 by default). |
| step | Advance by this many trajectory frames per shown frame: a step of 10 plays a 1001-frame run in 100 frames. |
| Once, Loop, Bounce | At the end: stop, start again, or play backwards. |
| Live | Appears when the trajectory is still being written: stays on its newest frame, which is how a running job is watched. |
Trajectories are indexed when they are opened and frames are read from the file when they are shown, with recently shown frames kept in a memory cache whose size is set on the Settings page. A trajectory of hundreds of megabytes therefore opens at once, and the status line under the view says how many frames per second are actually drawn.
Periodic boundaries

A simulation runs in a periodic box, and a raw trajectory stores atoms wrapped into it: molecules are cut at the box faces and the protein can appear in pieces or drift out of view. The panel repairs this for display:
| Setting | Effect | When to use it |
|---|---|---|
| Make molecules whole | Joins every molecule that the box cut. | Always for a raw trajectory. |
| Center solute | Puts the protein at the centre of the cell and every molecule as a whole inside the cell. | When the protein drifts towards a face. |
| Unit cell | As in file, Compact, Triclinic, Rectangular: the cell the molecules are shown in; molecules are never split. | Compact shows a rhombic dodecahedron as the near-spherical shape it is. |
| Show periodic box, Translucent box faces | Draws the edges, and optionally the faces, of the box. | Checking that the protein stays clear of its periodic images. |
The centred trajectory that the analysis stage writes for a job is already whole and centred and is shown as written. It is not fitted, so the protein can still rotate in the box during playback.
Picking and measuring

Under Labels and measurements, Click sets what a click on an atom does: Atom information (name, residue, position, bonded atoms, secondary structure, distance to the previous pick, shown in the Picked atom panel), Distance (2 atoms), Angle (3 atoms), Dihedral (4 atoms) or Label residue. Distances are shown in nm or Å. Show labels, the label size, Clear labels and Clear measurements manage what is drawn, and Ligand hydrogen bonds draws the protein-ligand hydrogen bonds of the shown frame with the analysis criteria.
A measured distance followed through the trajectory is the quickest check of a single interaction from the diagram: pick the two atoms of a hydrogen bond and play the run; the frames in which the label exceeds 0.35 nm are the frames the analysis did not count.
Images and movie frames


Image (File > Save viewer image, Ctrl+Shift+S) renders the current view off screen at any size up to 16384 pixels per side and 72 to 2400 dpi (300 by default), with anti-aliasing up to 3 x 3 supersampling, an optional transparent background and the labels if you want them, as PNG, JPEG or BMP. Very large images are rendered in tiles, so the size is not limited by the screen. Movie frames renders every n-th frame of a range as numbered PNG files at 1280 x 720, 1920 x 1080 or 3840 x 2160, ready for any video tool; the camera and representation are those of the view.
For a figure, set up the view with the Publication or Binding site preset, choose the orientation, then use the journal column width at 300 or 600 dpi. For a movie, first set the step and range so that the film lasts 10 to 30 seconds; a 100 ns run with 1001 frames played at every frame is 33 seconds at 30 images per second.
The viewer beside a page
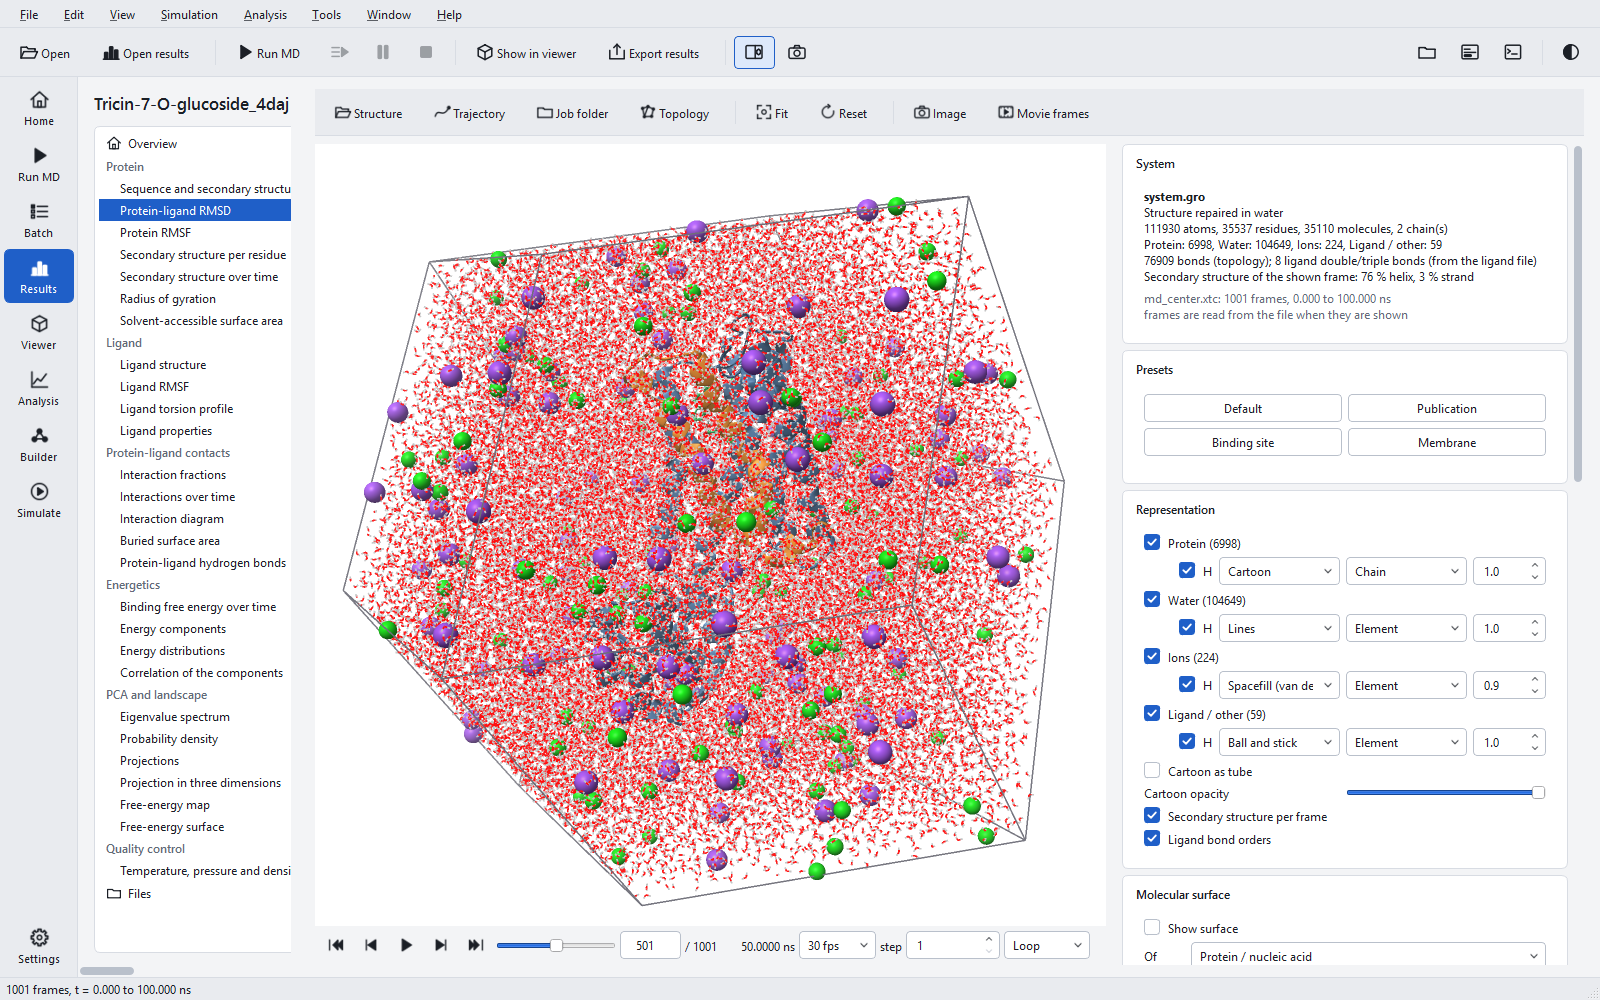
View > Viewer beside page (F4) shows the viewer next to the current page instead of on its own page. It is most useful with the Results page: select a figure, move the frame slider to the time of an event in the curve, and look at the structure at that moment.
Without a graphics driver
The viewer needs OpenGL 3.3. On a PC without a usable graphics driver, for example in some remote sessions or virtual machines, the program says so and, after a restart, uses the software renderer shipped with it; the start option --software-gl chooses it directly. Everything works, more slowly, but the live view has no ambient occlusion, outlines or anti-aliasing. Images saved with Image are computed on the CPU, which takes seconds for large sizes. See Troubleshooting.