Binding free energy (MM-GBSA)
How the binding energy is computed from the trajectory, what its components mean, how its uncertainty is estimated, and what it can and cannot be used for.
MM-GBSA estimates the binding free energy of the ligand from the frames of the production run. In every evaluated frame it computes the energy of the complex, of the receptor and of the ligand with a molecular-mechanics force field and an implicit solvent, and takes the difference. Averaged over the frames, the result is a quick and useful way to rank ligands on the same receptor. It is not an absolute binding free energy, and this page explains why.
What is computed
The program uses the single-trajectory protocol: receptor and ligand are cut out of each frame of the complex, without minimisation, so that ΔGbind = < G(complex) − G(receptor) − G(ligand) >. The same topology and force field as the simulation are used, without a cut-off for the non-bonded interactions.
| Setting | Value | Why |
|---|---|---|
| Solvation model | GB-OBC2 (generalised Born) with mbondi2 radii | A widely tested generalised Born variant for protein-ligand systems. |
| Salt concentration | 0.15 mol/L | Matches the ions of the simulated box. |
| Dielectric constants | 1 inside, 78.5 for the solvent | Standard values for explicit-charge force fields in water. |
| Born-radius cut-off | 25 Å | Large enough not to truncate the effective radii of buried atoms. |
| Non-polar term | 0.0072 kcal/mol/Ų × SASA (probe 1.4 Å) | The surface-tension estimate of the cavity and dispersion cost. |
| Frames | About 1000 evenly spaced over the window (1001 for a 100 ns run saved every 10 ps) | Enough frames for a block-averaged error; more adds little because neighbouring frames are correlated. |
| Window | The window of the MM-GBSA stage: by default the whole production run | Stated in the note of the table. |
| Entropy | Not included | See below. |
The settings are project keys under mmgbsa (see Project file keys); the defaults are the ones above. Covalent ligands are refused.
The components
| Component | Symbol | Meaning |
|---|---|---|
| van der Waals | ΔEvdW | Lennard-Jones interaction between receptor and ligand: shape complementarity and dispersion. |
| Electrostatic | ΔEelec | Coulomb interaction between receptor and ligand charges in vacuum. |
| Polar solvation (GB) | ΔGGB | Change of the polar solvation energy on binding; usually positive, because polar groups lose water on burial. |
| Non-polar solvation | ΔGSA | Change of the surface term; negative, proportional to the buried surface. |
| Gas phase | ΔGgas | ΔEvdW + ΔEelec (internal terms cancel in the single-trajectory protocol). |
| Solvation | ΔGsolv | ΔGGB + ΔGSA. |
| Binding free energy | ΔGbind | ΔGgas + ΔGsolv, in every frame. |
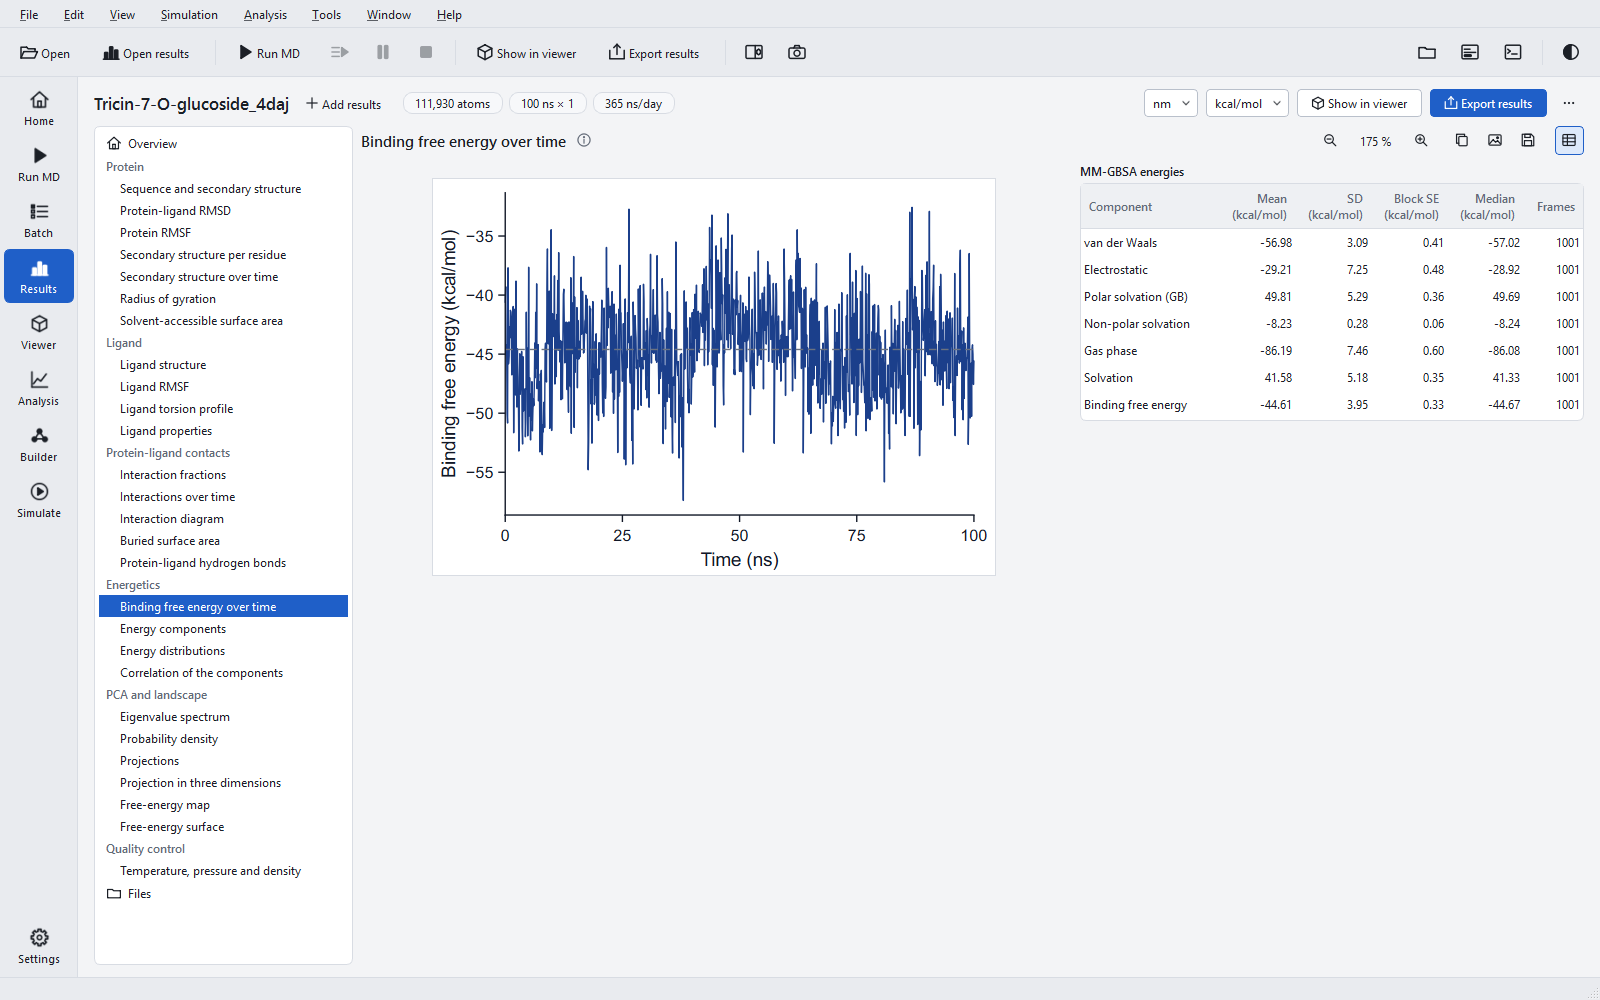
The components add up exactly in every frame. For the example ligand, tricin 7-O-glucoside, the means are ΔEvdW = −56.98, ΔEelec = −29.21, ΔGGB = +49.81 and ΔGSA = −8.23 kcal/mol, giving ΔGbind = −44.61 kcal/mol with a standard deviation of 3.95 and a block standard error of 0.33 kcal/mol.
Uncertainty
The table gives two different numbers. The standard deviation describes how much the energy varies from frame to frame. The block standard error (Flyvbjerg and Petersen, 1989) estimates how well the mean is known: the frames are grouped into ever larger blocks until the block means are uncorrelated, which happens when the standard error stops growing (a plateau), with at least eight blocks. When no plateau is reached, the largest value is reported as a lower bound, and the table note, the comparison table and the comparison bar chart say so.
The block standard error measures the statistical error of one trajectory only. It does not include the much larger variation between independent runs of the same complex; for that, run replicas and compare their means. Differences between ligands that are not clearly larger than the spread between replicas are not resolved.
Figures
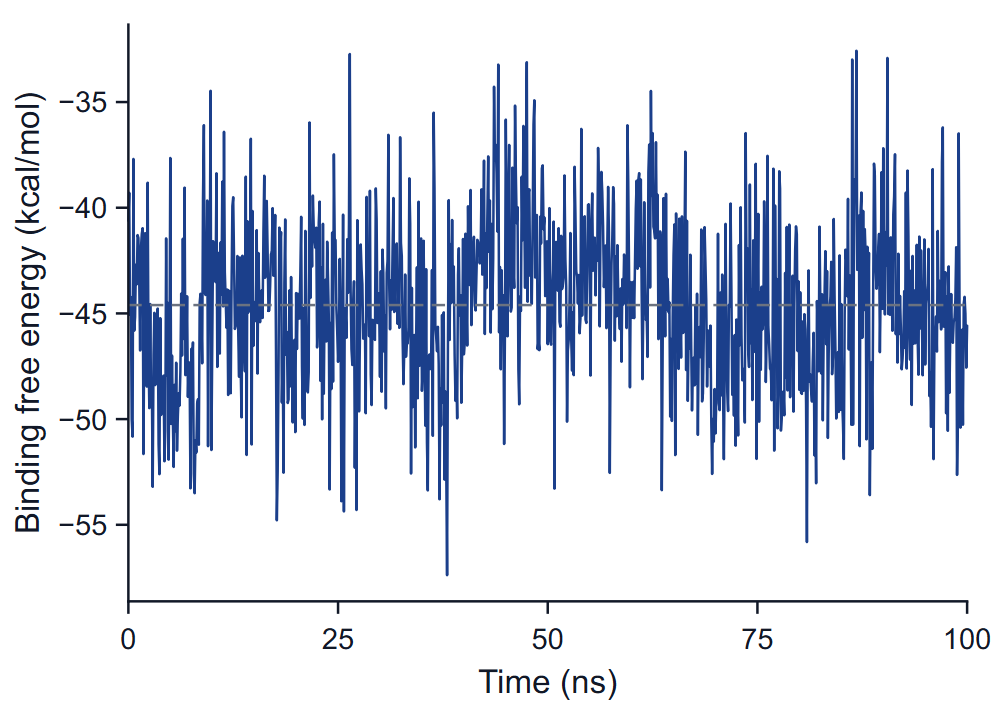
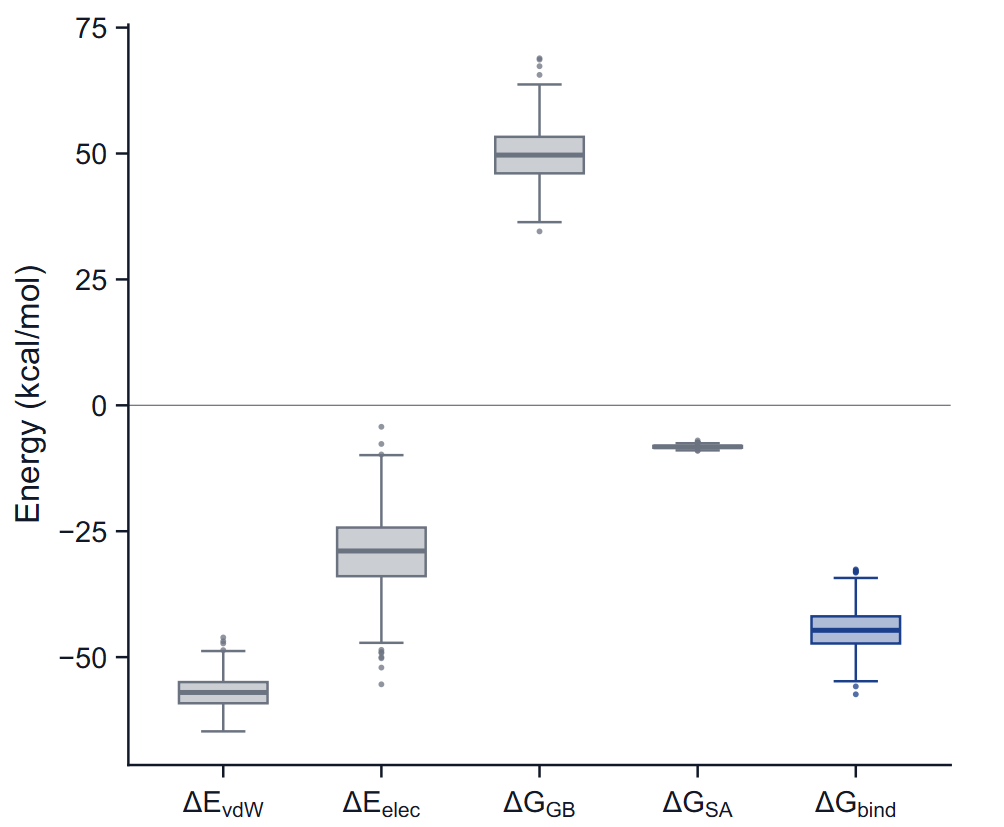
Binding free energy over time plots ΔGbind of each evaluated frame against time, with the mean as a dashed line. Look for a drift or a step: a mean over a run whose energy changed level averages two states, and the block error will usually fail to reach a plateau. Energy components shows each term as a box plot: the box spans the quartiles, the line is the median, the whiskers reach the most extreme value within 1.5 interquartile ranges, and points beyond are drawn individually.
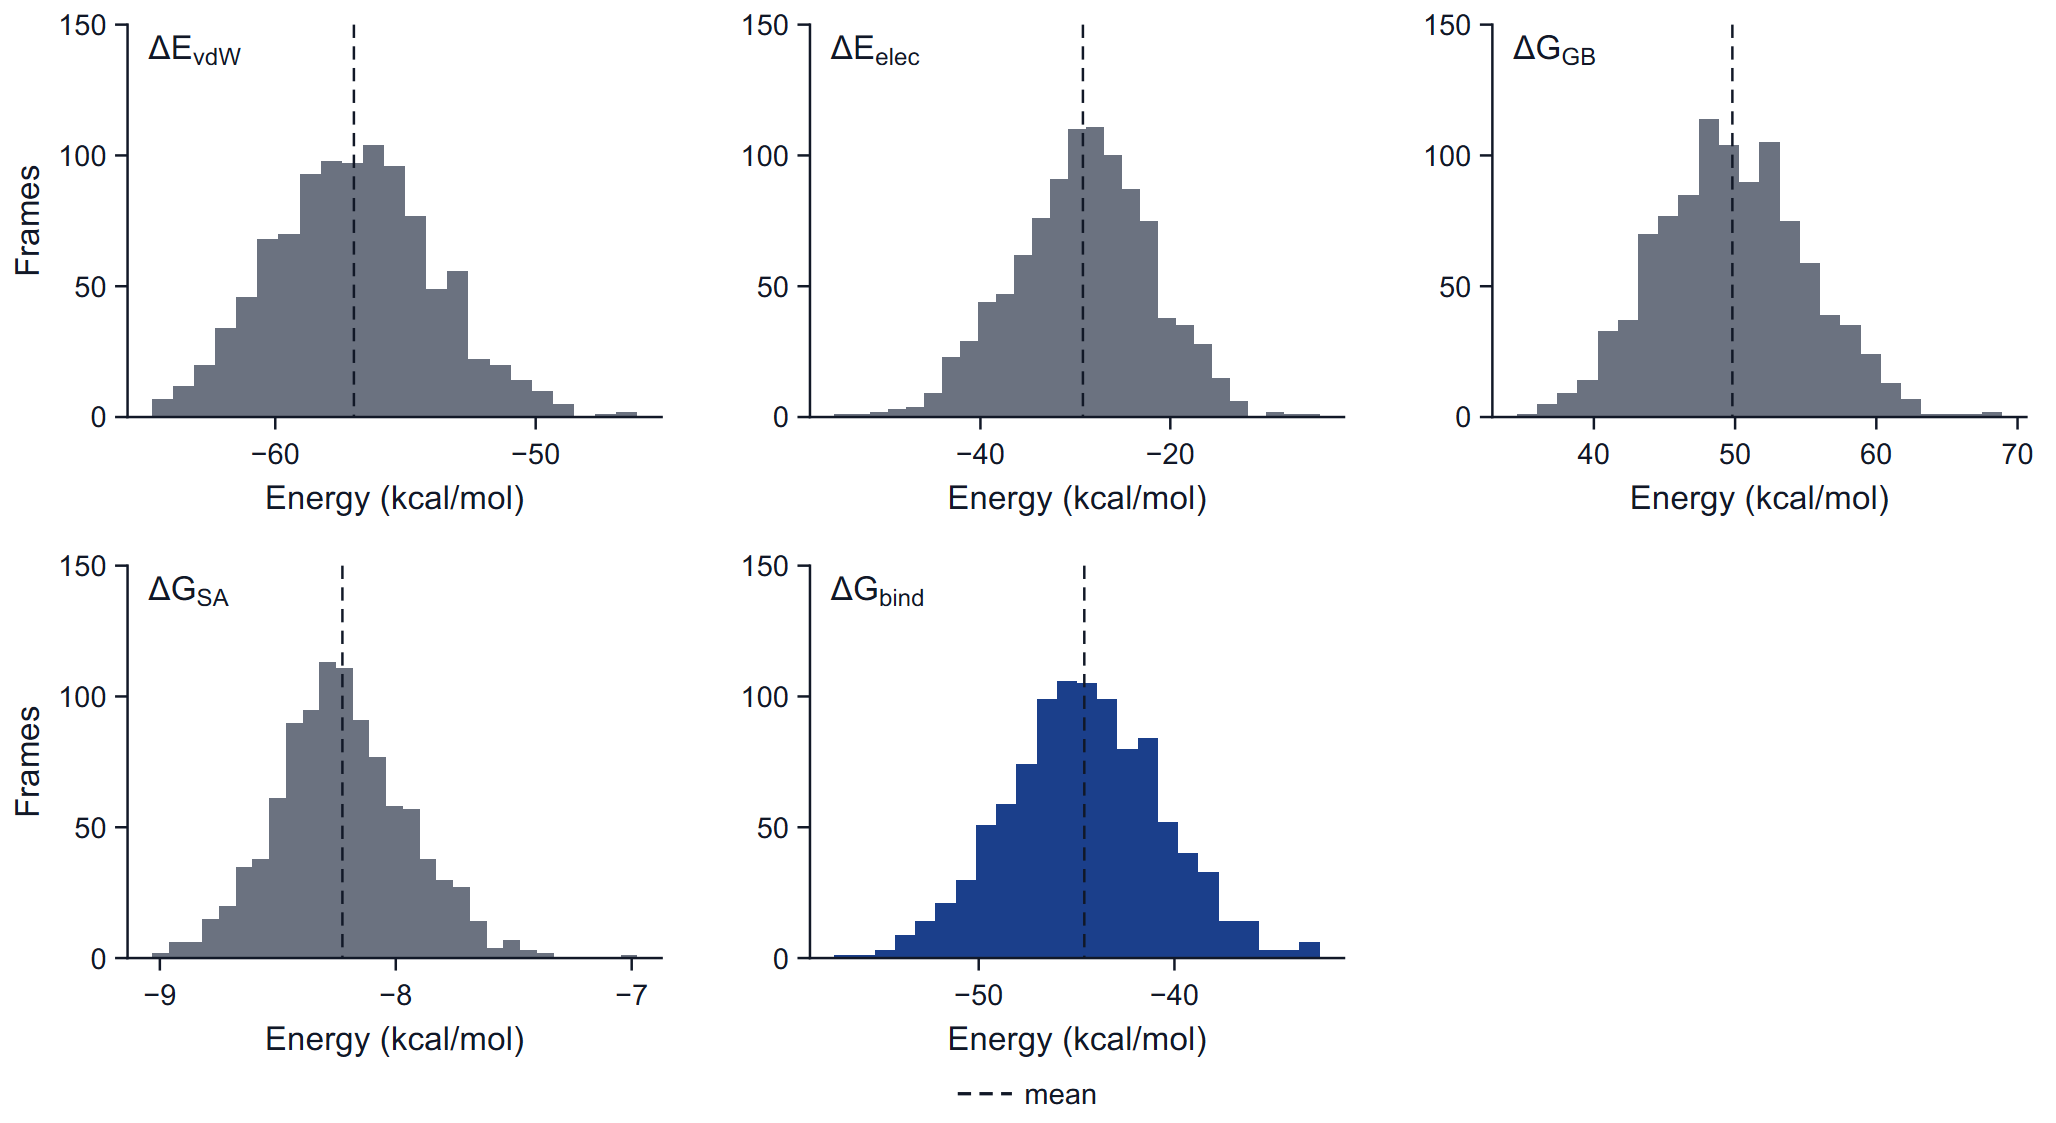
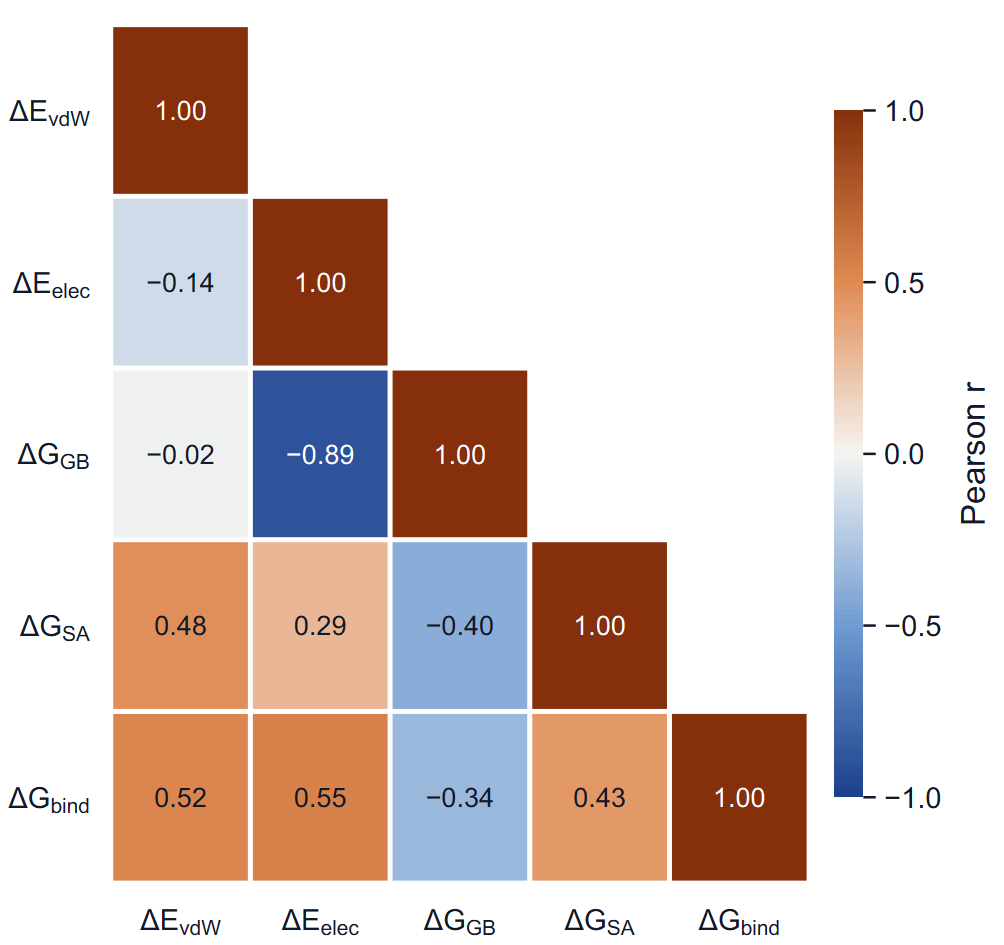
Energy distributions are histograms with Freedman-Diaconis bins; two peaks in the total are two binding modes, and their weights decide the mean. Correlation of the components is the lower triangle of the Pearson correlation matrix of the per-frame values. A strong negative correlation between ΔEelec and ΔGGB is normal and is the reason the electrostatic term alone says little about binding; look at the sum.
What the number means and what it does not
- A ranking, not an affinity. MM-GBSA energies are typically much more negative than measured binding free energies, often by tens of kcal/mol, and they are not converted into a dissociation constant. Use them to order ligands.
- No entropy term. The loss of conformational, rotational and translational freedom on binding is not computed. Ligands of similar size and flexibility suffer similar losses and can be ranked; a small rigid ligand and a large flexible one cannot be ranked fairly.
- Same receptor, same protocol. Compare ligands only on the same receptor construct, simulated with the same force field, length, window and number of replicas.
- No implicit membrane. The solvent model is water everywhere. For a membrane protein the absolute numbers are further from reality; a ranking of ligands in the same pocket remains the intended use.
- One binding mode per estimate. If the ligand changes its pose or leaves, the mean averages different states; the time figure shows it.
Per-residue decomposition
A decomposition of the binding energy into contributions of individual residues is available from the command line and with the project key mmgbsa.decomposition (off by default), which writes 08_summary/mmgbsa/decomp.csv in the job folder. It is not drawn on the Results page and is not part of the export.
Validation
The energies were compared with an established reference program on the same topology and the same frames: the largest per-frame difference of the total was about 5 × 10⁻⁴ kcal/mol over 101 frames in one case and 2.5 × 10⁻⁴ kcal/mol in another. The statistics, quartiles, correlation matrix and block standard error were recomputed independently and agree to 5 × 10⁻⁵ kcal/mol. See Accuracy and validation.