Monitoring a running job
What the live monitor shows while a job runs: progress, speed, time left, energy plots, the stage table, the running structure and the log, and what normal looks like.
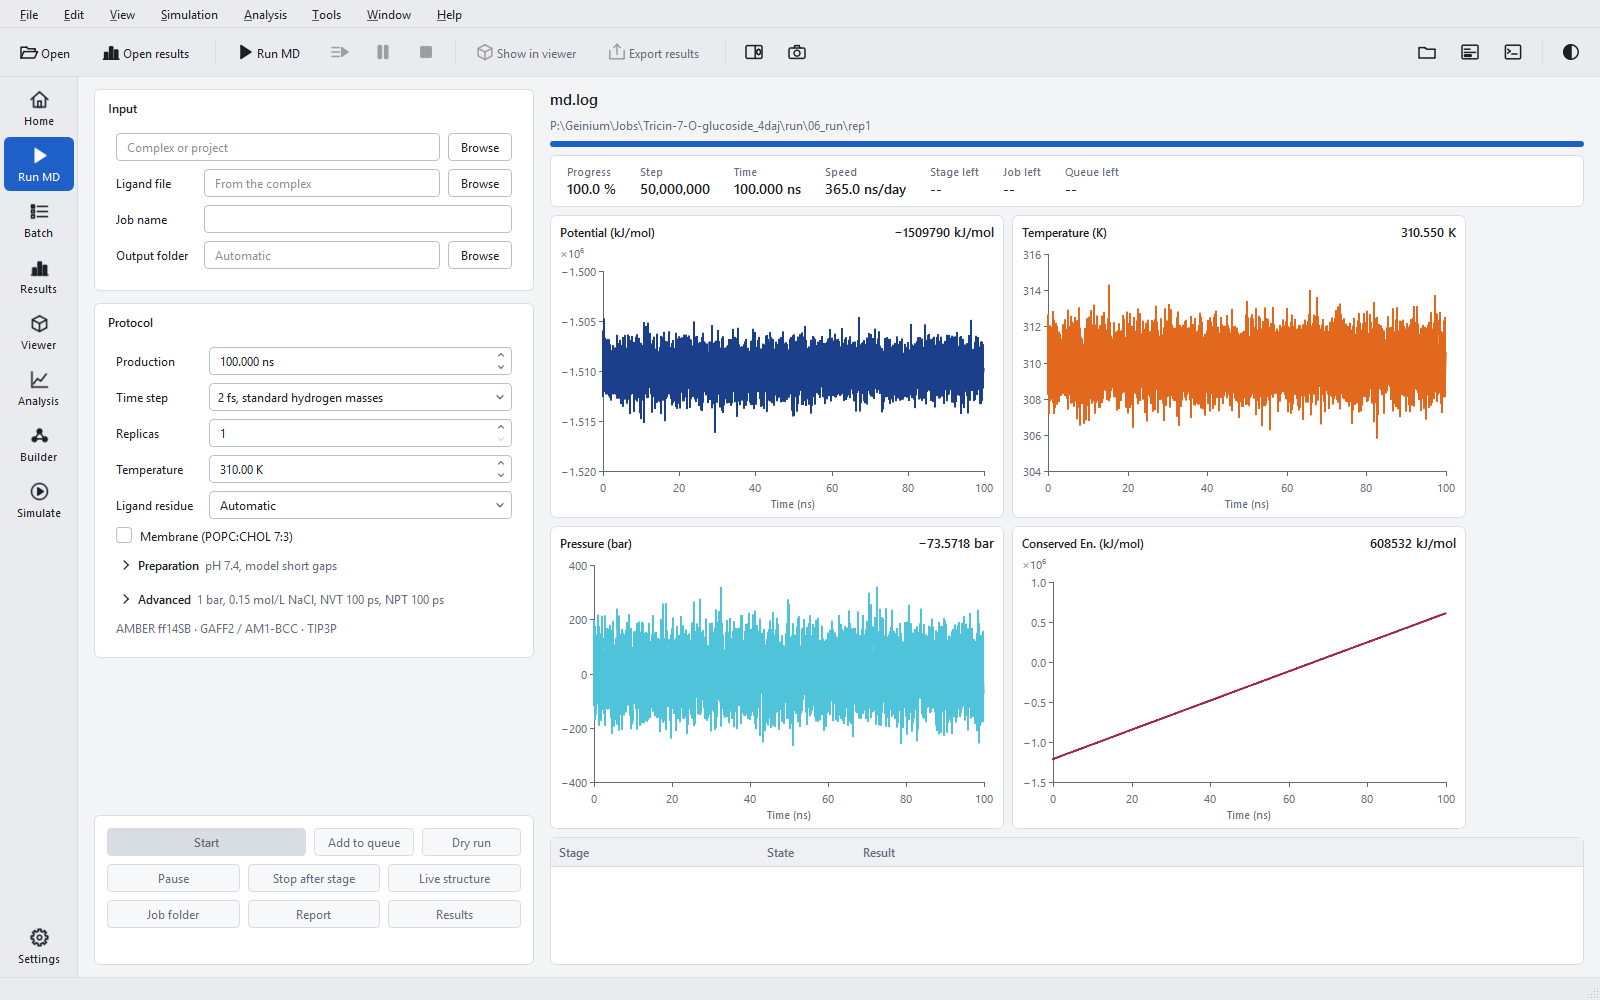
The right half of the Run MD page is the monitor of the running job, whether it was started from Run MD or from the Batch queue ("Monitor" on the Batch page opens it). It reads the files the engine writes and shows them as they appear; nothing is estimated or interpolated except the times left.
The header and the progress strip
The first line names the job ("Job i of n: name" when the queue holds several, otherwise the name), or "No job running". At its right end the engine of the running stage is described by its precision: "mixed precision" for the GPU engine, "double precision · n threads" for the CPU engine. The second line gives the stage, "Stage i of m · <name>", followed by " · pausing", " · stopping after this stage" or " · stopping after this job" when a stop was requested. A progress bar for the stage follows.
| Value | Meaning |
|---|---|
| "Progress" | Fraction of the running stage done. Stages that report no fraction (preparation, analysis) show a moving bar. |
| "Step" | Current step and last step of the stage. |
| "Time" | Simulated time of the stage, in ps below 1 ns and in ns above; "--" during minimisation, which has no time. |
| "Speed" | ns/day of the running stage, measured by the engine. |
| "Stage left" | Time left for the running stage at the current speed. |
| "Job left", "Queue left" | Time left for the job and for the whole queue. The tooltip says what the estimate covers: MD stages only, without minimisation, MM-GBSA and the membrane equilibration. |
The plots
Four plots show the energies the engine writes to the log of the running stage. The log is read every 0.7 s, so the plots lag the engine by at most one output interval (10 ps by default). Each point is a value from the log; nothing is smoothed or interpolated. The plots are cleared when a new MD stage starts.
| Plot | Quantity | Fall-back when the log lacks it |
|---|---|---|
| 1 | "Potential" | none |
| 2 | "Temperature"; during minimisation "Maximum force" | "Pres. DC (bar)" |
| 3 | "Pressure" | "Pressure (bar)", then "Total Energy" |
| 4 | "Density" | "Volume", then "Conserved En.", then "Kinetic En." |
The plot title says what is drawn, with its unit, and the current value is at its top right. During minimisation the horizontal axis is the step number; otherwise it is time.
What normal looks like
| Quantity | A healthy run | Worth a look |
|---|---|---|
| Potential | Fluctuates around a flat mean after the first nanoseconds. | A steady fall during production: the system is still relaxing, and the analysis window should start later. |
| Temperature | Fluctuates within a few kelvin around the reference (310 K above). The fluctuation shrinks as the number of atoms grows. | A mean away from the reference, or a jump. |
| Pressure | Swings by hundreds of bar from frame to frame; only its mean over many frames is near 1 bar. This is normal for a system of this size. | A mean far from 1 bar over a long stretch. |
| Density | Settles during NPT equilibration (about 1000 kg/m3 for a water box) and stays there. | A drift during production. |
| Conserved energy | Changes slowly and steadily. In the run above it rises by about 1.8 x 10⁶ kJ/mol over 100 ns, about 1.6e-4 kJ/mol/ps per atom, the same order as the drift of an established reference program in the validation runs (2e-4 to 3e-4 kJ/mol/ps per atom). | Sudden jumps, which point to an integration problem. |
The stage table
Below the plots, the stage table lists every stage of the job with its "State" and "Result". States are "pending", "running", "done", "partial" (an MD stage with a checkpoint, to be continued) and "stale" (its inputs changed, so it will be redone). The result of a finished stage is a short summary, for example "10000 steps, 385.2 ns/day, mean temperature 308.81 K" or, for NPT, the mean density as well. The tooltip of a stage name is its folder in the job.
The live structure
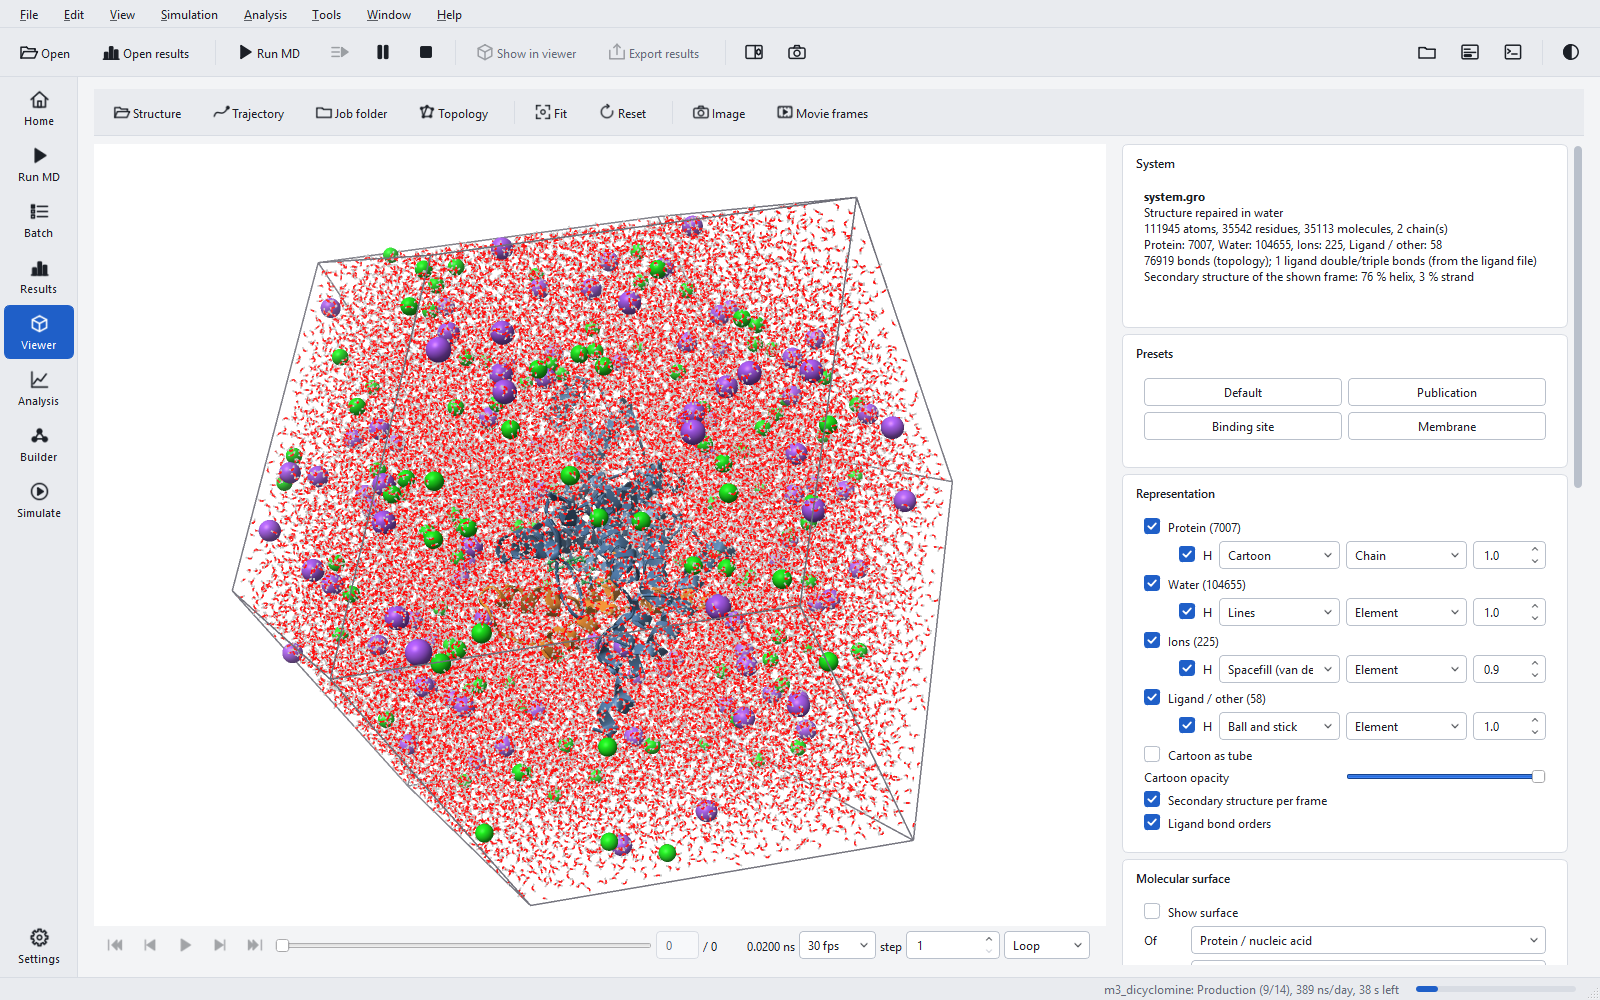
"Live structure" on Run MD, or Simulation > Show live structure, shows the running system in the viewer. The newest complete frame of the trajectory is read every 1.4 s, with molecules made whole and centred on the solute, so the protein does not jump across the box. Frames appear at the output interval of the trajectory (every 10 ps of simulated time by default).
The status bar and the Log panel
While a job runs, the status bar shows "<job>: <stage> (i/n), n ns/day, t left" with a progress bar, on every page. The Log panel (Ctrl+L) records every message of the program and of the stages: the decisions of preparation, the protonation changes of the ligand, parameter warnings, the closest ligand-protein distance, and the outcome of each stage.
| Control | What it does | When to use it |
|---|---|---|
| "Show" | "Debug and above", "Info and above" (default), "Warnings and errors", "Errors only": the lowest level shown from now on. | "Warnings and errors" during a long queue, to see only what needs attention. |
| "Save" | Saves the log as a text file. | To keep a record with the results, or to report a problem. |
| "Clear" | Empties the panel (also Edit > Clear log). | Before a new job, to read only its messages. |
The panel keeps the last 20,000 lines. Each line carries its time and level (debug, info, warning, error). The full record of a job is also in run\pipeline.log of its folder.
