The Analysis page
Running single analysis tools on any structure and trajectory, and plotting their output files.
The analyses of a job run automatically and appear on the Results page. The Analysis page is for everything else: a trajectory made elsewhere, a group the standard analyses do not cover, or a quick look at an .xvg file. Each tool writes the same files as the matching command of mdsim.
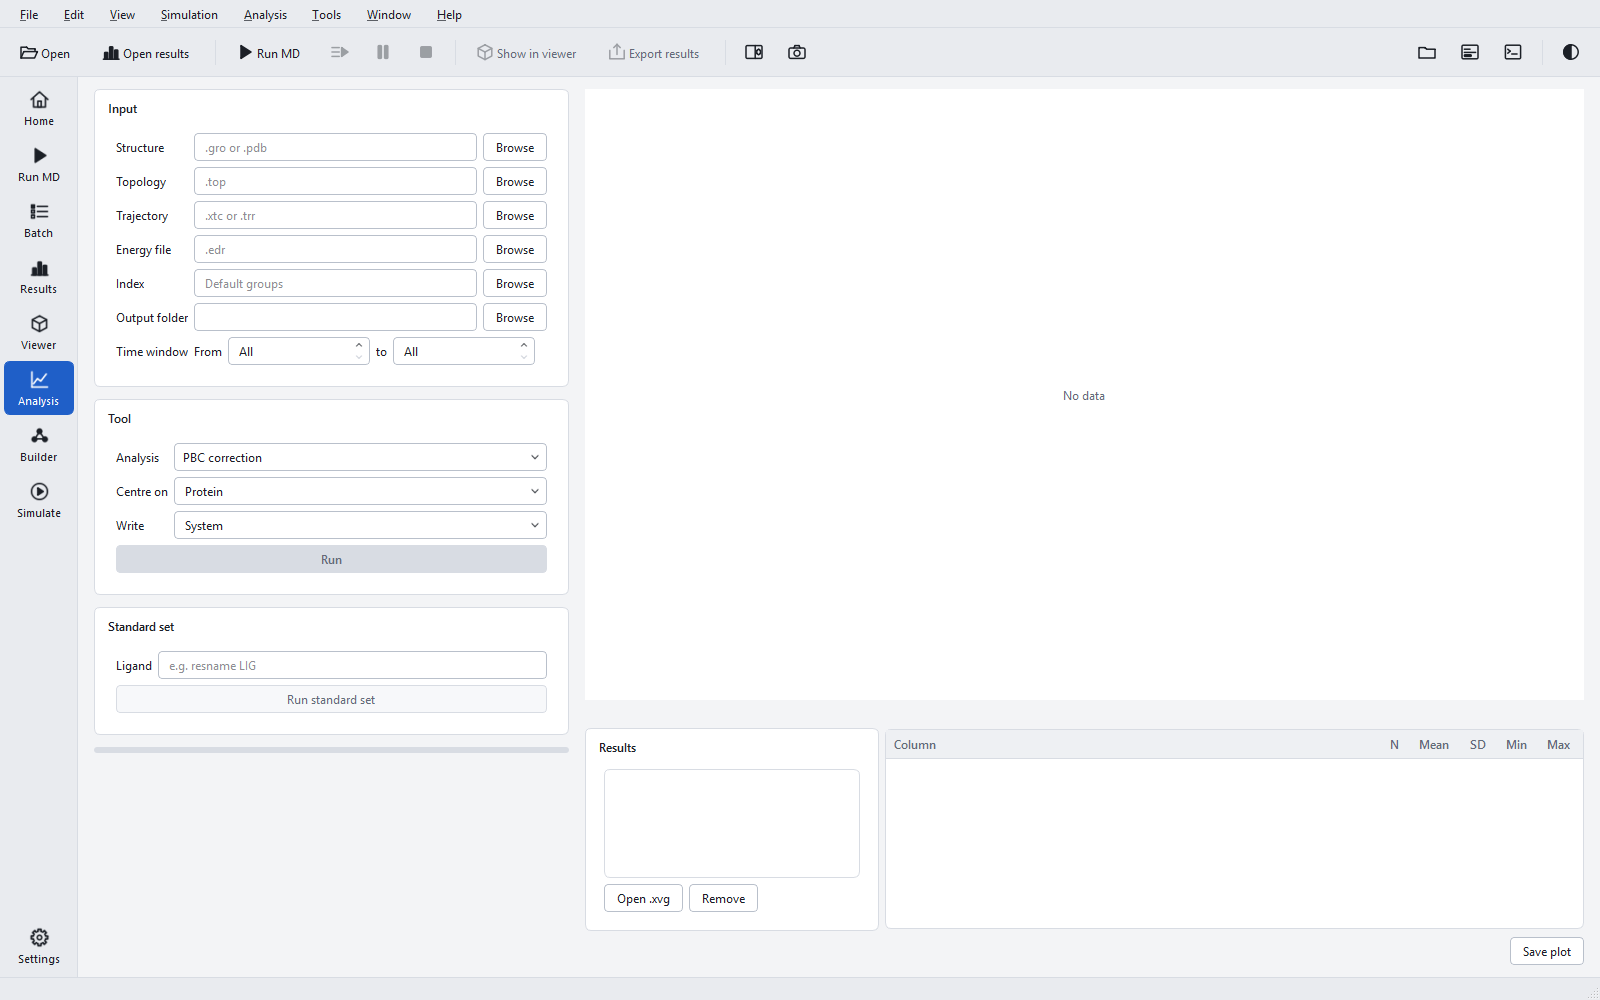
Inputs
| Field | Takes | Notes |
|---|---|---|
| "Structure" | .gro or .pdb | The reference structure; for a job, 04_system\system.gro. |
| "Topology" | .top | Needed by tools that need bonds, charges or masses (hydrogen bonds, contacts, buried surface) and by the standard set. |
| "Trajectory" | .xtc or .trr | Needed by every tool except "Energy terms". |
| "Energy file" | .edr | Only for "Energy terms". |
| "Index" | .ndx; empty means "Default groups" | Give the index file of the job (04_system\index.ndx) to use its groups, such as the ligand group. |
| "Output folder" | A folder | Every tool writes its files here. Required. |
| "Time window" | "From" and "to" in ps; "All" means no limit | Restrict the analysis to part of the trajectory, for example to leave out the first 10 ns. |
Tools
Choose a tool under "Analysis". Its groups appear below; each group field accepts an index
group or a selection such as resname LIG. "Run" starts the tool; if it cannot start,
its tooltip says why ("choose the output folder", "choose the trajectory file").
| Tool | Groups | What it writes |
|---|---|---|
| "PBC correction" | "Centre on" (Protein), "Write" (System) | A trajectory with whole molecules, the centring group and the ligand kept together and centred. It becomes the input of the tools run after it in the same session. |
| "RMSD" | "Fit group" (Backbone), "RMSD group" (Backbone) | RMSD after a least-squares fit to the reference structure, nm. |
| "RMSF per residue" | "Group" (C-alpha) | Root-mean-square fluctuation per residue, nm. |
| "Radius of gyration" | "Group" (Protein) | Mass-weighted radius of gyration, nm. |
| "Solvent-accessible surface" | "Surface group", "Output group" (Protein) | SASA of the output group computed within the surface group, nm2. |
| "Hydrogen bonds" | "Reference group", "Target group" (Protein) | Number of hydrogen bonds between the groups (0.35 nm, 30 degrees). |
| "Minimum distance / contacts" | "Group 1" (Protein), "Group 2" (Water) | Minimum distance and number of contacts closer than 0.6 nm. |
| "Distance" | "Selection" | Distances between pairs of positions given in the selection language, for example com of group "Protein" plus com of resnr 1. |
| "Secondary structure" | "Group" (Protein) | DSSP secondary structure per frame and the counts per type. |
| "Protein-ligand contacts" | "Receptor" (Protein), "Ligand" (resname LIG) | Hydrogen bonds, hydrophobic, ionic and water-bridged contacts per residue, with occupancies. |
| "Buried surface" | "Receptor", "Ligand" | SASA of receptor, ligand and complex from the same frames and the buried area, nm2. |
| "Energy terms" | "Terms" (Temperature Pressure Density Potential) | The terms of the energy file with average, error estimate, RMSD and drift. |
Two further entries of the list are greyed out with the tooltip "Not available in this version": they are not offered rather than offered with results that have not been validated.
The standard set
"Run standard set" runs, in order: PBC correction, backbone RMSD, C-alpha RMSF per residue,
radius of gyration of the protein, protein SASA and intra-protein hydrogen bonds. With a ligand
given under "Ligand" (for example resname LIG) it adds the ligand RMSD after the
backbone fit, the protein-ligand contacts and the buried surface; with an energy file it adds the
energy terms. It needs structure, topology, trajectory and output folder. The progress line reads
"Running i of n: <tool>", and the result "<n> tool(s) finished" or which tool failed and
why.
Plotting result files
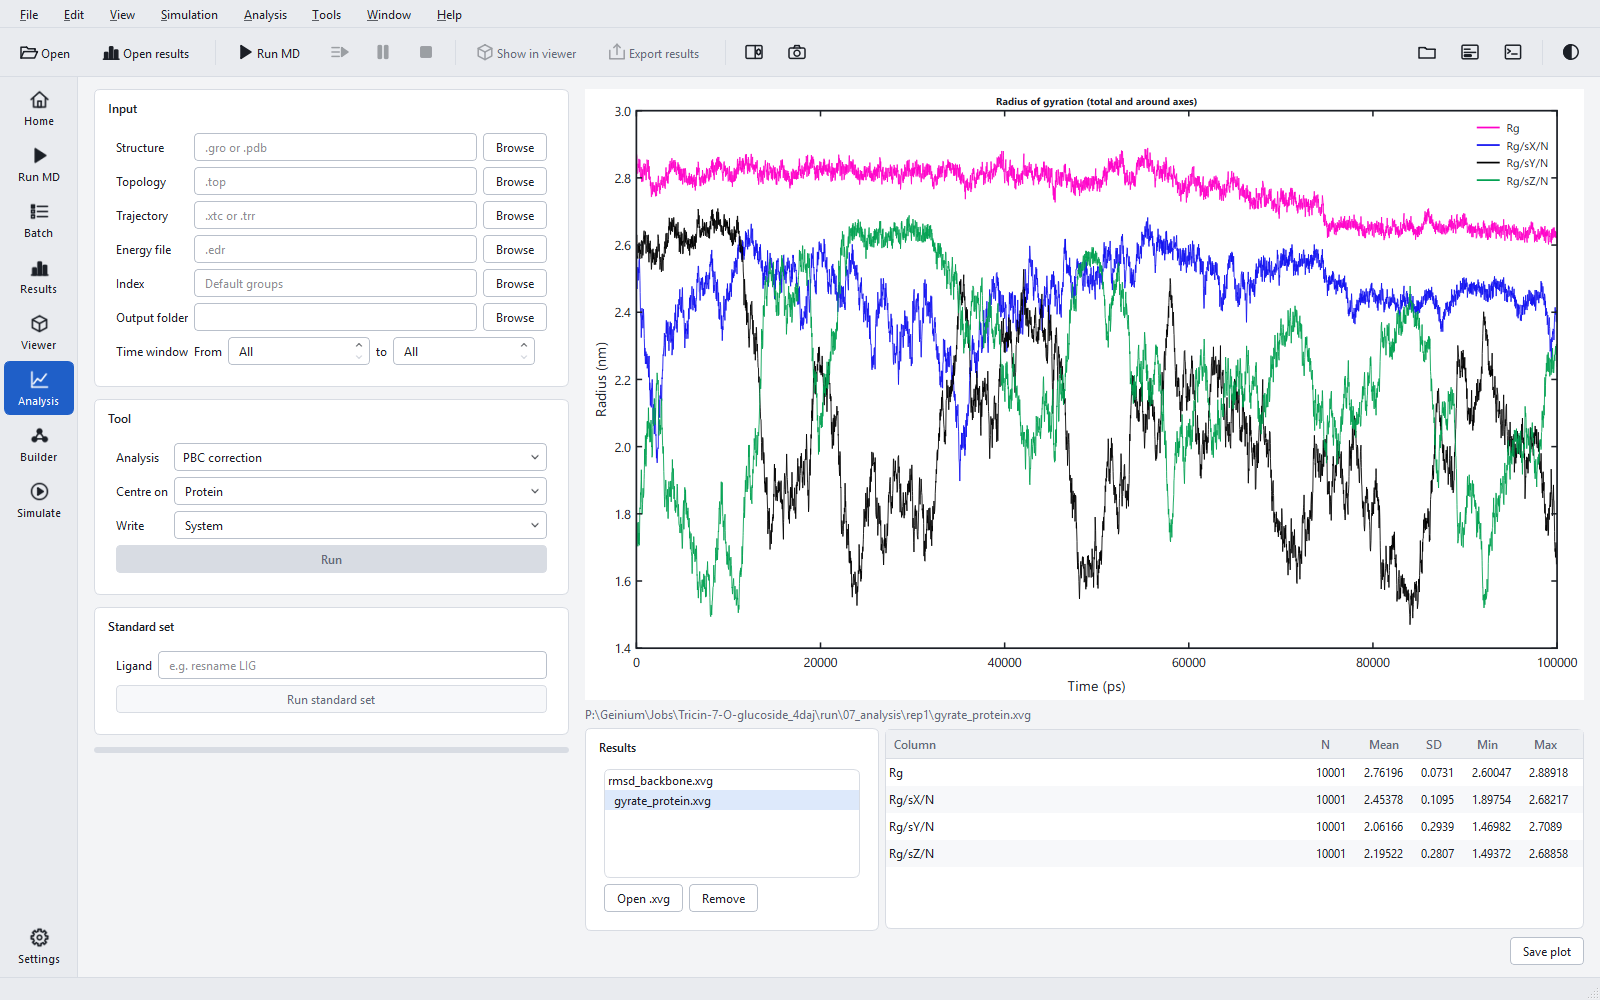
"Open .xvg" adds files to the "Results" list (also Analysis > Open .xvg plot, or open an .xvg file with File > Open). Click a file to plot it; the table under the plot gives "Column", "N", "Mean", "SD", "Min" and "Max" for every column. "Remove" takes a file off the list; "Save plot" writes the plot as PNG, SVG or PDF.