Protein-ligand interactions
The eight interaction types, their geometric criteria, the percentage of the simulation time, and how to read the two-dimensional diagram.
The interaction analysis looks at every frame of the production run and records which interactions between the ligand and its surroundings are present. Each interaction is a specific pair: one site of the ligand (an atom or a ring) with one partner (an atom, a ring or a charged group of a residue, a water molecule or a metal ion). The fraction of frames in which it is present is its occupancy. Three figures and one table report the result.
Interaction types and criteria
| Type | Criterion | Default |
|---|---|---|
| Hydrogen bond | Donor N or O with its hydrogen, acceptor N or O: distance D···A and angle H-D···A | ≤ 0.35 nm; ≤ 30° |
| Water bridge | One water molecule hydrogen-bonded to a ligand atom and to a partner atom in the same frame | Hydrogen-bond criteria for both bonds |
| Salt bridge | Oppositely charged groups, distance between their closest charge-bearing atoms | ≤ 0.40 nm |
| Pi-pi stacking | Distance between ring centroids; face to face when the ring planes are within 30°, edge to face when they are at 60° or more; lateral offset | ≤ 0.55 nm; offset ≤ 0.20 nm |
| Pi-cation | Ring centroid to cation; offset of the cation projected on the ring plane | ≤ 0.60 nm; offset ≤ 0.20 nm |
| Halogen bond | Cl, Br or I on a ligand carbon to O, N or S; angle C-X···A within 30° of 165°, angle X···A-Y within 30° of 120° | ≤ 0.40 nm |
| Metal coordination | Metal ion to a ligand N, O or S | ≤ 0.30 nm |
| Hydrophobic contact | Ligand carbon to a partner carbon that is bonded only to carbon and hydrogen | ≤ 0.40 nm |
Aromatic rings are planar five- and six-membered rings with 4n + 2 π electrons. Charged groups are carboxylate, phosphate, sulfonate and sulfate, tetrazolate, ammonium, amidinium, guanidinium, imidazolium, pyridinium and sulfonium, with the protonation taken from the simulated topology, so a histidine counts as charged only if it was simulated doubly protonated. Water appears only as a bridge and metal ions only in metal coordination. The criteria cannot be changed in the application; they are printed in the Analysis settings table of the report and stored in raw-data/interactions.json.
How occupancy is counted
Occupancy is the percentage of the analysed frames in which the interaction is present. The mean distance (and angle, where there is one) is averaged over the frames in which it is present, not over all frames. The analysis uses the window of its pipeline stage, which by default is the whole production run including its first 10 %; per-frame distances are not stored, only the presence in each frame.
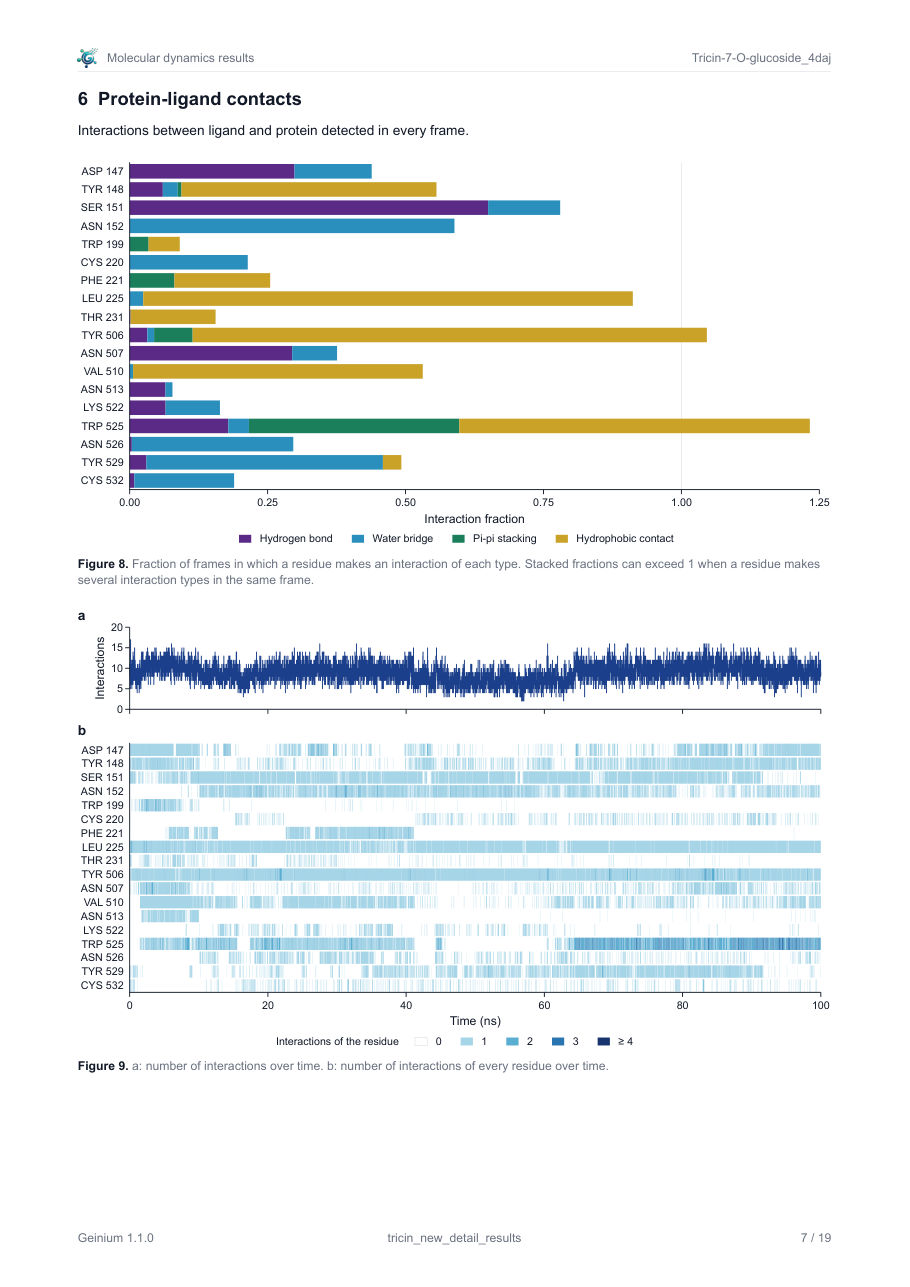
Two levels of counting appear in the figures and they must not be confused. The diagram and the table of the most frequent interactions count one interaction: one ligand site with one partner. The interaction fractions count a residue and a type: the fraction of frames in which the residue makes at least one interaction of that type with any part of the ligand. A residue that hydrogen-bonds to three different hydroxyl groups at different times therefore has a higher hydrogen-bond fraction than any of its single links. In the example, SER 151 has a hydrogen-bond fraction of about 0.65 while its strongest single hydrogen bond, the one drawn in the diagram, is present in 40 % of the frames.
Reading the diagram
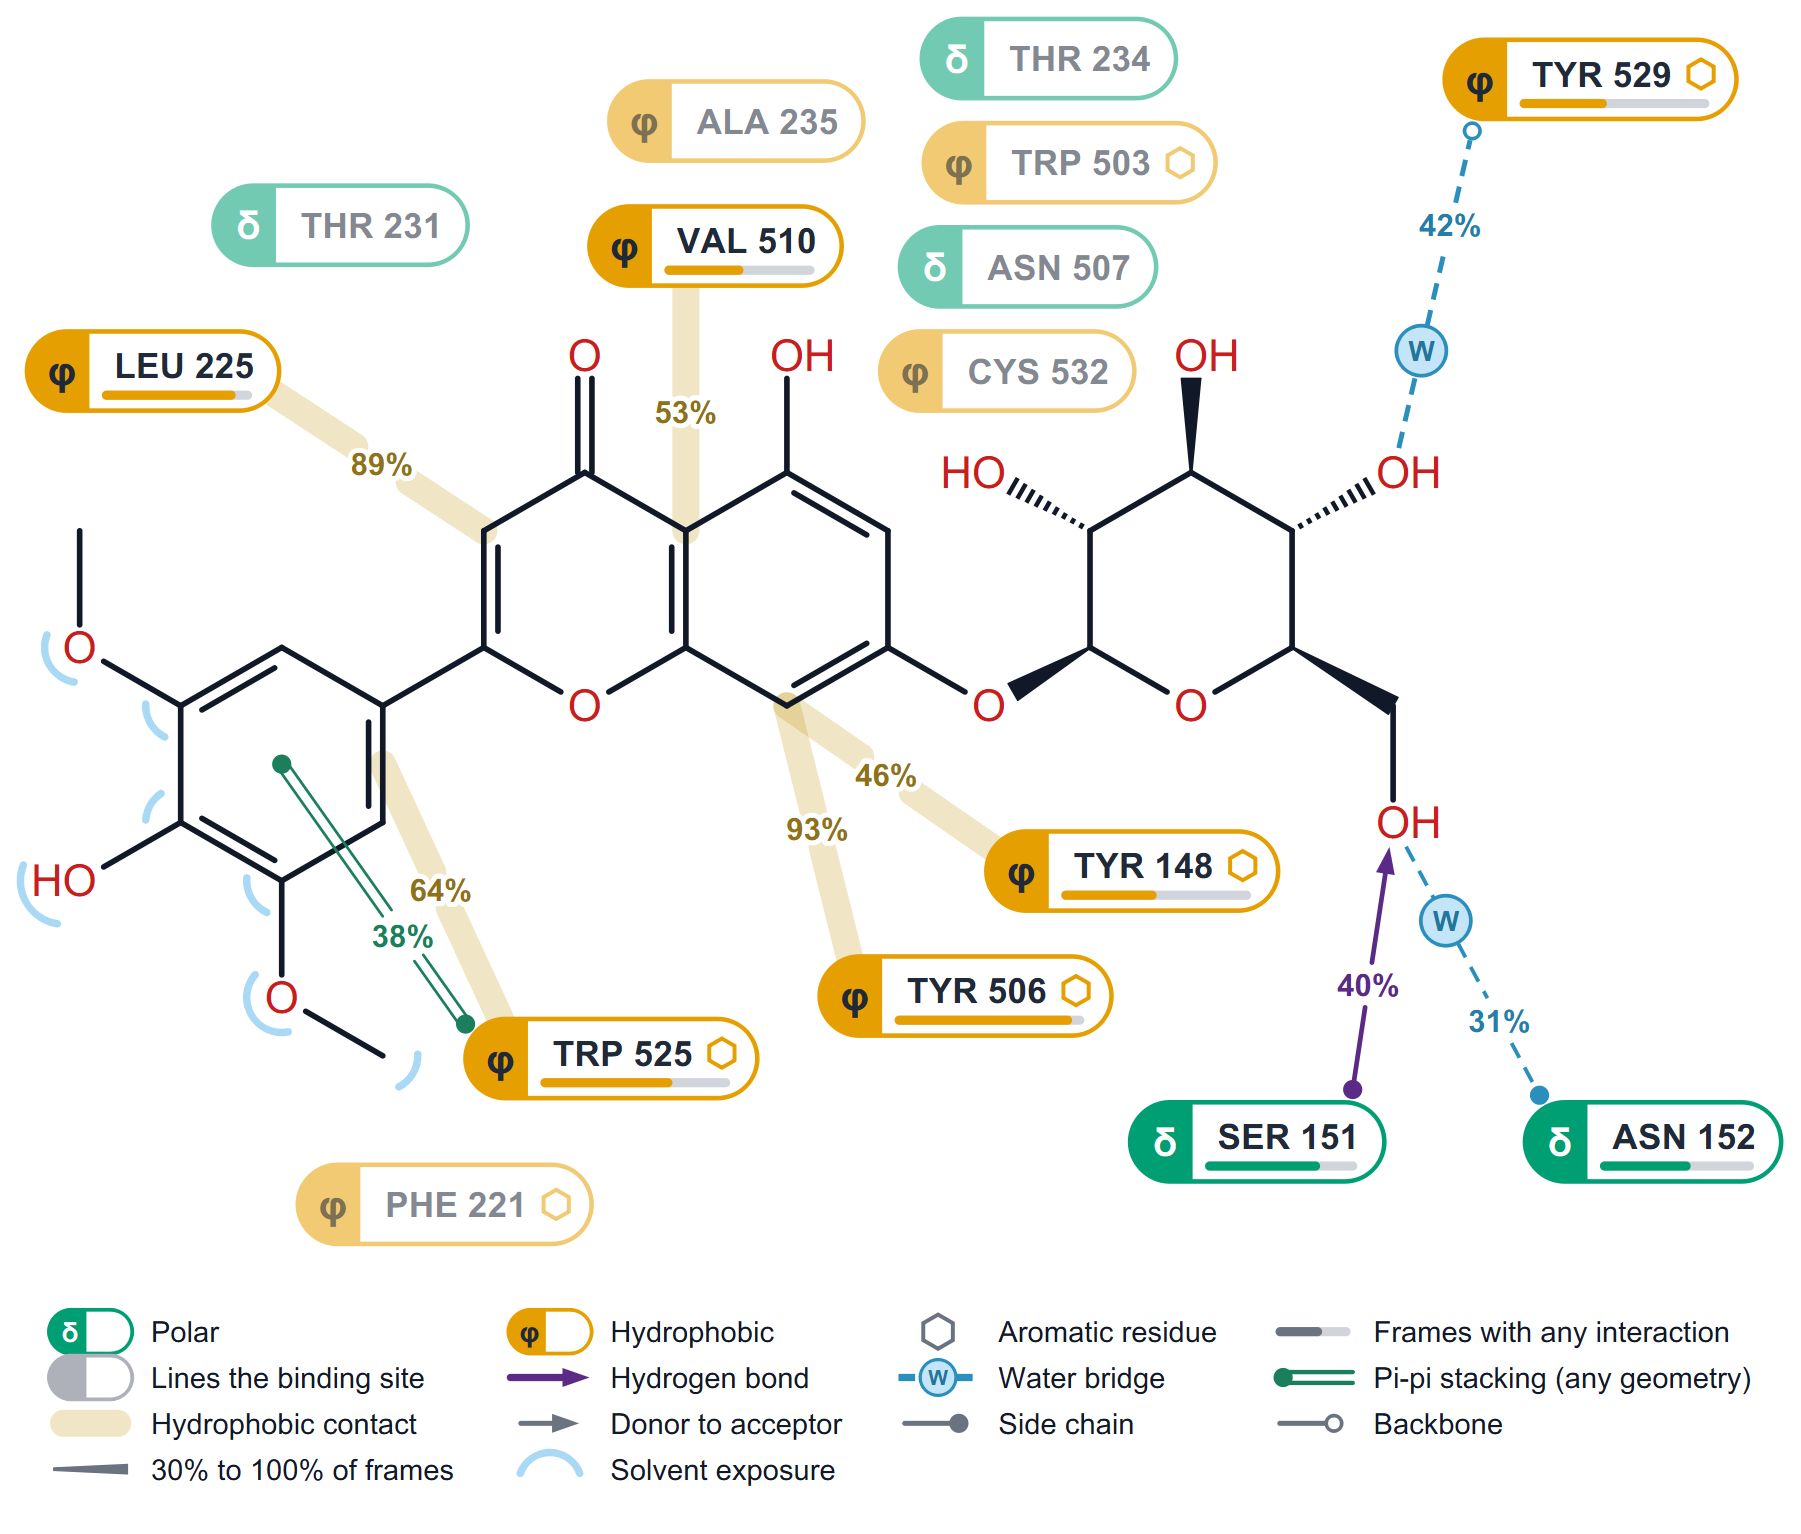
The diagram draws the ligand as a two-dimensional structure and places around it the residues whose interactions pass the threshold, with a percentage on every link. It carries no criteria and no frame counts; those are in the caption line of the report and in the settings table.
| Element | Meaning |
|---|---|
| Residue label | Name and number, for example "TYR 148". The glyph at the left gives the class: δ polar, φ hydrophobic, a minus sign negatively charged, a plus sign positively charged, G glycine. A hexagon after the name marks an aromatic residue. |
| Pale label | "Lines the binding site": the residue is close to the ligand but none of its interactions passes the threshold. |
| Bar under the label | "Frames with any interaction": the fraction of frames in which the residue makes any interaction with the ligand. |
| Link width | Grows with occupancy, from the thinnest line at the threshold to the widest at 100 % ("30% to 100% of frames" in the legend). |
| Translucent band | A hydrophobic contact. |
| Arrow | A hydrogen bond, pointing from the donor to the acceptor. |
| Dashed line with a W | A water bridge. |
| Double line | Pi-pi stacking. Face-to-face and edge-to-face geometries of the same ring pair are merged into one link ("Pi-pi stacking (any geometry)"), counting a frame when either geometry is present. |
| End of the link at the residue | A filled dot means the side chain, an open ring the backbone. |
| Blue arc on a ligand atom | Solvent exposure: the atom keeps at least 10 % of the surface it would have in the free ligand. |
The default threshold is 30 % (project key analysis.interaction_threshold, command-line option -threshold). On the Results page the Threshold box above the diagram changes it for the view. At most 18 residues are drawn; any others that pass are named in the caption.
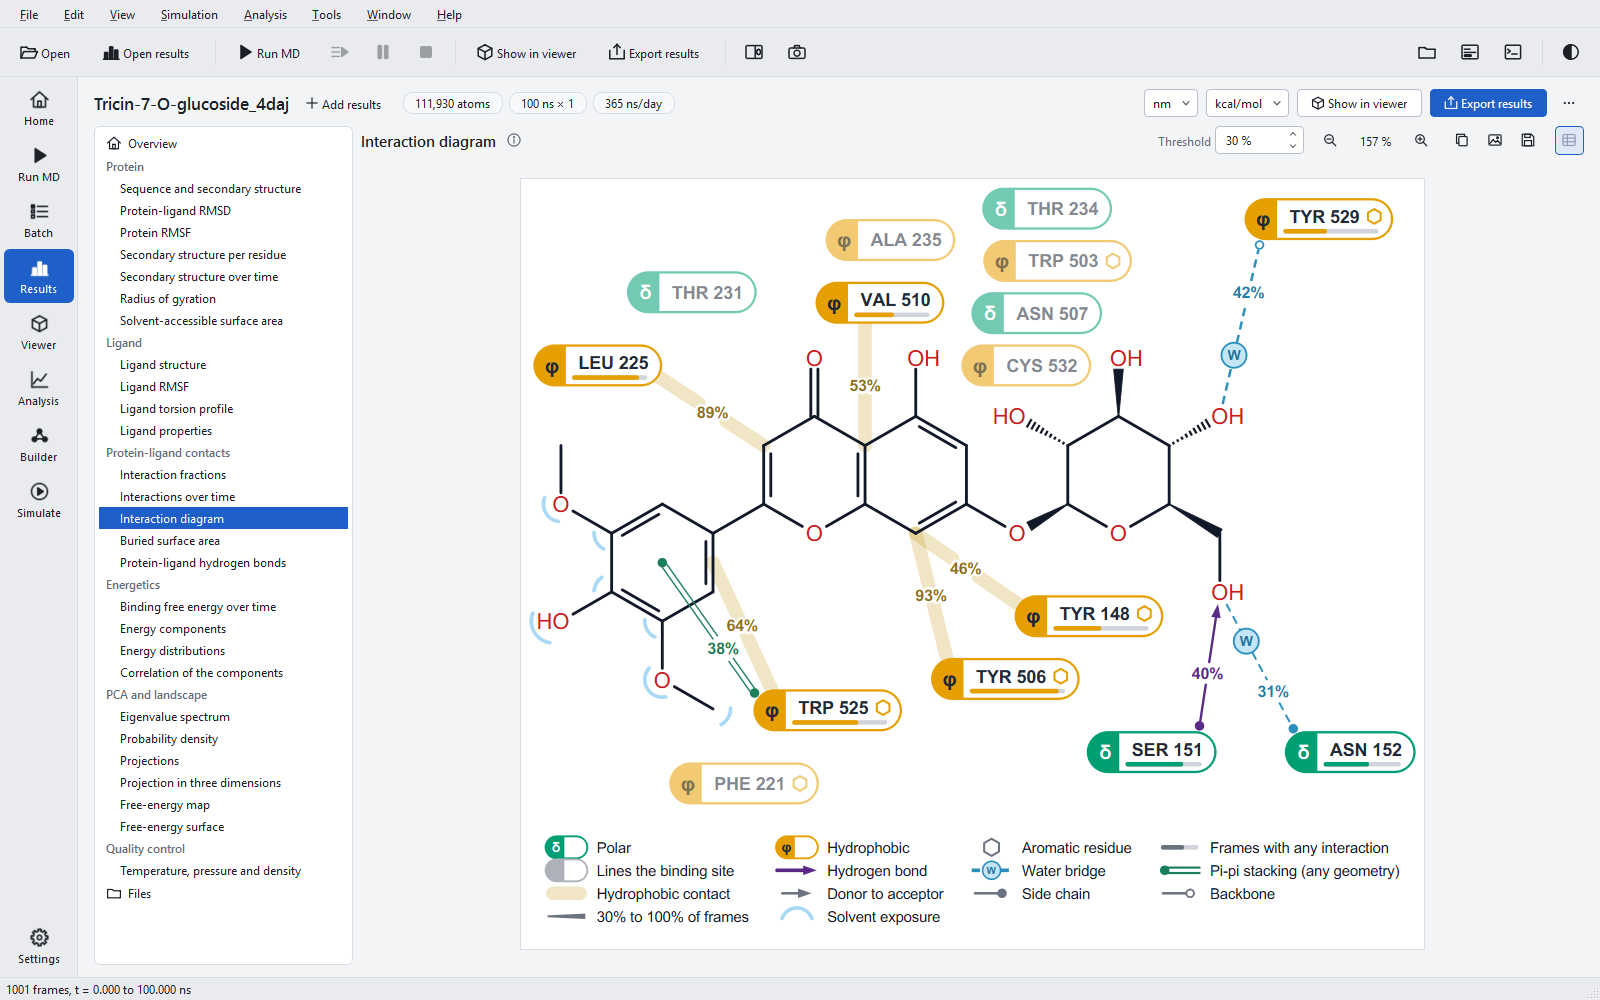
How to read it: start with the widest links, which are the interactions that hold the ligand for most of the run; then look at which part of the ligand they hold. In the example the planar flavone is held by hydrophobic contacts and the sugar by hydrogen bonds and water, a division of labour you would not see in the fractions chart. Exposure arcs show which groups point into the solvent and could be changed without losing contacts.
Interaction fractions
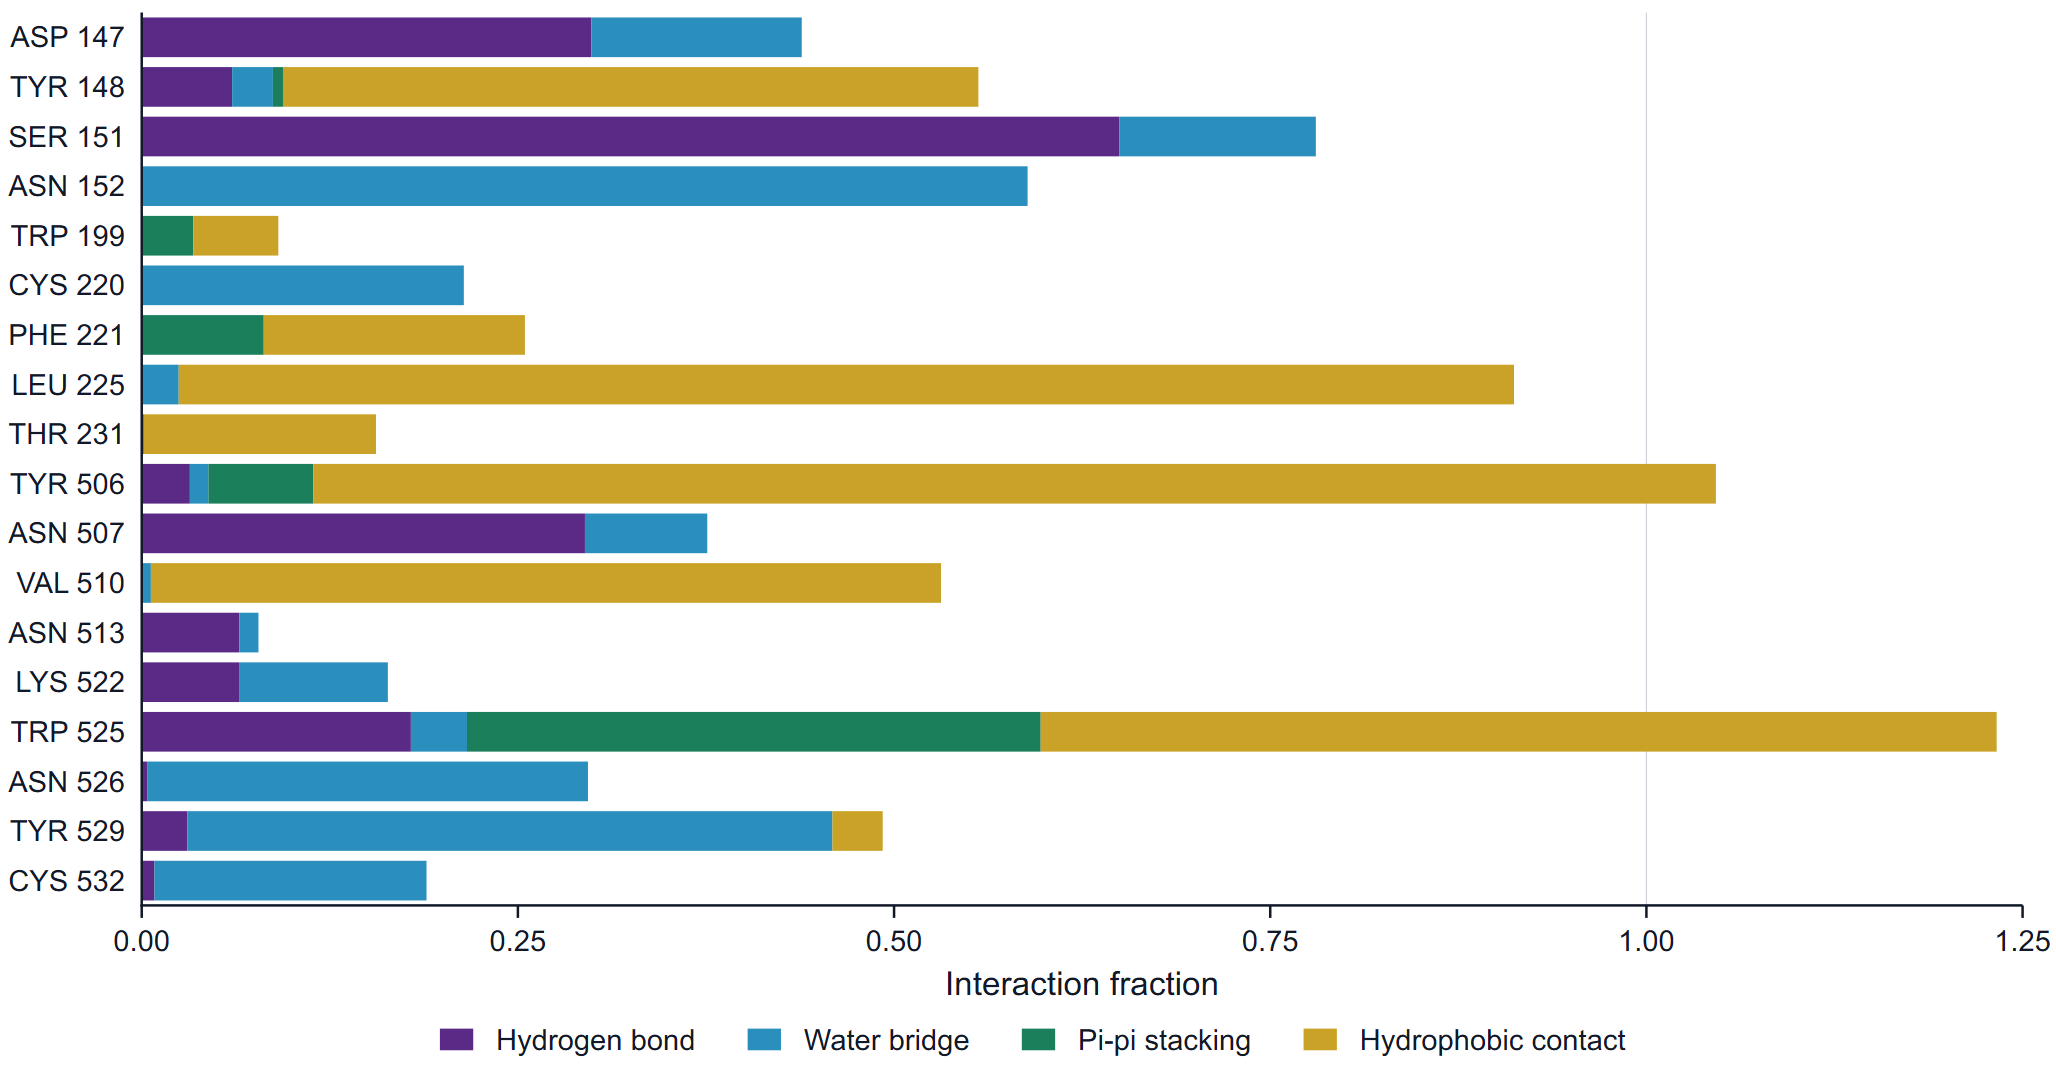
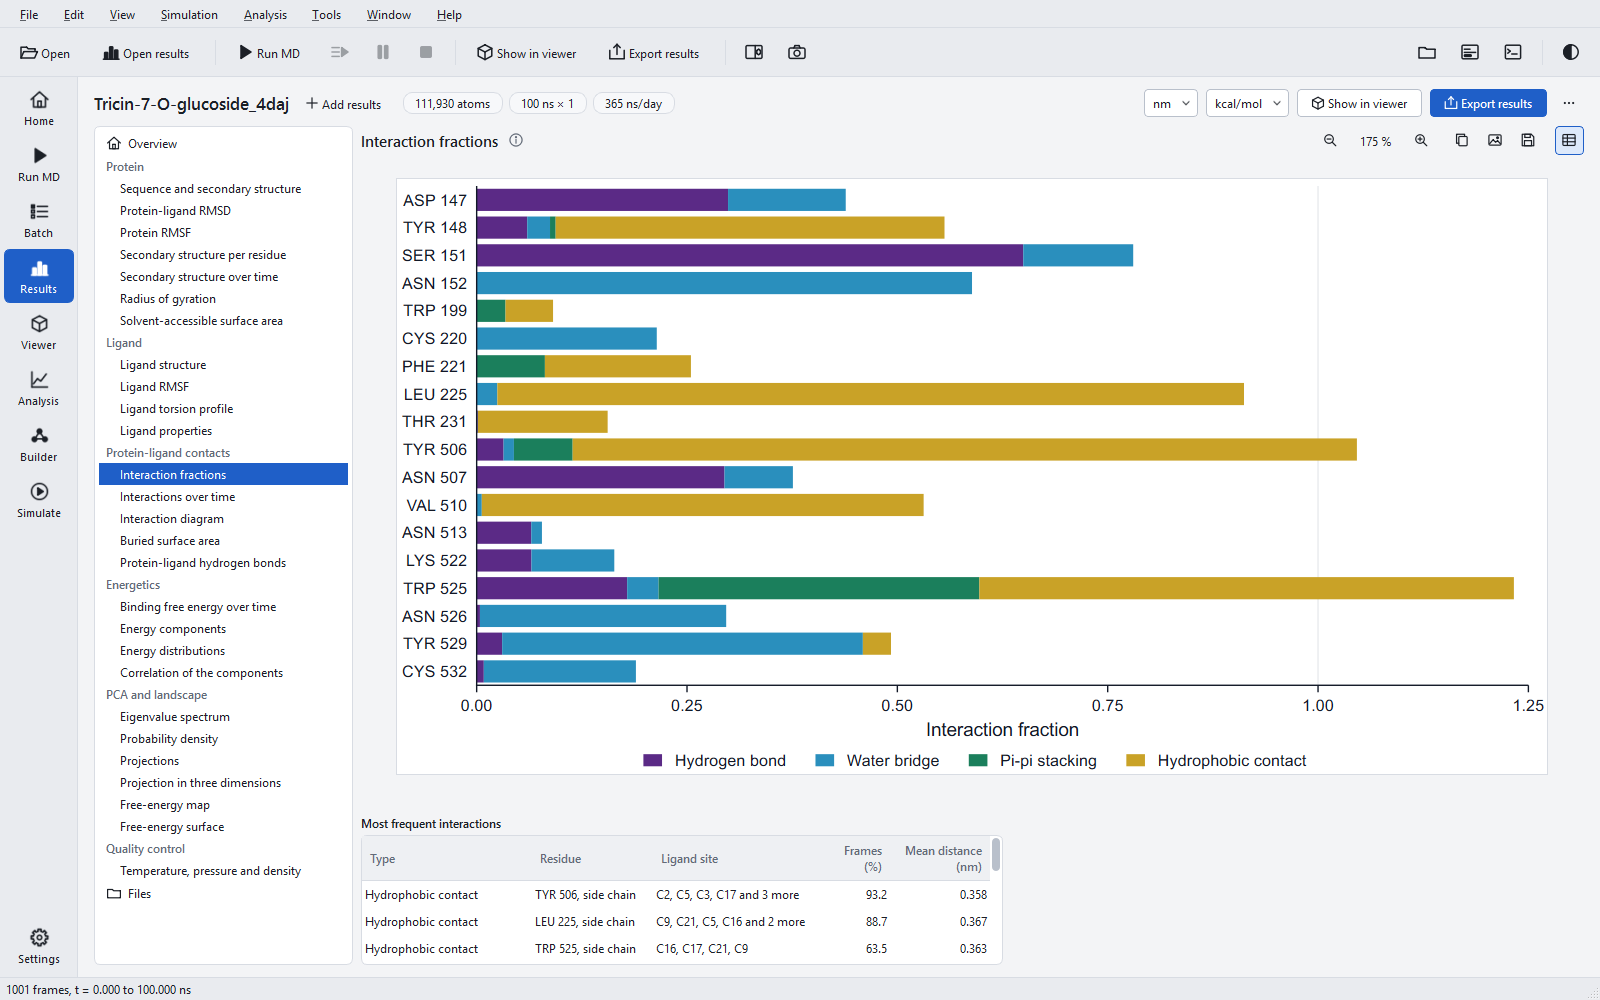
For every residue that interacts with the ligand in at least 5 % of the frames (at most 30 residues, the highest ones, in sequence order), the bar shows for each type the fraction of frames with at least one interaction of that type. The segments are stacked, so a bar can exceed 1: it adds types, not frames. The fraction of frames in which the residue makes any interaction at all is the bar under the residue label in the diagram and the contact track of the RMSF.
Interactions over time
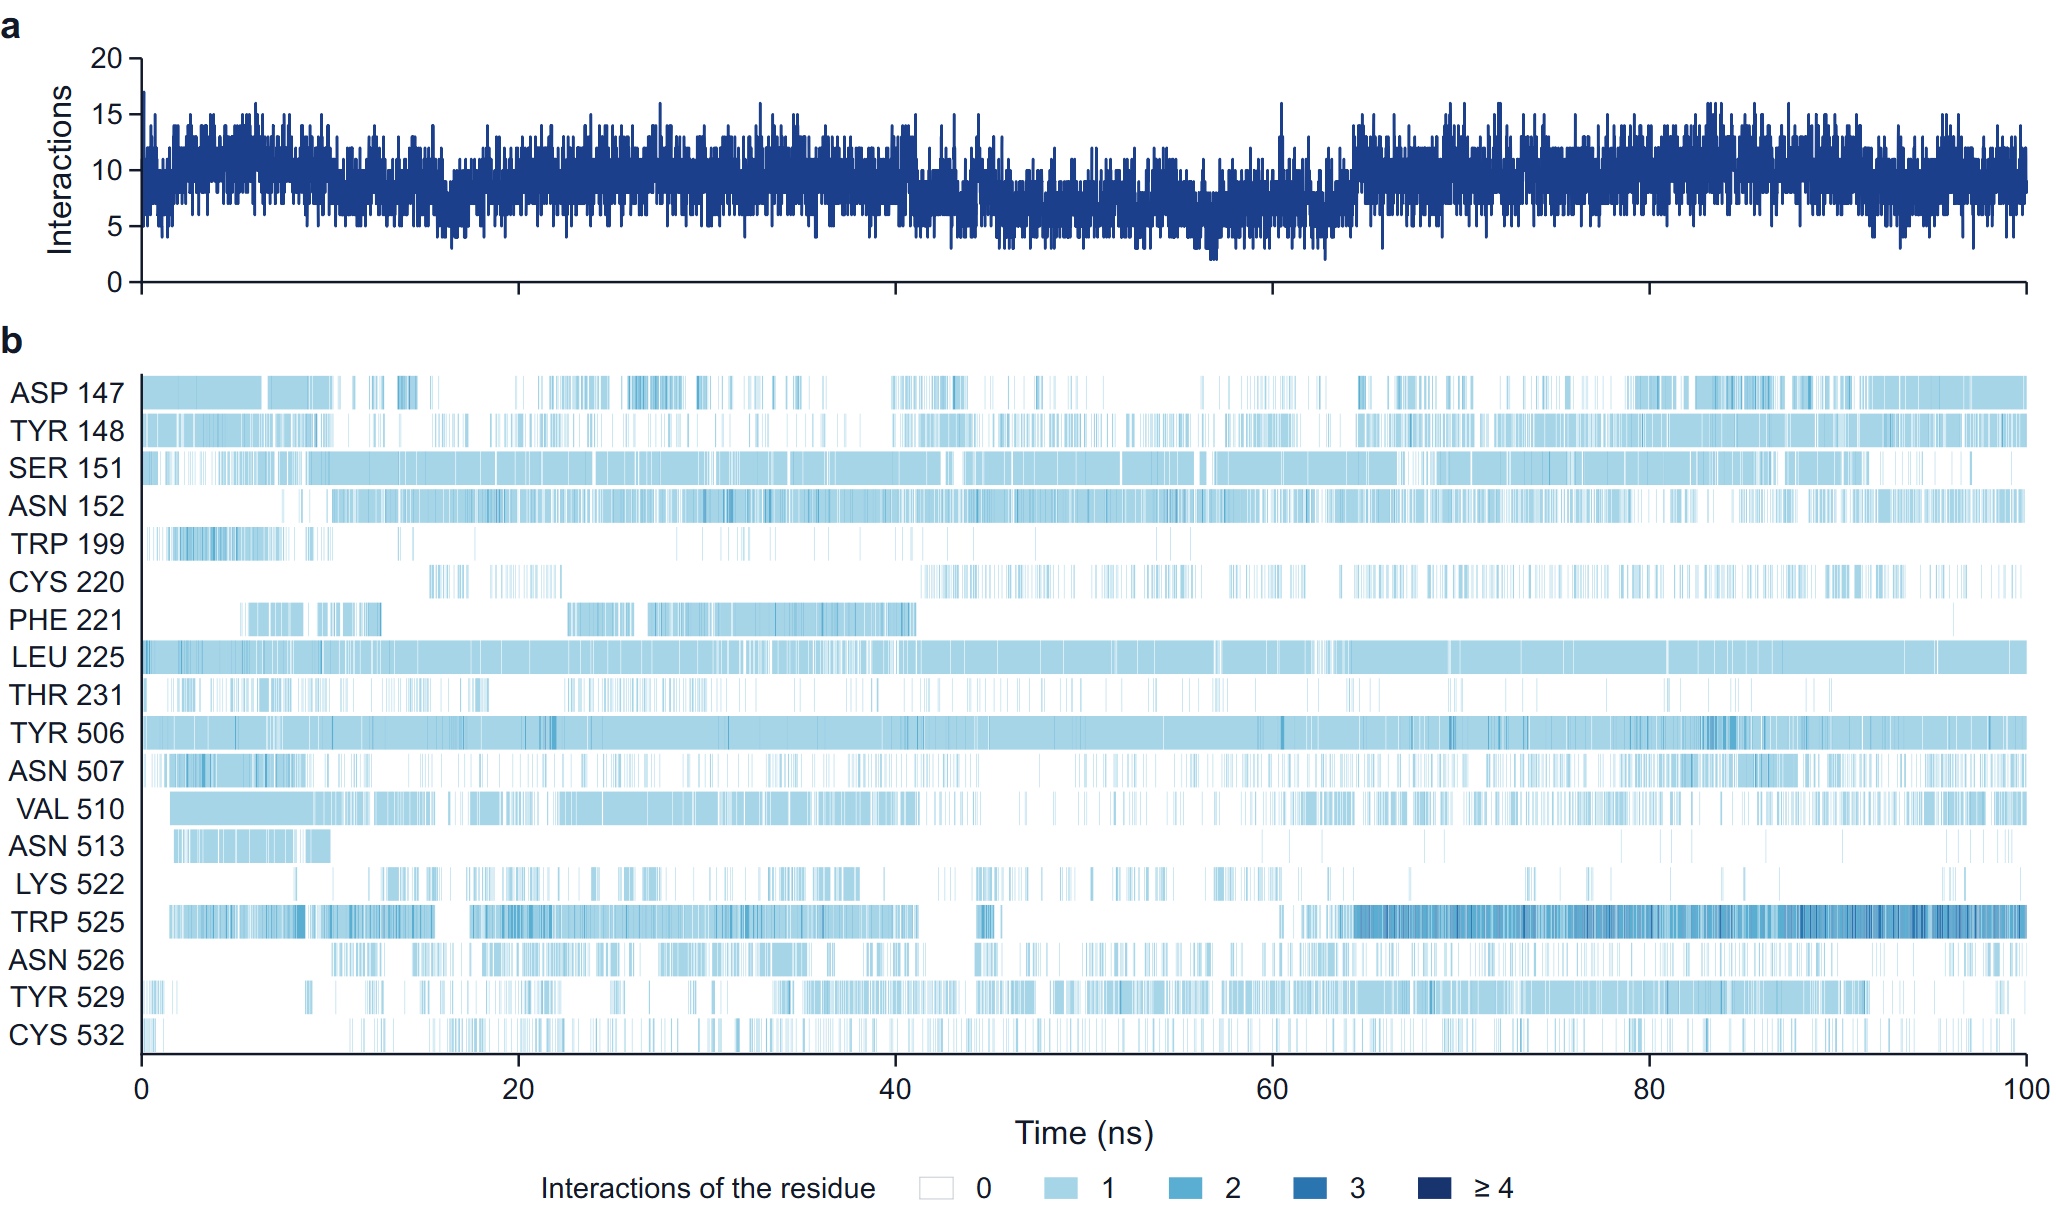
Panel a counts every interaction present in a frame, of every type. Panel b uses the residue rows of the fractions chart and colours each frame by the number of interactions the residue makes: 0, 1, 2, 3, or 4 and more. With more than 600 frames, frames are binned along time and a cell shows the rounded mean count of its bin.
How to read it: the time axis shows what the fractions hide. A residue at 50 % may be present half of the time throughout, or all of the time in one half of the run; only the second points to a change of binding mode. Rows that start or stop together are worth comparing with the ligand RMSD and the torsion profile.
The table of the most frequent interactions
The statistics table of the section lists the ten most frequent interactions with their Type, Residue (with side chain or backbone), Ligand site (the ligand atoms involved, in order of frequency), Frames (%) and Mean distance. The complete list of interactions, including both stacking geometries of a ring pair, is in raw-data/contacts_interactions.csv of the export.
Residue labels
Residues are labelled with their name and their number as in the input structure, for example "TYR 148", and insertion codes are kept ("SER 100A"). A chain prefix is added only when the protein has several distinct chain identifiers ("A:TYR 148"), and a molecule prefix ("A1:") only when the numbers of two molecules with the same identifier repeat, as in a homodimer. Rows and axes are always in sequence order. In 4DAJ, chain A is two molecules, A1 (64 to 259, 1001 to 1161, 482 to 485) and A2 (489 to 556), because residues 486 to 488 are missing from the crystal structure.
How the detection was validated
The detection was compared with established reference programs on trajectories of anionic ligands: all 93 hydrogen-bond triplets were found with identical frame counts, hydrophobic contacts agreed in 799 of 799 cases, and face-to-face stacking in 20 of 20 (one reference program found 18). Cationic ligands, ligand donors, halogen bonds, metal coordination and several copies of a ligand are covered only by constructed test geometries, not by comparison on real trajectories. Every export also compares the hydrogen bonds of the interaction analysis with the separate hydrogen-bond occupancy analysis of the job (rule interactions.hbond_table).