Comparing compounds
Several jobs in one view and one report: the comparison table, the overlays and the contact map of the compounds.
When several ligands have been simulated on the same receptor, the Results page and the export put them side by side: one table with the headline numbers of every compound, figures that draw all compounds on common axes, a contact map, and a combined report. The example compares dicyclomine and tricin 7-O-glucoside, both bound to the M3 receptor (4DAJ).
Opening several jobs
Any of these opens several jobs together:
- Add results in the header of the Results page, once per job;
- Add results folder in the … menu, or Open folder on a folder that contains several job folders, which is opened as a batch;
- Compare on the Batch page after a queue has finished.
The compound selector in the header switches every single-job figure to the chosen compound, and the Comparison group at the top of the navigation holds the figures that show all compounds.
The comparison tables
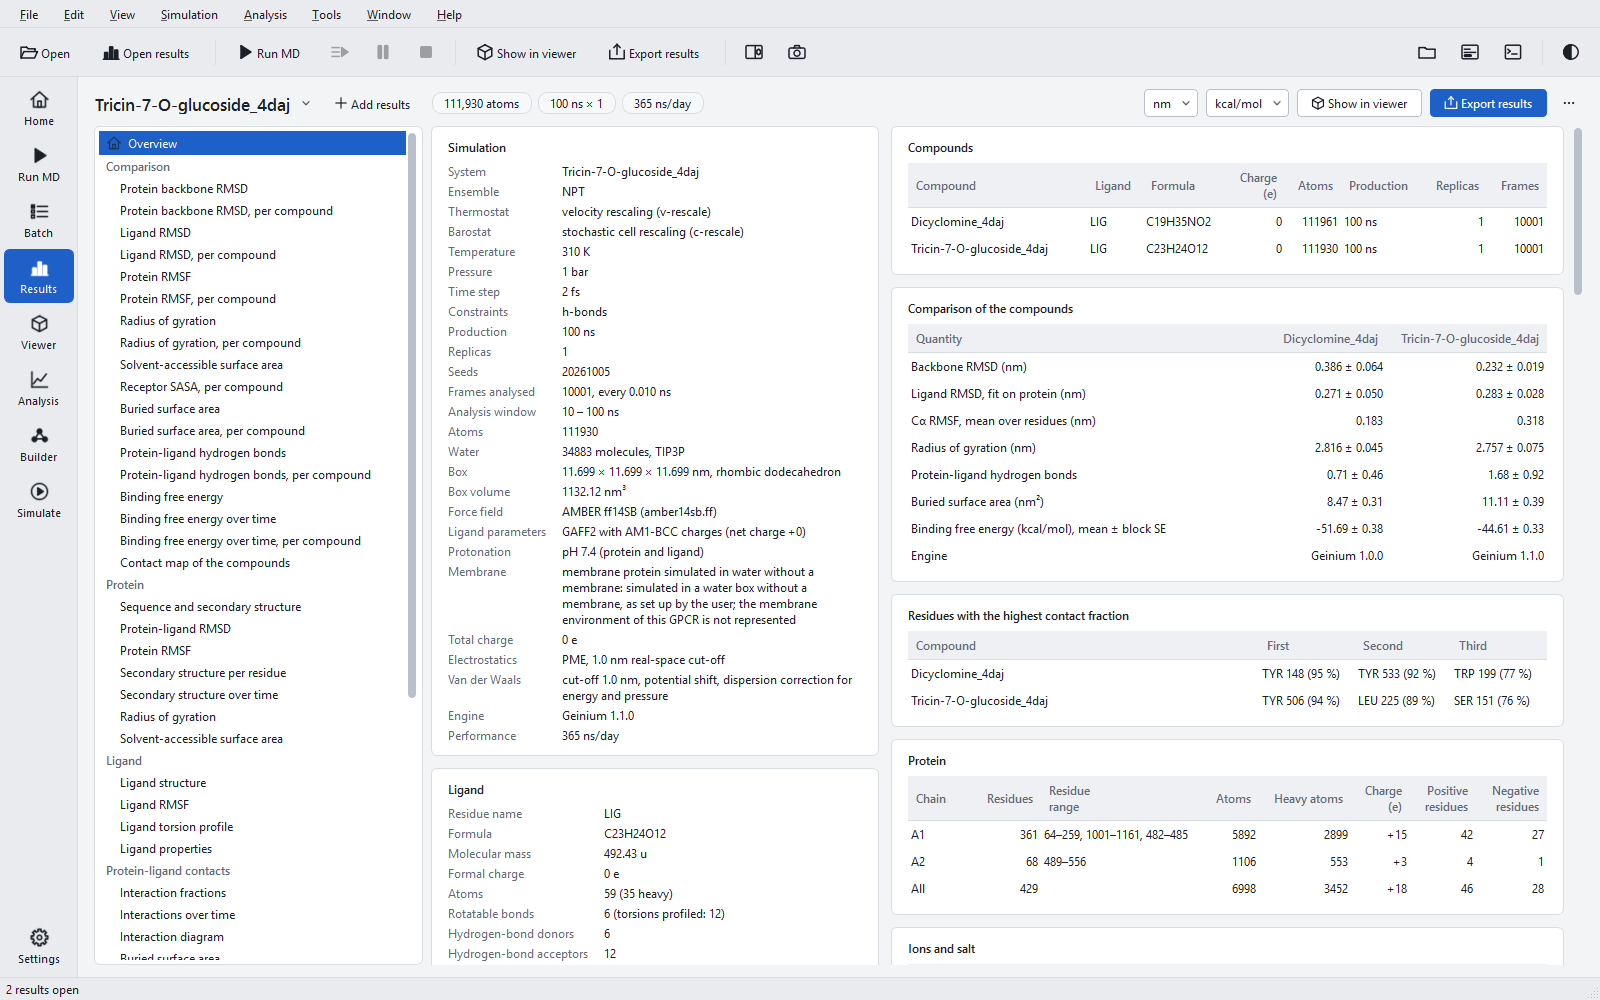
The overview of a batch adds three tables:
| Table | Rows | Notes |
|---|---|---|
| Compounds | One per compound: ligand residue, formula, charge, atoms, production length, replicas, frames. | Check that the jobs are comparable before reading any number. |
| Comparison of the compounds | Backbone RMSD; ligand RMSD after the protein fit; mean Cα RMSF over residues; radius of gyration; protein-ligand hydrogen bonds; buried surface area; binding free energy; Engine when the program versions differ. | Mean ± standard deviation over the analysed frames (or between replicas), and for the binding free energy mean ± block standard error. The note names the window of each compound. |
| Residues with the highest contact fraction | The three residues that interact with each ligand in the largest fraction of frames. | A quick check whether the ligands occupy the same sub-pocket. |
The same table is written to raw-data/comparison.csv with one row per compound and three more decimals than the report prints; every number of it is checked against the raw data of its compound when the package is written.
Comparison figures
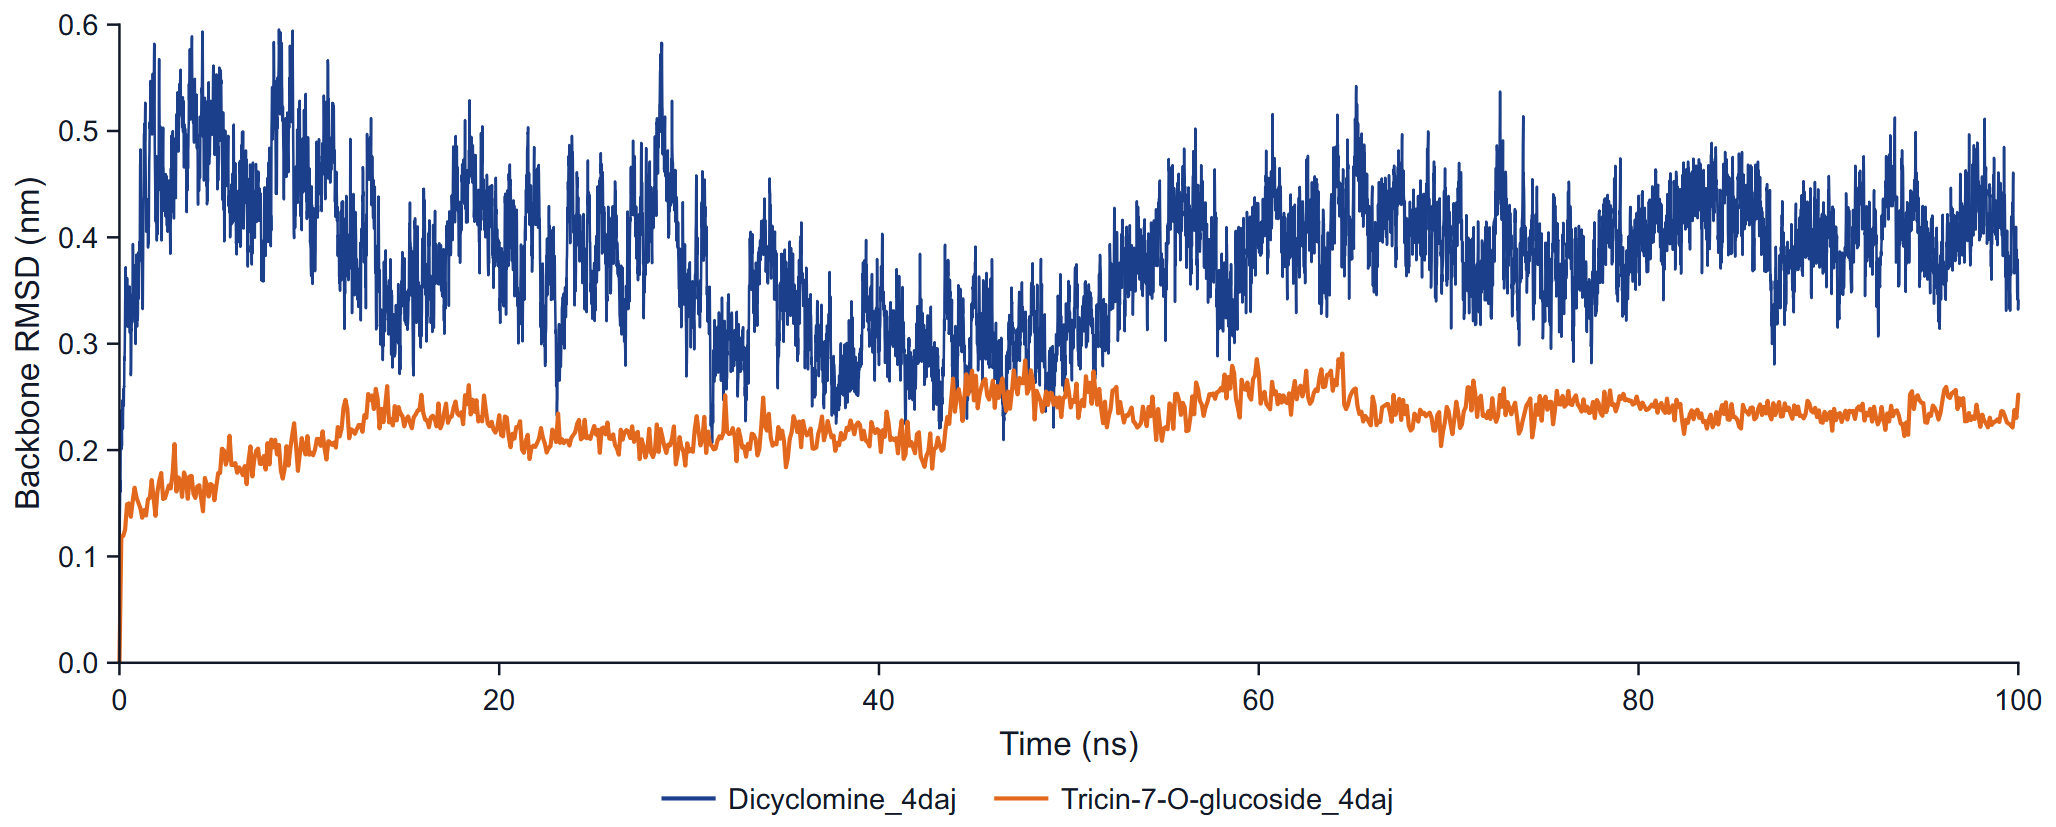
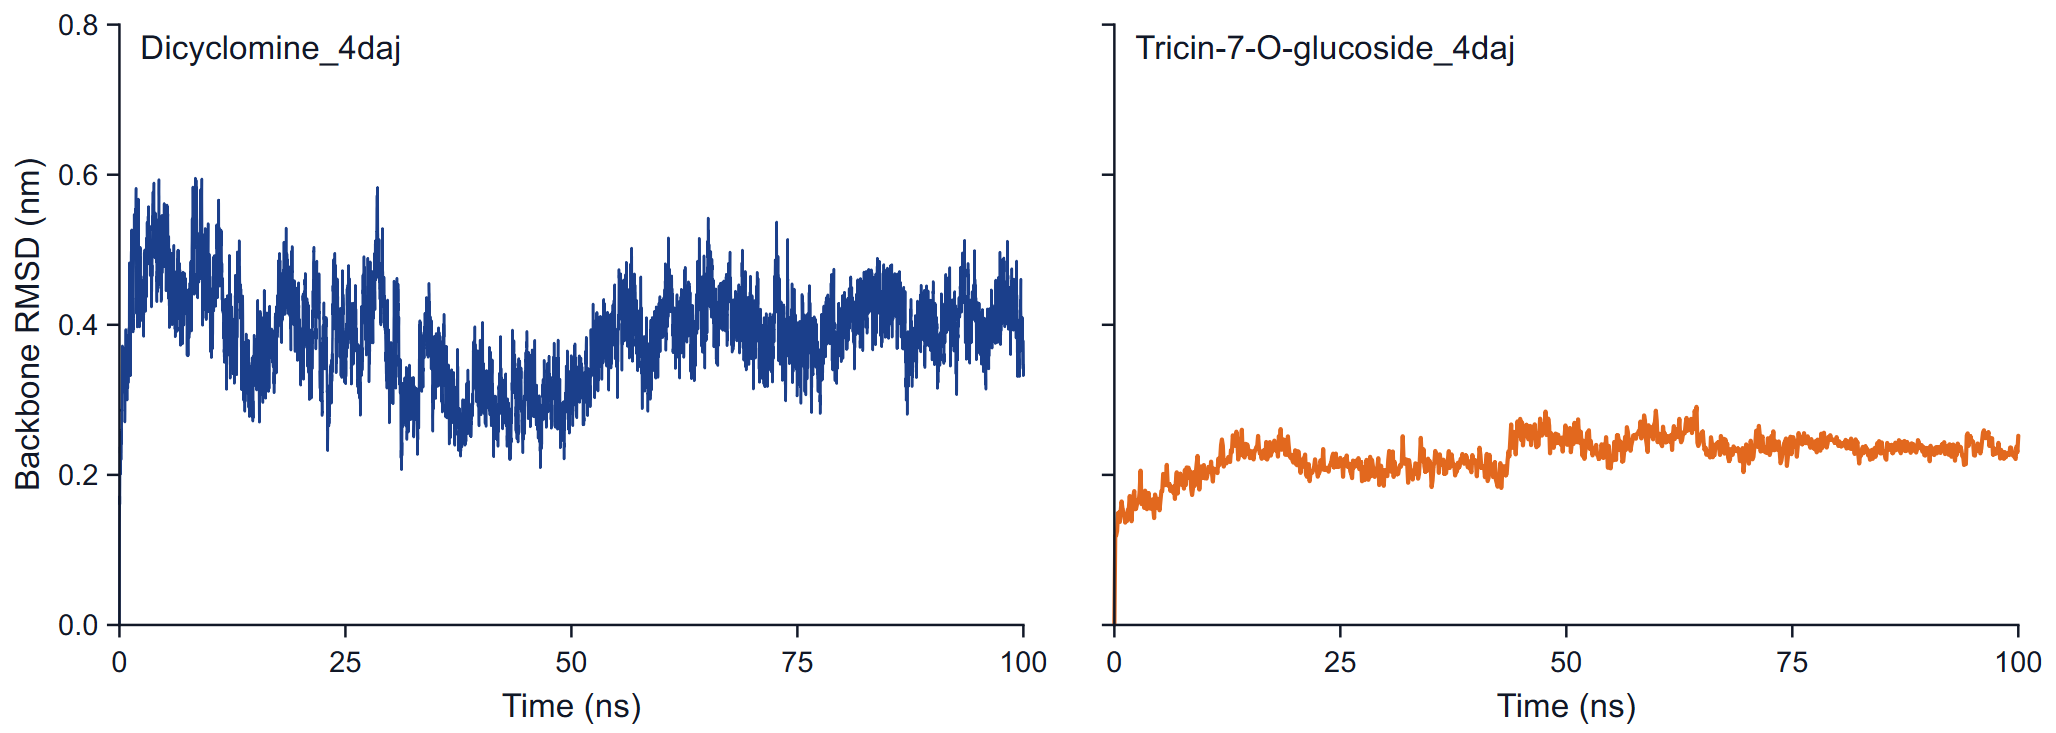
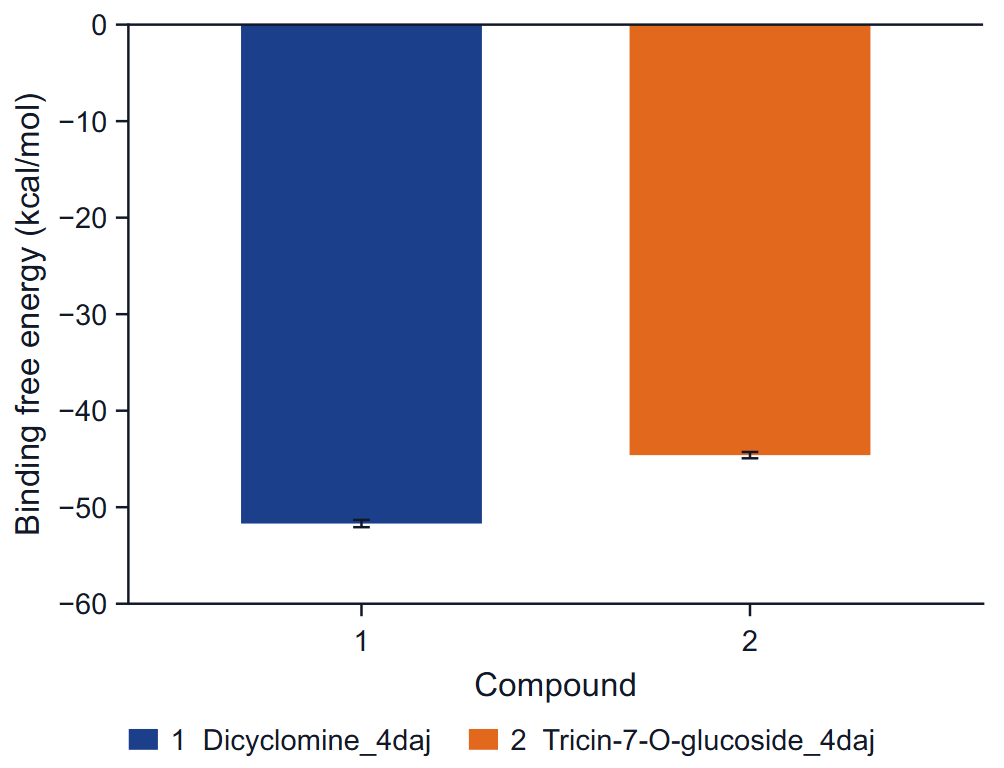
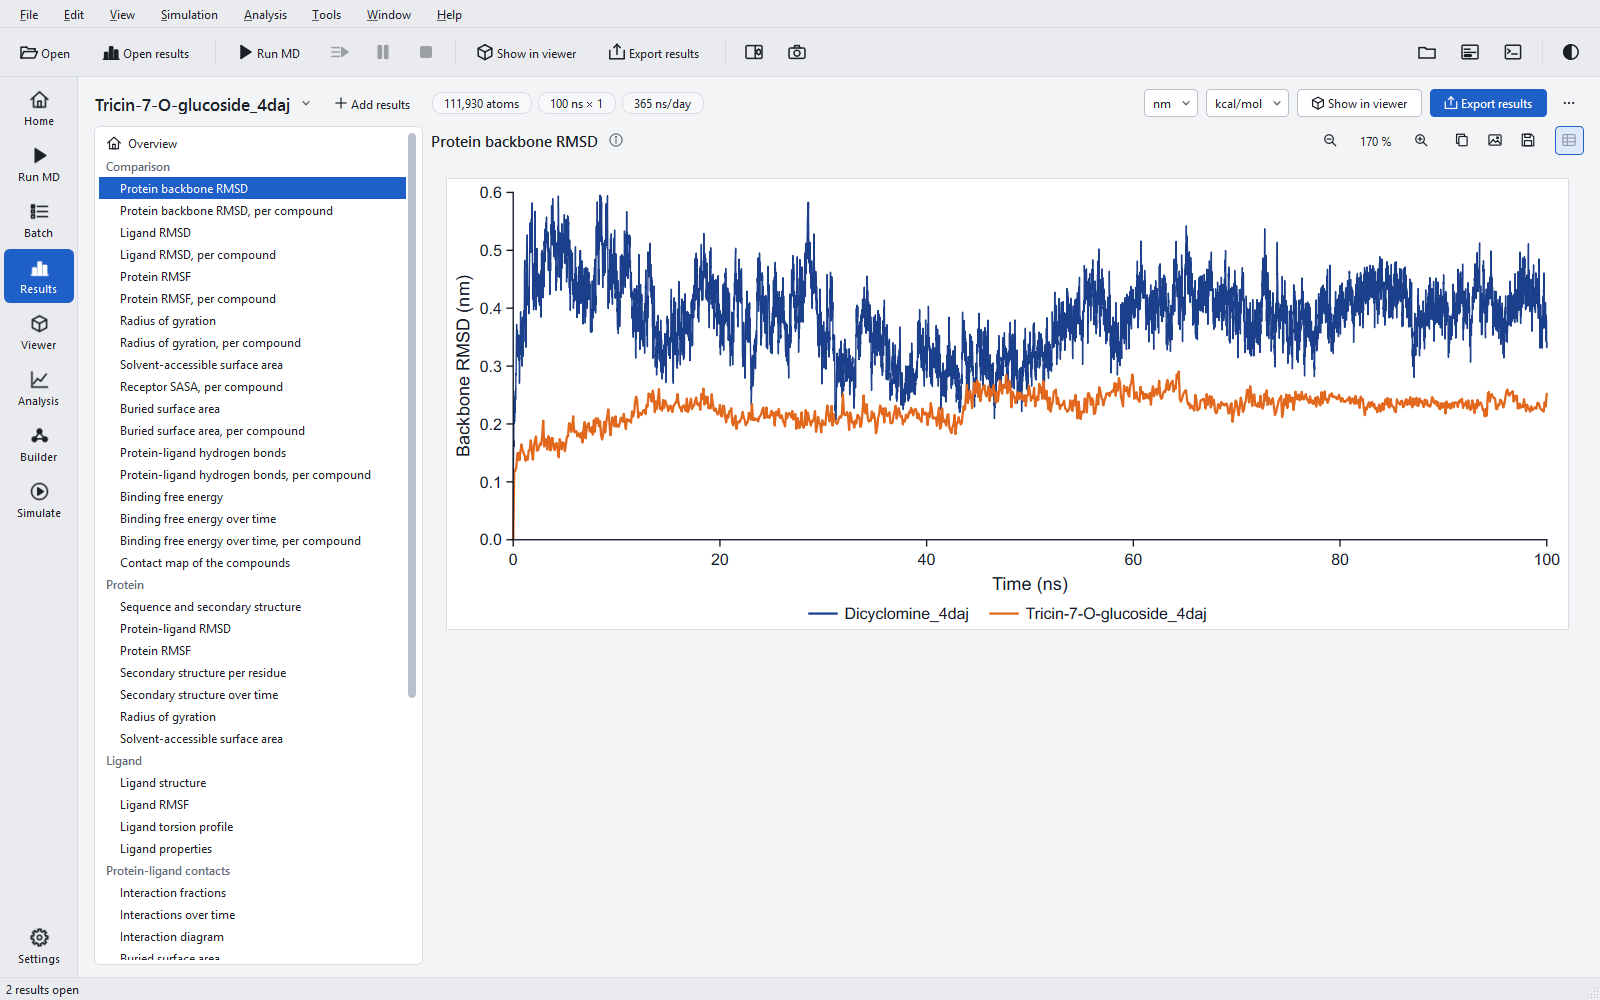
For eight quantities there are two figures each: all compounds in one graph, and one panel per compound on a common y range. The quantities are the protein backbone RMSD, the ligand RMSD after the protein fit, the Cα RMSF, the radius of gyration, the receptor SASA in the complex, the buried surface area, the protein-ligand hydrogen bonds and the binding free energy over time. Two more figures complete the set: the mean binding free energy as bars, and the contact map. Each compound keeps one colour and dash in every figure. The comparison panels draw no window line.
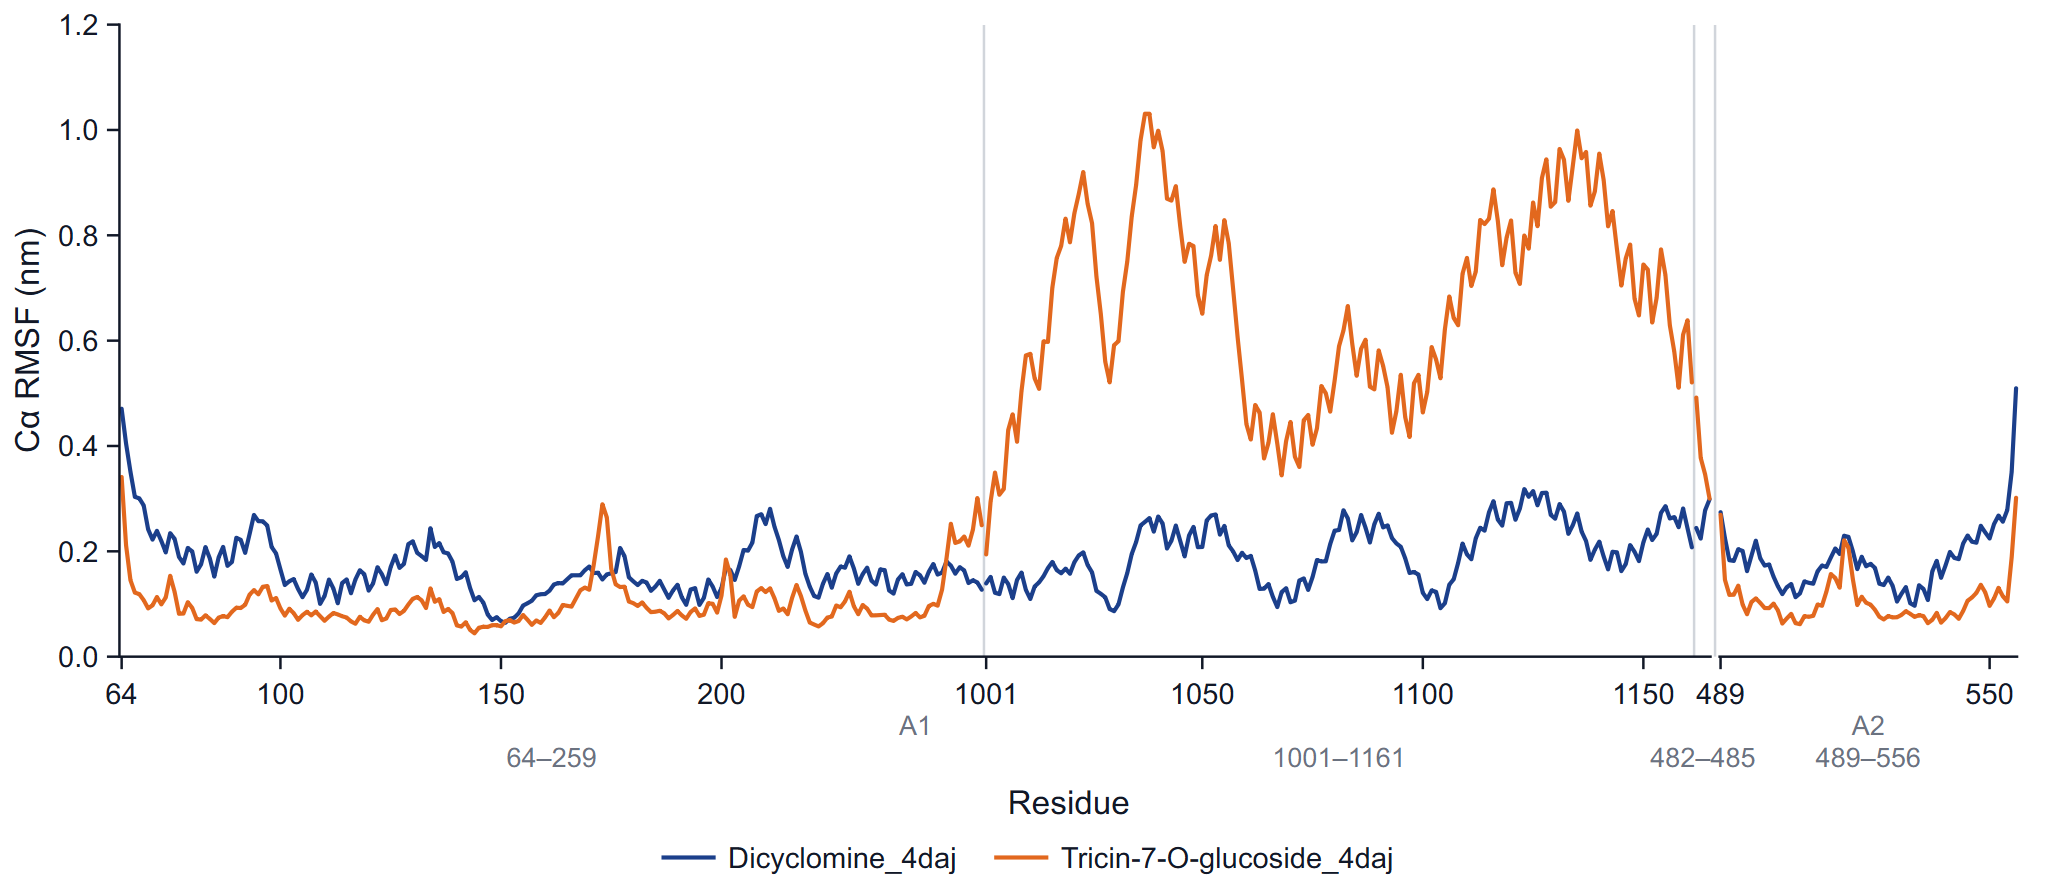
The RMSF overlay compares residue by residue, so compounds are overlaid only when their receptors are the same (the same chain identifiers, sequences and residue numbers). Compounds on different receptors get one panel per receptor on a common RMSF scale.
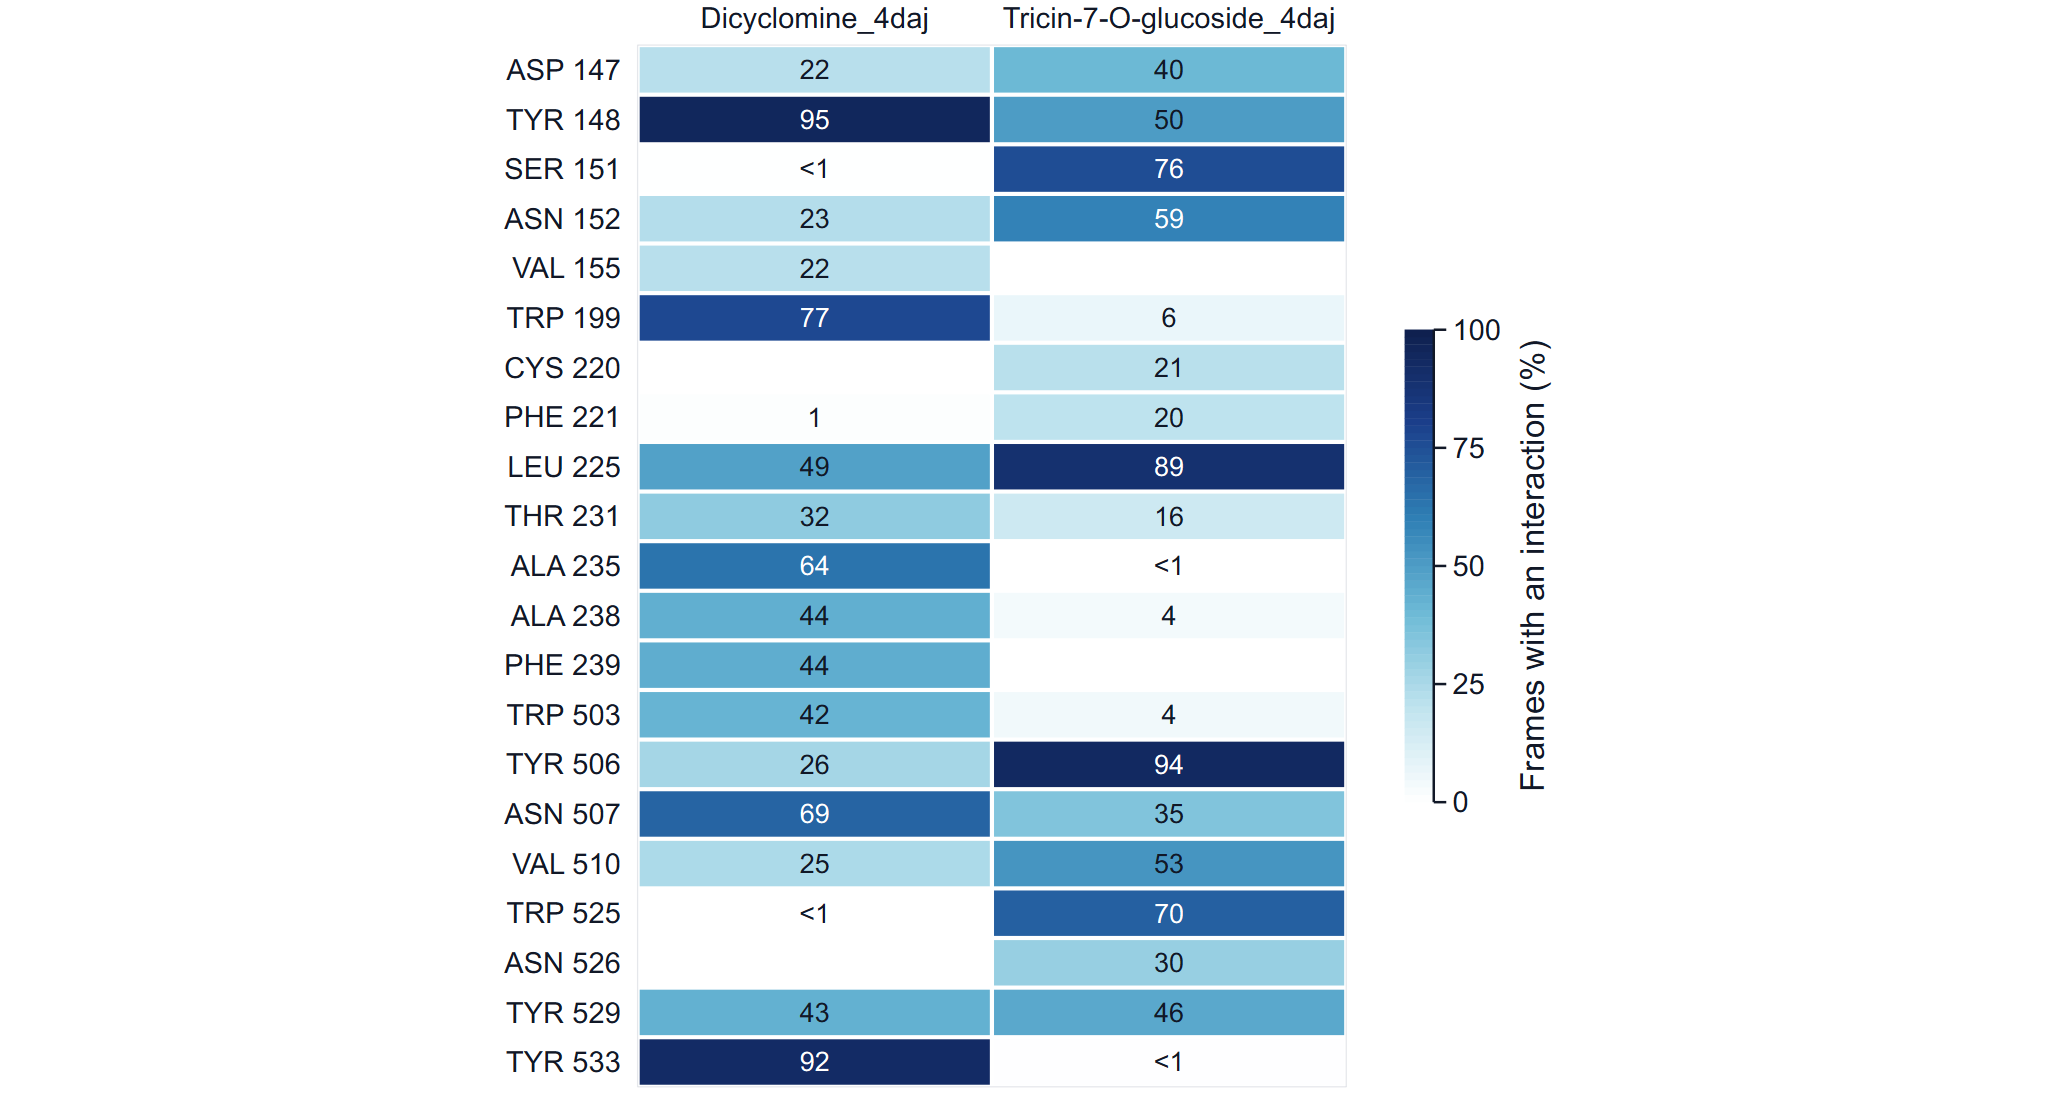
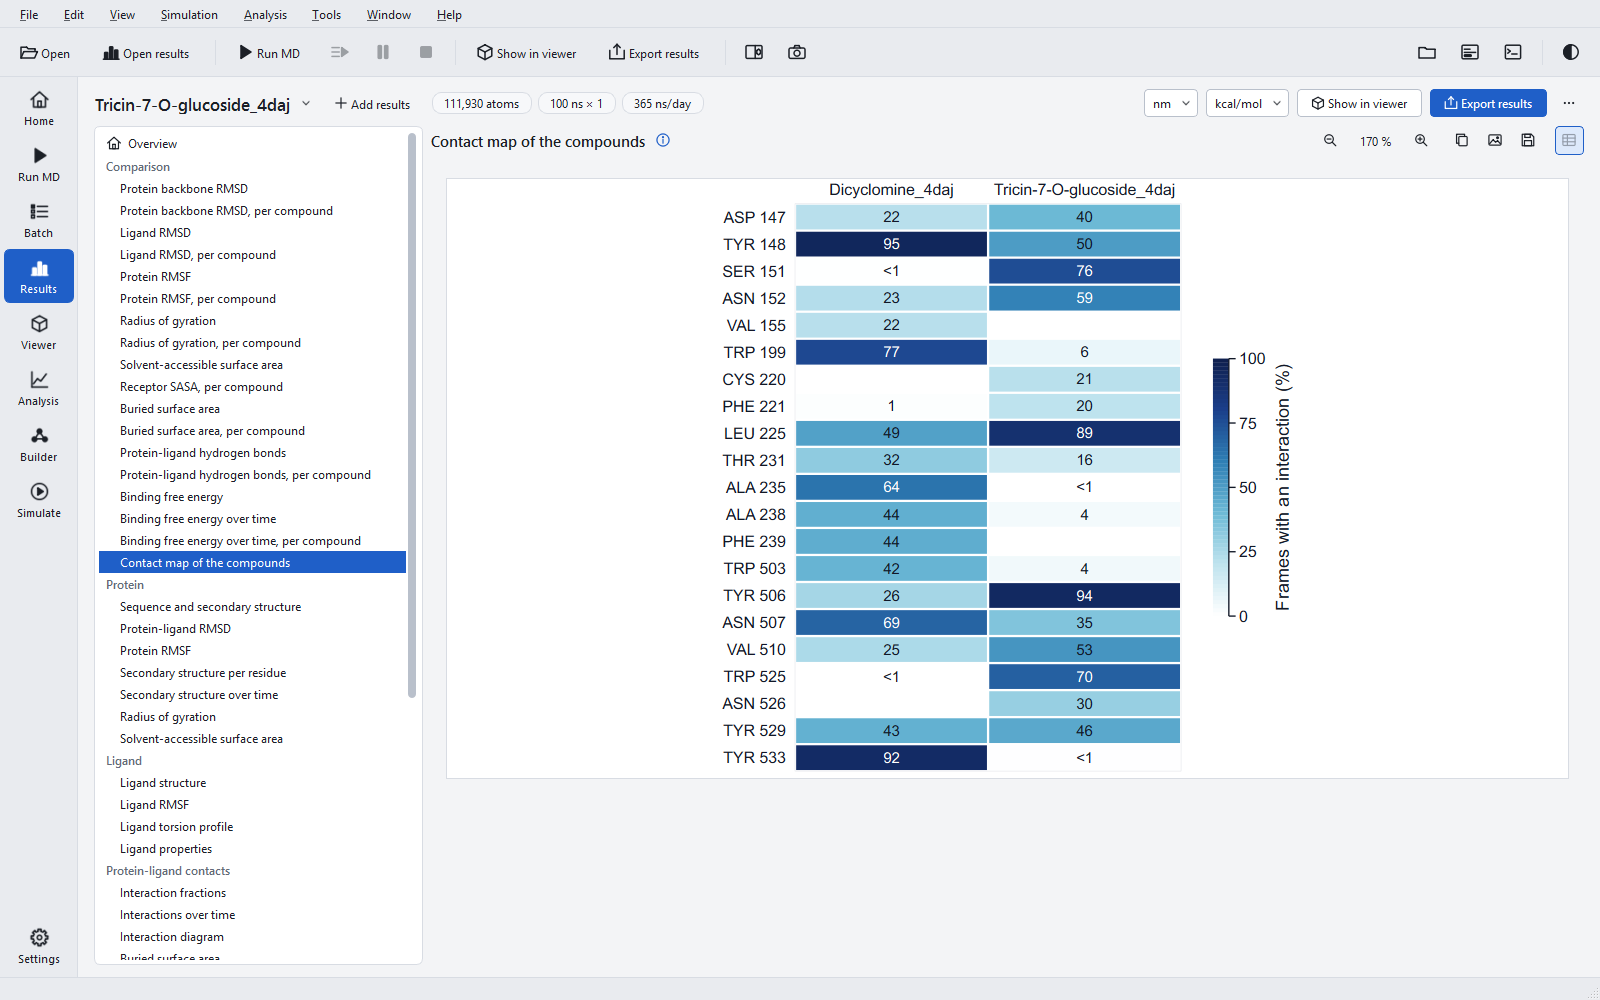
The rows of the contact map are the residues that interact with at least one compound in 20 % or more of the frames (at most 40), in sequence order; the colour and the printed number are the fraction of frames with any interaction, as in the bar under a residue label of the interaction diagram.
The combined report and package
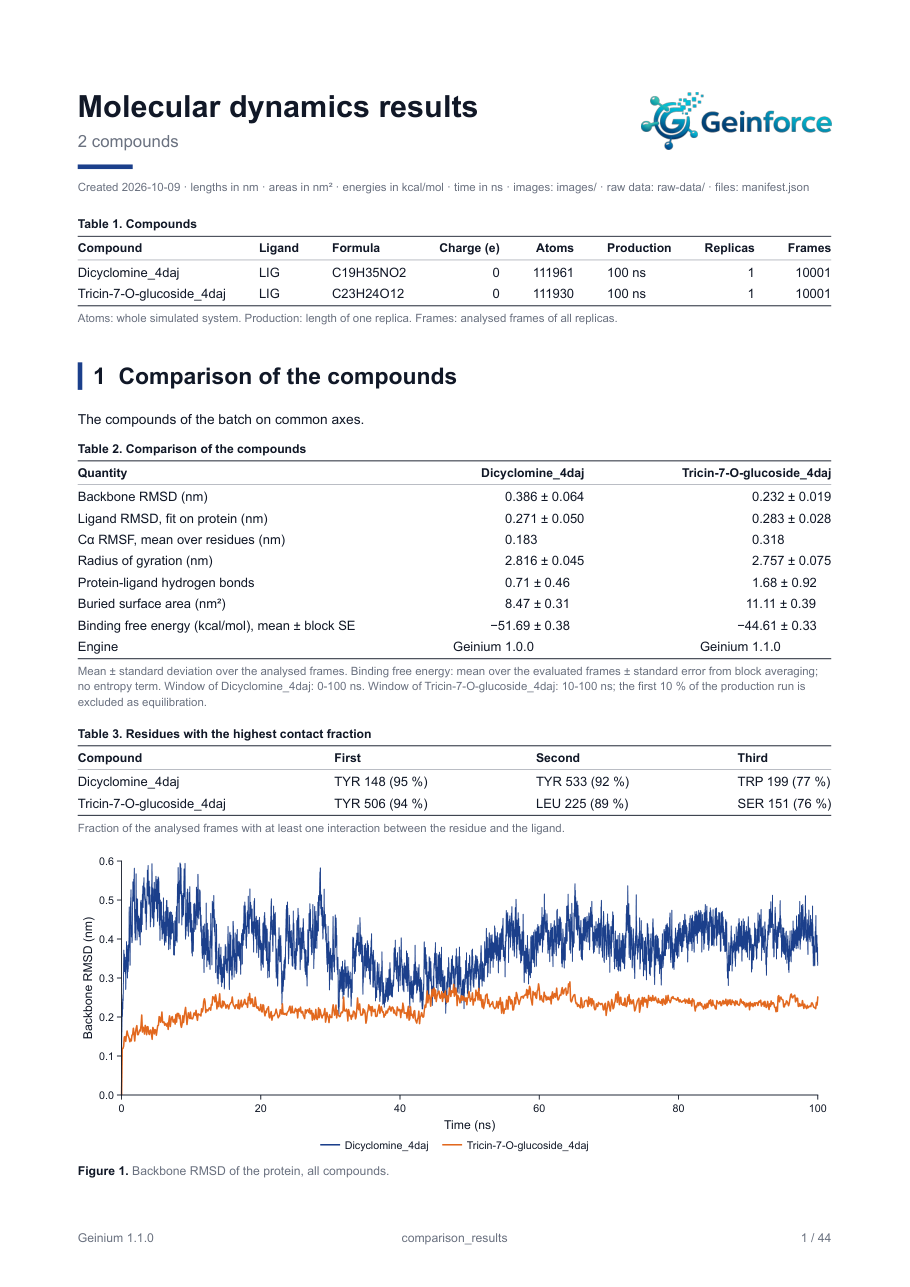
Several jobs exported together give one package with one report. Page 1 carries the Compounds table; chapter 1, "Comparison of the compounds", holds the comparison table, the contact residues and all comparison figures; then follows one chapter per compound with exactly the content of a single-job report. The package holds the comparison figures in images/, raw-data/comparison.csv, the manifest, the report, and one folder per compound with its own images, raw data and manifest. The option -compound-reports of the command line adds a separate report to each compound folder. The default package name is comparison_results.
In the application, Export results with several jobs open shows the job list with One combined report checked. When a Batch queue finishes two or more jobs, a combined package of the batch is written next to the job folders automatically (a setting, on by default). See Exporting results.
Fair comparisons
- Same receptor construct. The same chains, residues, modelled loops, protonation and insert. The RMSF overlay refuses different receptors; the other figures do not.
- Same protocol. Same force field, temperature, length, statistics window and number of replicas. The window and the program version are printed per compound for this reason.
- Same analysis version. Recompute old jobs first; definitions such as the fit group changed between versions, as the example shows.
- Replicas. With one replica per compound, differences in RMSD or binding free energy smaller than the spread you would see between replicas are not meaningful. Three replicas per compound is the minimum the scientific checks ask for.
- Ligands that leave. A ligand that leaves the site during the run is still averaged over all frames; its numbers then describe a mixture. The export log warns, and the ligand RMSD panel shows it.