The Simulate page
Running a protocol of the System Builder, a single run input or a project pipeline, and following any run log.
Run MD and the Batch queue cover the complete protocol from a complex. The Simulate page is for everything else that runs: a system built on the System Builder, a single run input prepared by hand or on the command line, a project run stage by stage, an external command, or the log of a run started elsewhere. While Run MD or the Batch queue runs a job, the Simulate page cannot start another one.
Modes
| "Mode" | Input | What it does | When to use it |
|---|---|---|---|
| "Protocol queue" | protocol.json, written by the System Builder | Runs the stages of the built system (minimisation, equilibration, production for each replica) on the built-in engine. A line reports "n replicas, m stages". | After a build: a finished build loads its protocol here automatically. |
| "Single run input" | A run input (.mdtpr) | Runs it on the built-in engine; output files are written next to the run input. | A run input made with mdsim grompp from your own parameter files. |
| "Log monitor" | A run log (.log) | Follows the log of a running or finished run and plots its energies. It starts nothing. | To watch a run started from the command line or on another page, or to look again at the energies of a finished stage. |
| "External command" | A working folder, a command line and the log file it writes (default md.log) | Starts the command and follows its log. The command defaults to mdsim.exe mdrun -deffnm md in the program folder, or to the command set in Settings > Runs > "External command". | To run mdsim with options the page does not offer, and still see the plots. |
| "Project pipeline" | A project file (project.json), a target and "Dry run" | Runs the pipeline of the project up to the chosen target: "Everything", "Preparation", "To equilibration", "To production" or "To analysis". "Dry run" writes the plan to the log and executes nothing. A line reports the number of stages and how many are done. | To prepare a system and stop before production, or to run a project stage group by stage group. |
The mode cannot be changed while a run is going; stop it first.
Live frames
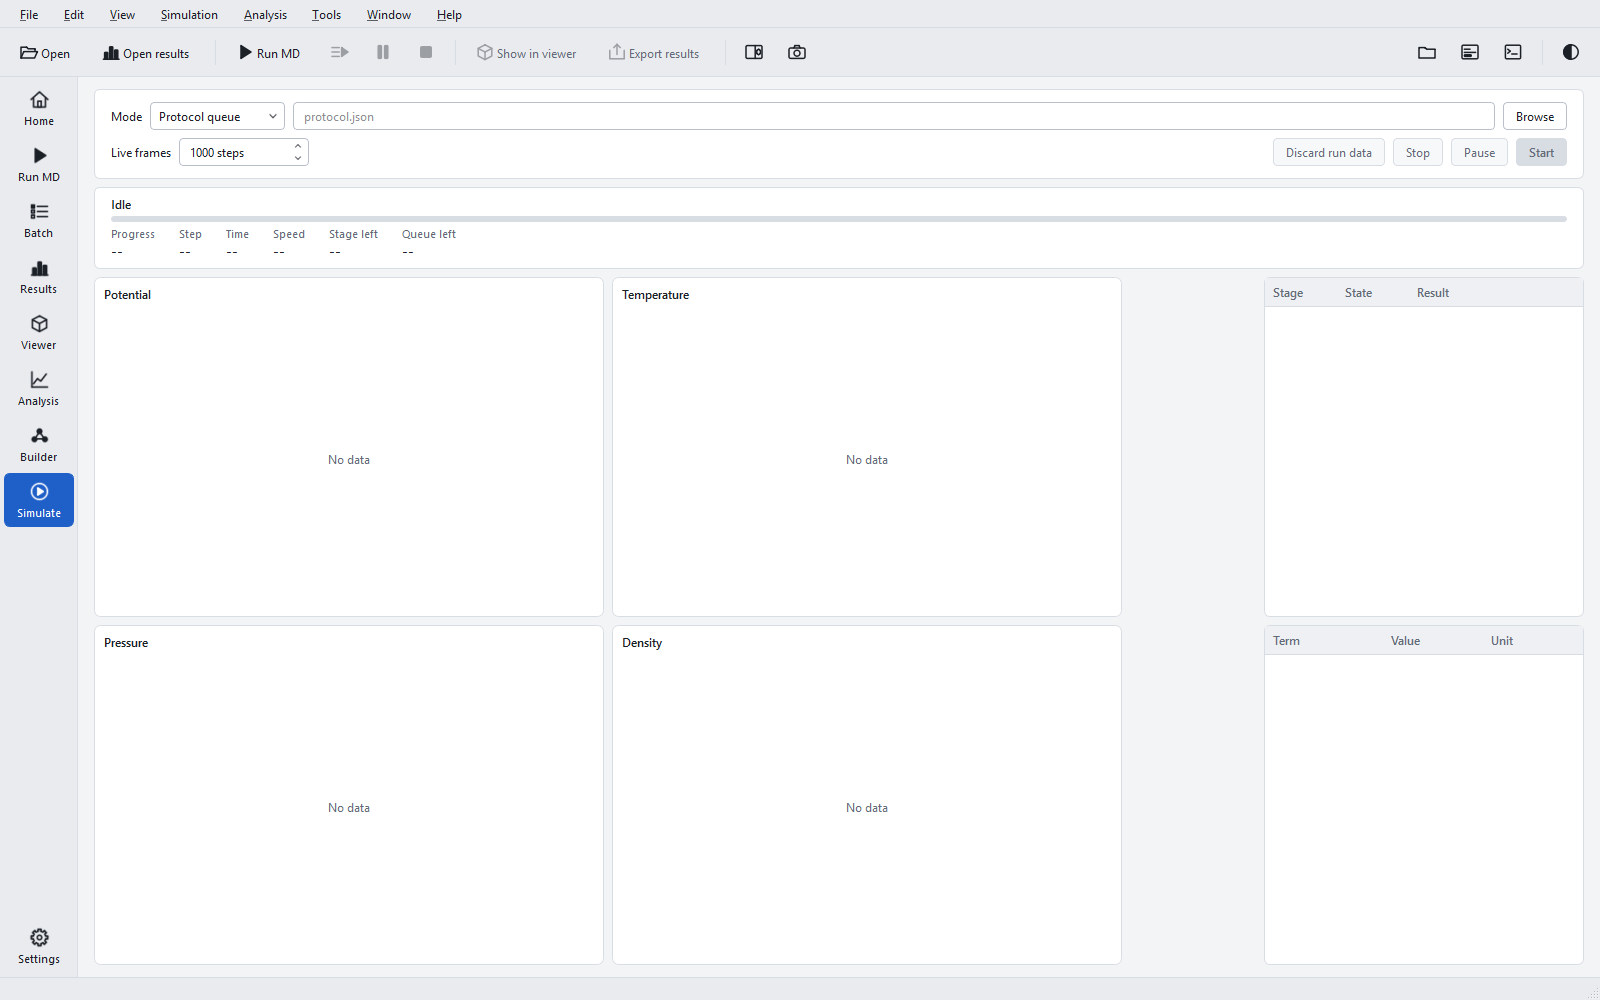
"Live frames" (default 1000 steps; 0 means "Off") is the interval at which coordinates are sent to the viewer during a run of the built-in engine, in the "Protocol queue" and "Single run input" modes. A short interval makes the motion smoother in the viewer and costs a little speed; switch it off for the fastest run. In the other modes the setting does not apply.
Start, Pause, Stop, Discard run data
| Button | What it does | When to use it |
|---|---|---|
| "Start" | Starts or continues the run. Its tooltip says what is missing ("Load a protocol first", "Choose a run input", "Choose a project"). | To run. |
| "Pause" / "Resume" | Stops at the next checkpoint; "Resume" continues from there. "Not available in this mode" where the mode cannot pause. | To free the PC without losing work. |
| "Stop" | Ends the run. | When the run is not wanted any more. |
| "Discard run data" | In "Protocol queue" mode, deletes the run folder of the protocol after asking "Delete <run> with all trajectories, energies and checkpoints?", and reloads the protocol. | To start a protocol again from the beginning. This cannot be undone. |
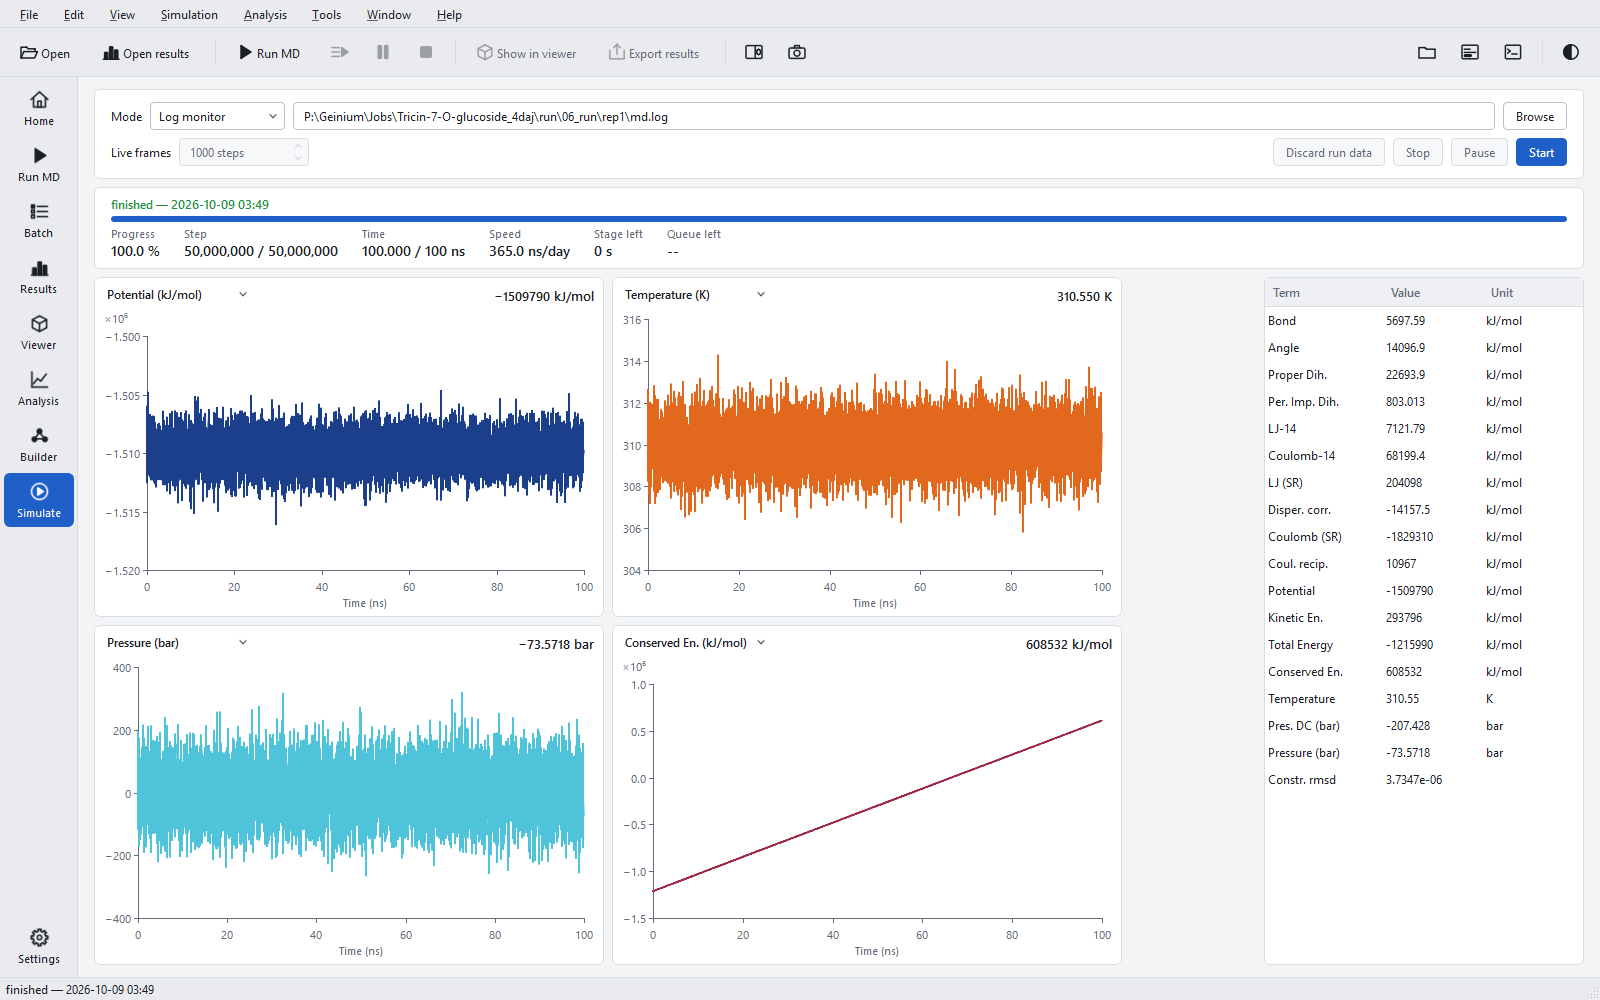
Below the controls, a status card gives the state ("Idle", running, finished with its time), the stage, a progress bar and the values "Progress", "Step", "Time", "Speed" (its tooltip says whether the value was measured by the engine or estimated from the progress), "Stage left" and "Queue left". If a stage has to run on the CPU engine, a line in orange says so: "<stage> runs on the CPU: <reason>".

Following a log
The four plots work as on the monitor of Run MD (see Monitoring a running job), with one addition: the selector in the title of each plot chooses which energy term it shows, and the choice is kept for the following stages. On the right, the stage table lists the stages of a protocol or project ("pending", "running", "done", "checkpoint", "failed"), and the "Term / Value / Unit" table lists every term of the latest energy frame of the log.