Ligand analyses
The flexibility of the ligand atom by atom, its rotatable bonds over time, and its size, shape and surfaces.
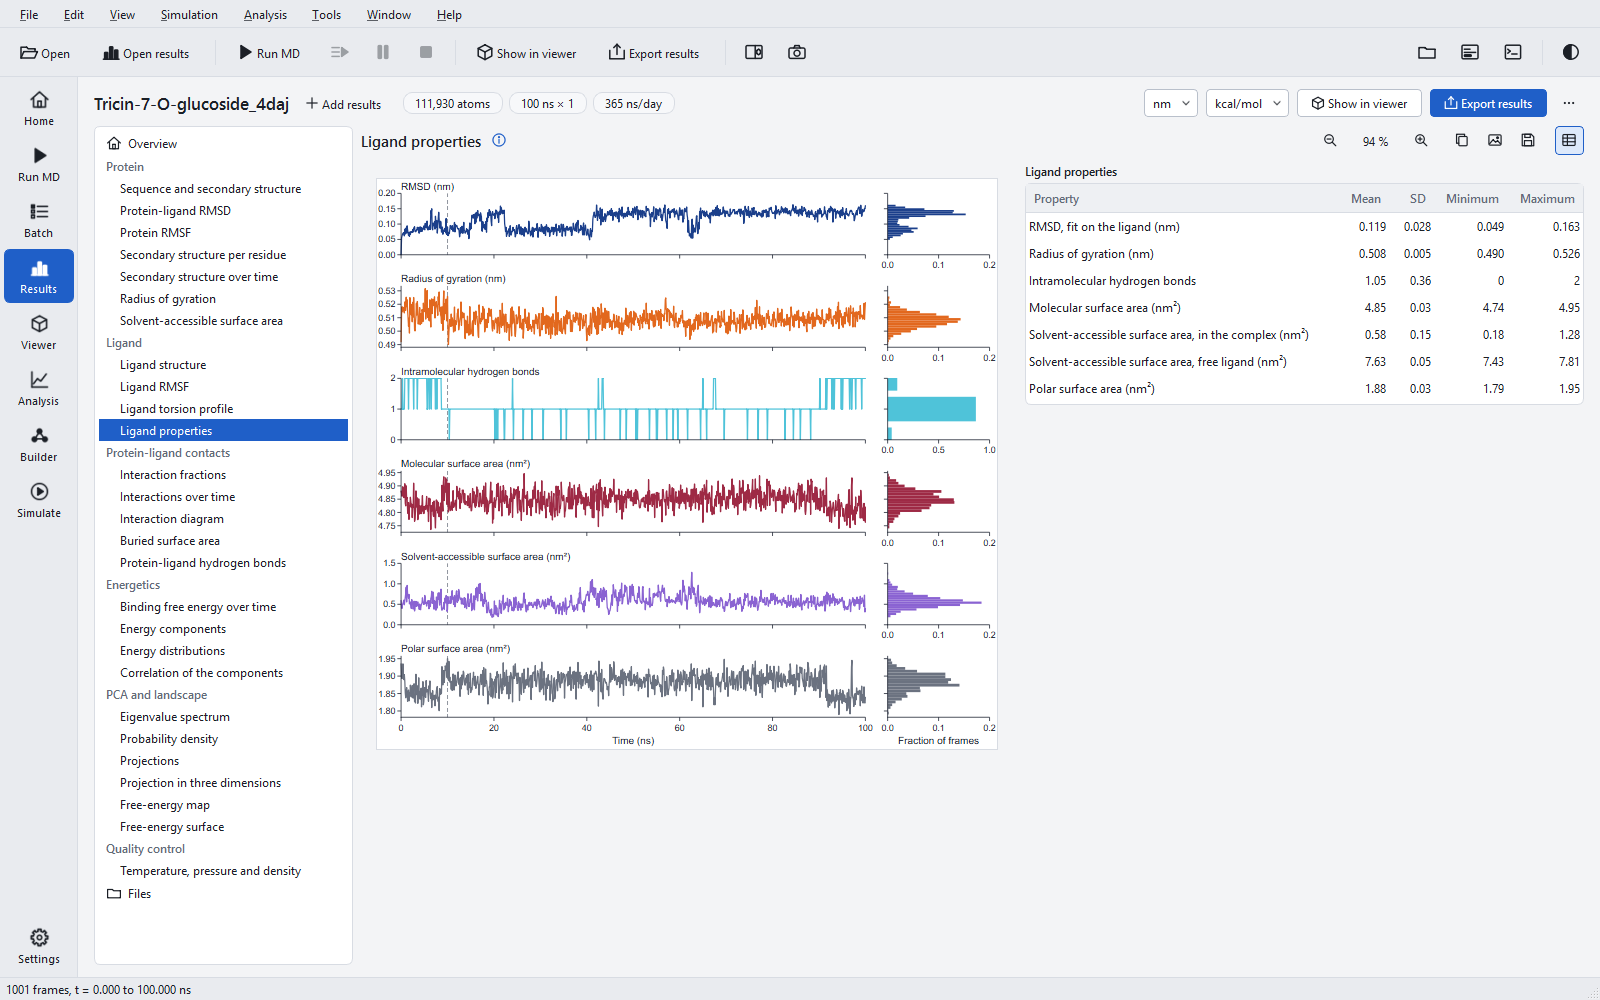
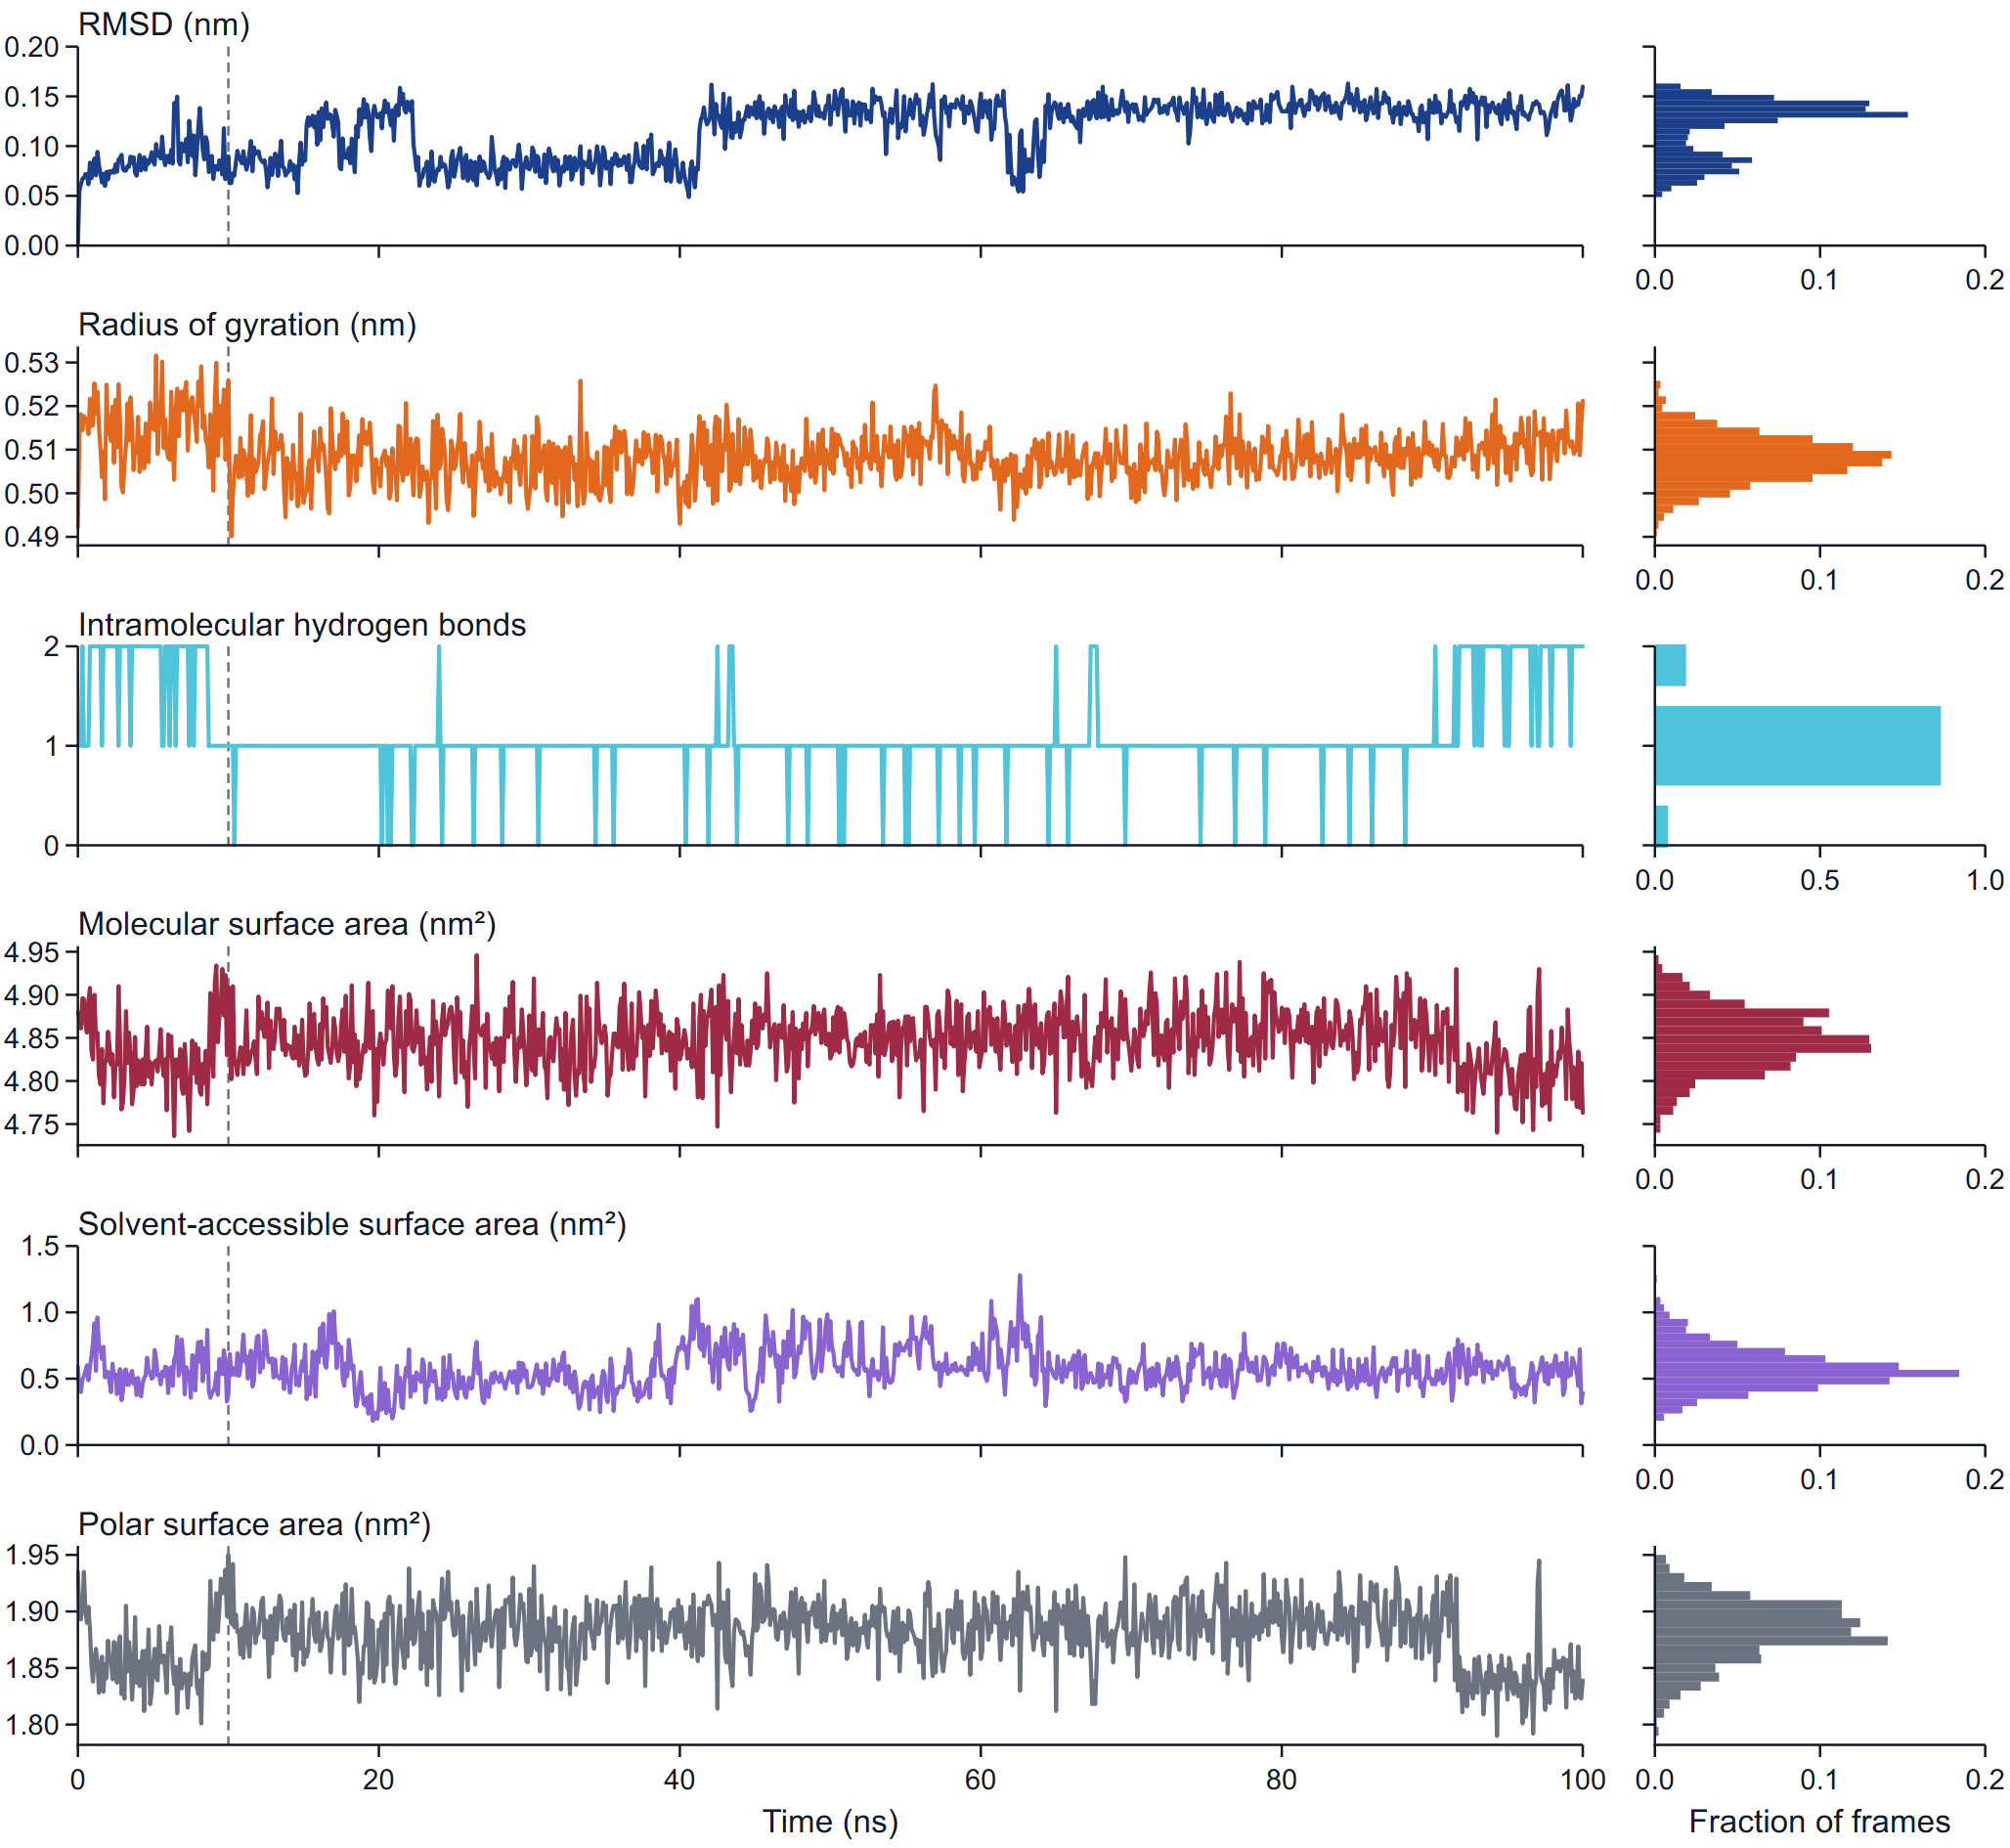
Three analyses look at the ligand itself rather than at its contacts: the fluctuation of each heavy atom, the angle of every rotatable bond in every frame, and six properties of size, shape and surface. They answer whether the ligand kept its shape, which part of it is mobile, and how much of it stays exposed to water. Statistics are taken over the statistics window: by default the production run without its first 10 %, which is treated as equilibration (10 to 100 ns of a 100 ns run). Time series always show the whole run, with a dashed vertical line where the window starts, and every statistics table ends with a note that names the window.
The two-dimensional structure
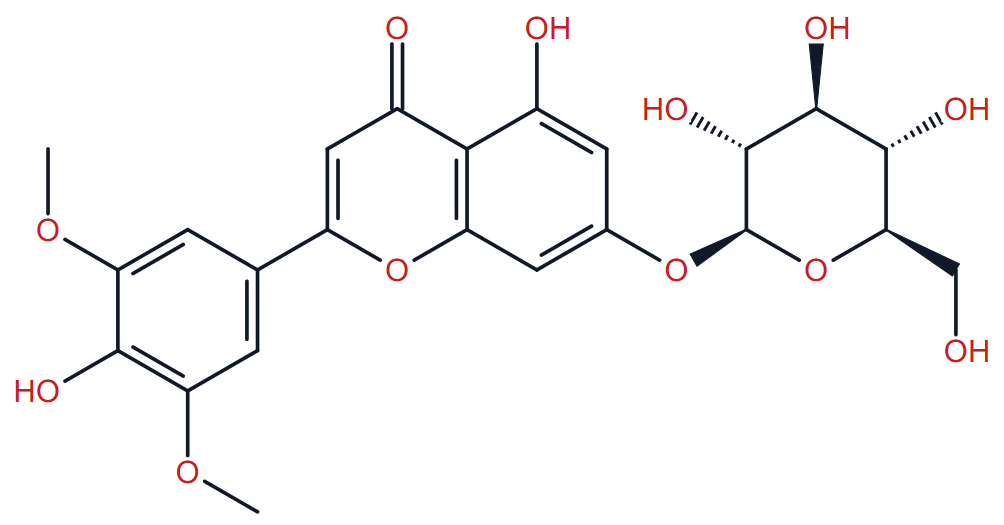
The Ligand group opens with the structure of the ligand drawn by the program from the bond orders and charges of the simulated molecule, so it shows what was simulated, including its protonation at the chosen pH. The same drawing is reused, with atom numbers or coloured bonds, by the figures below. Limits: the stereochemistry of a protonated amine nitrogen is not drawn, CIP rules 3 to 5 are not implemented, and a few spiro and cage structures are drawn with crossing bonds (a warning says so). How the ligand was parameterised is described under Ligand parameters.
Ligand RMSF
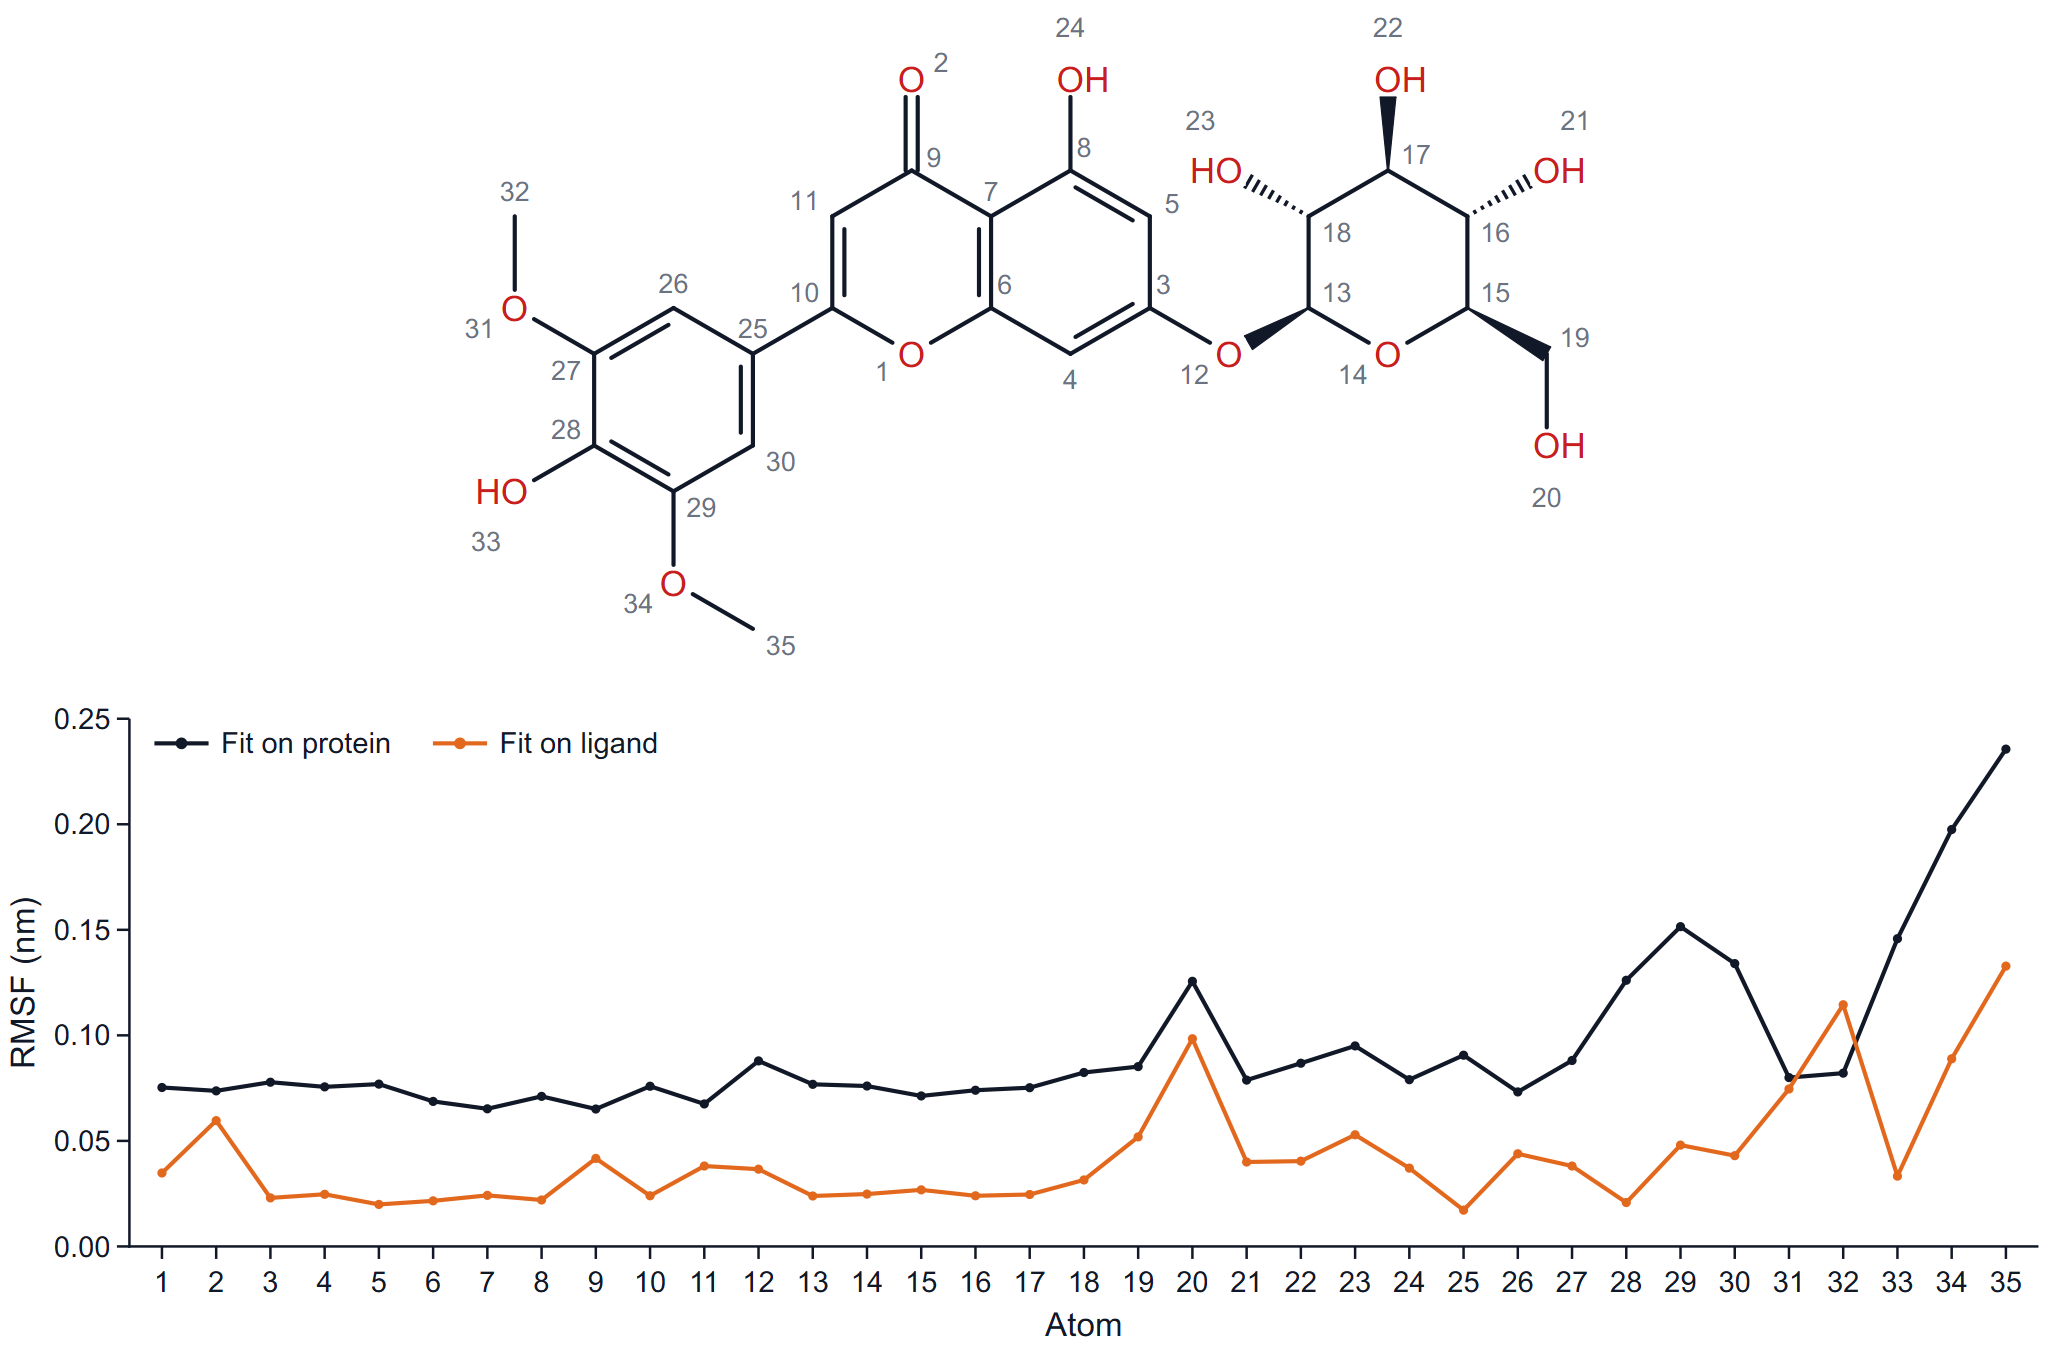
For every heavy atom, RMSF = sqrt( < |r(t) − <r>|² > ) over the frames of the window, about its mean position, after two different fits: (a) the mass-weighted fit on the protein backbone (the fusion insert excluded), and (b) the fit on the ligand heavy atoms themselves. The atoms are numbered in topology order; the number next to each atom in the drawing is its position on the x axis.
How to read it: the ligand-fit curve is internal flexibility, the protein-fit curve is internal flexibility plus the motion of the whole ligand in the pocket. Where the two curves are close the atom is held; where the protein-fit curve rises far above the ligand-fit curve, that end of the ligand swings or slides as a unit. Terminal methyl, hydroxyl and hydroxymethyl groups always rise in the ligand-fit curve; that is rotation about their bond, not a loose binding mode. As a rule of thumb, values below about 0.1 nm after the protein fit belong to a part that is firmly anchored.
Torsion profile
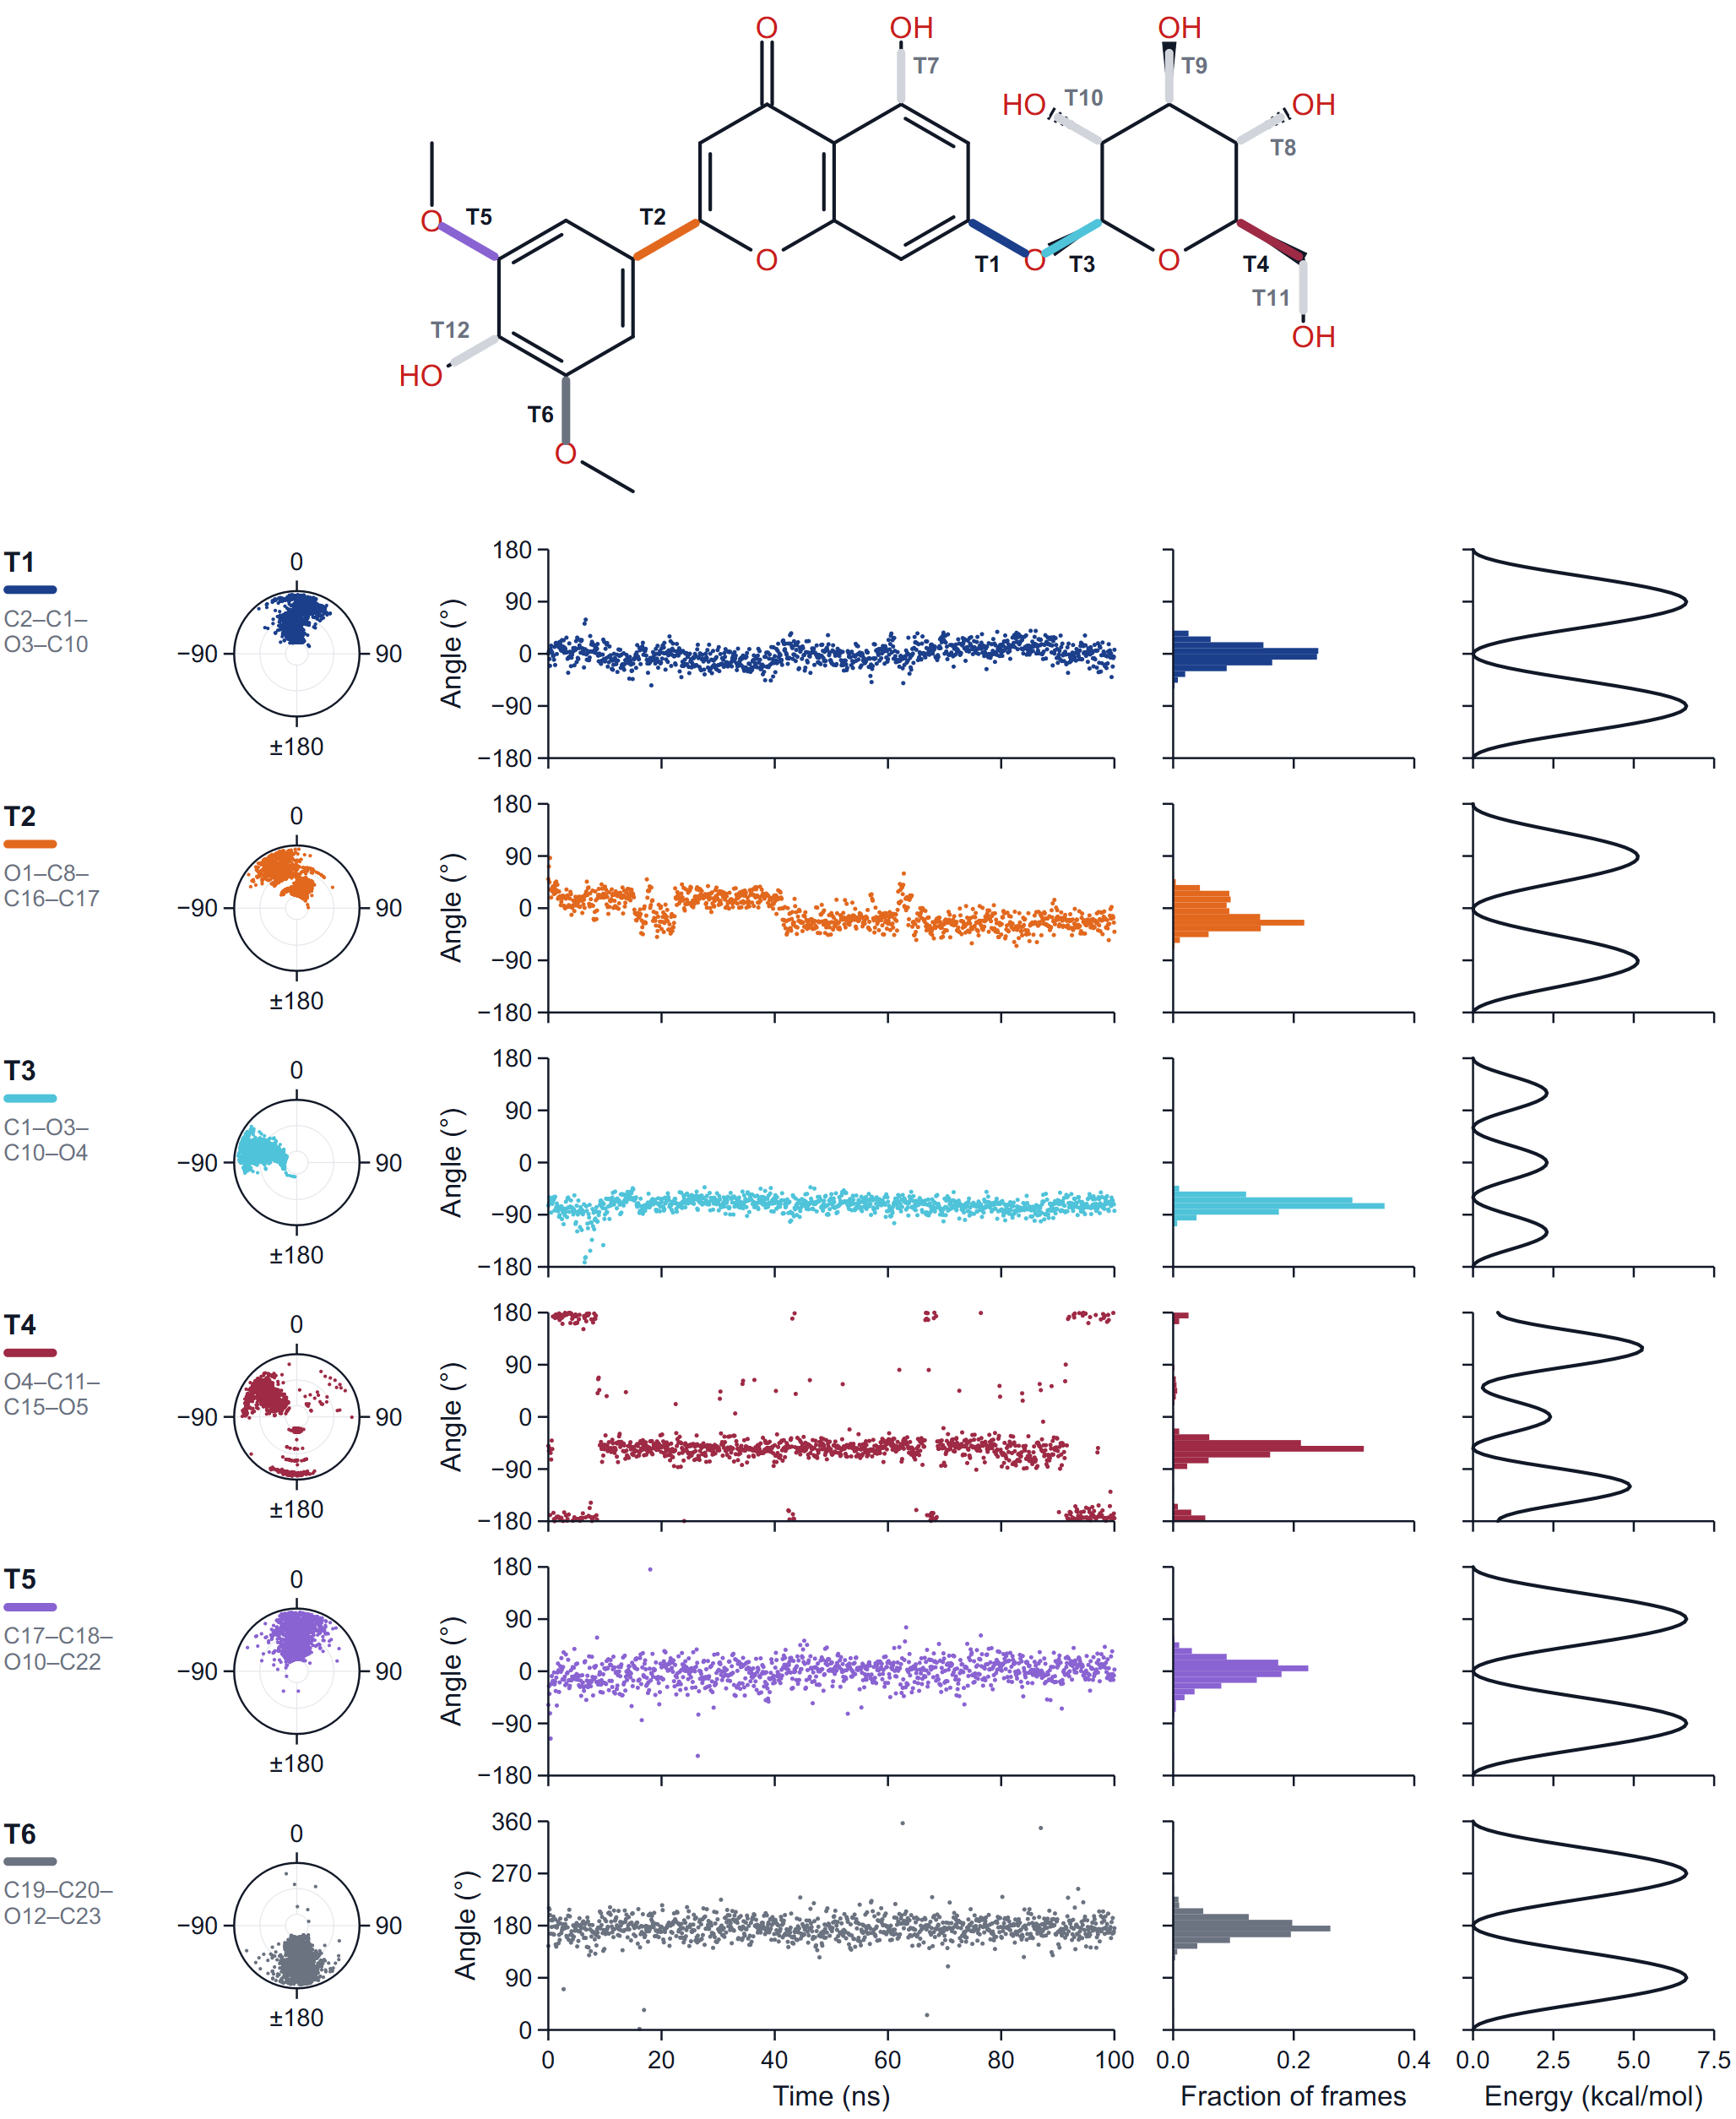
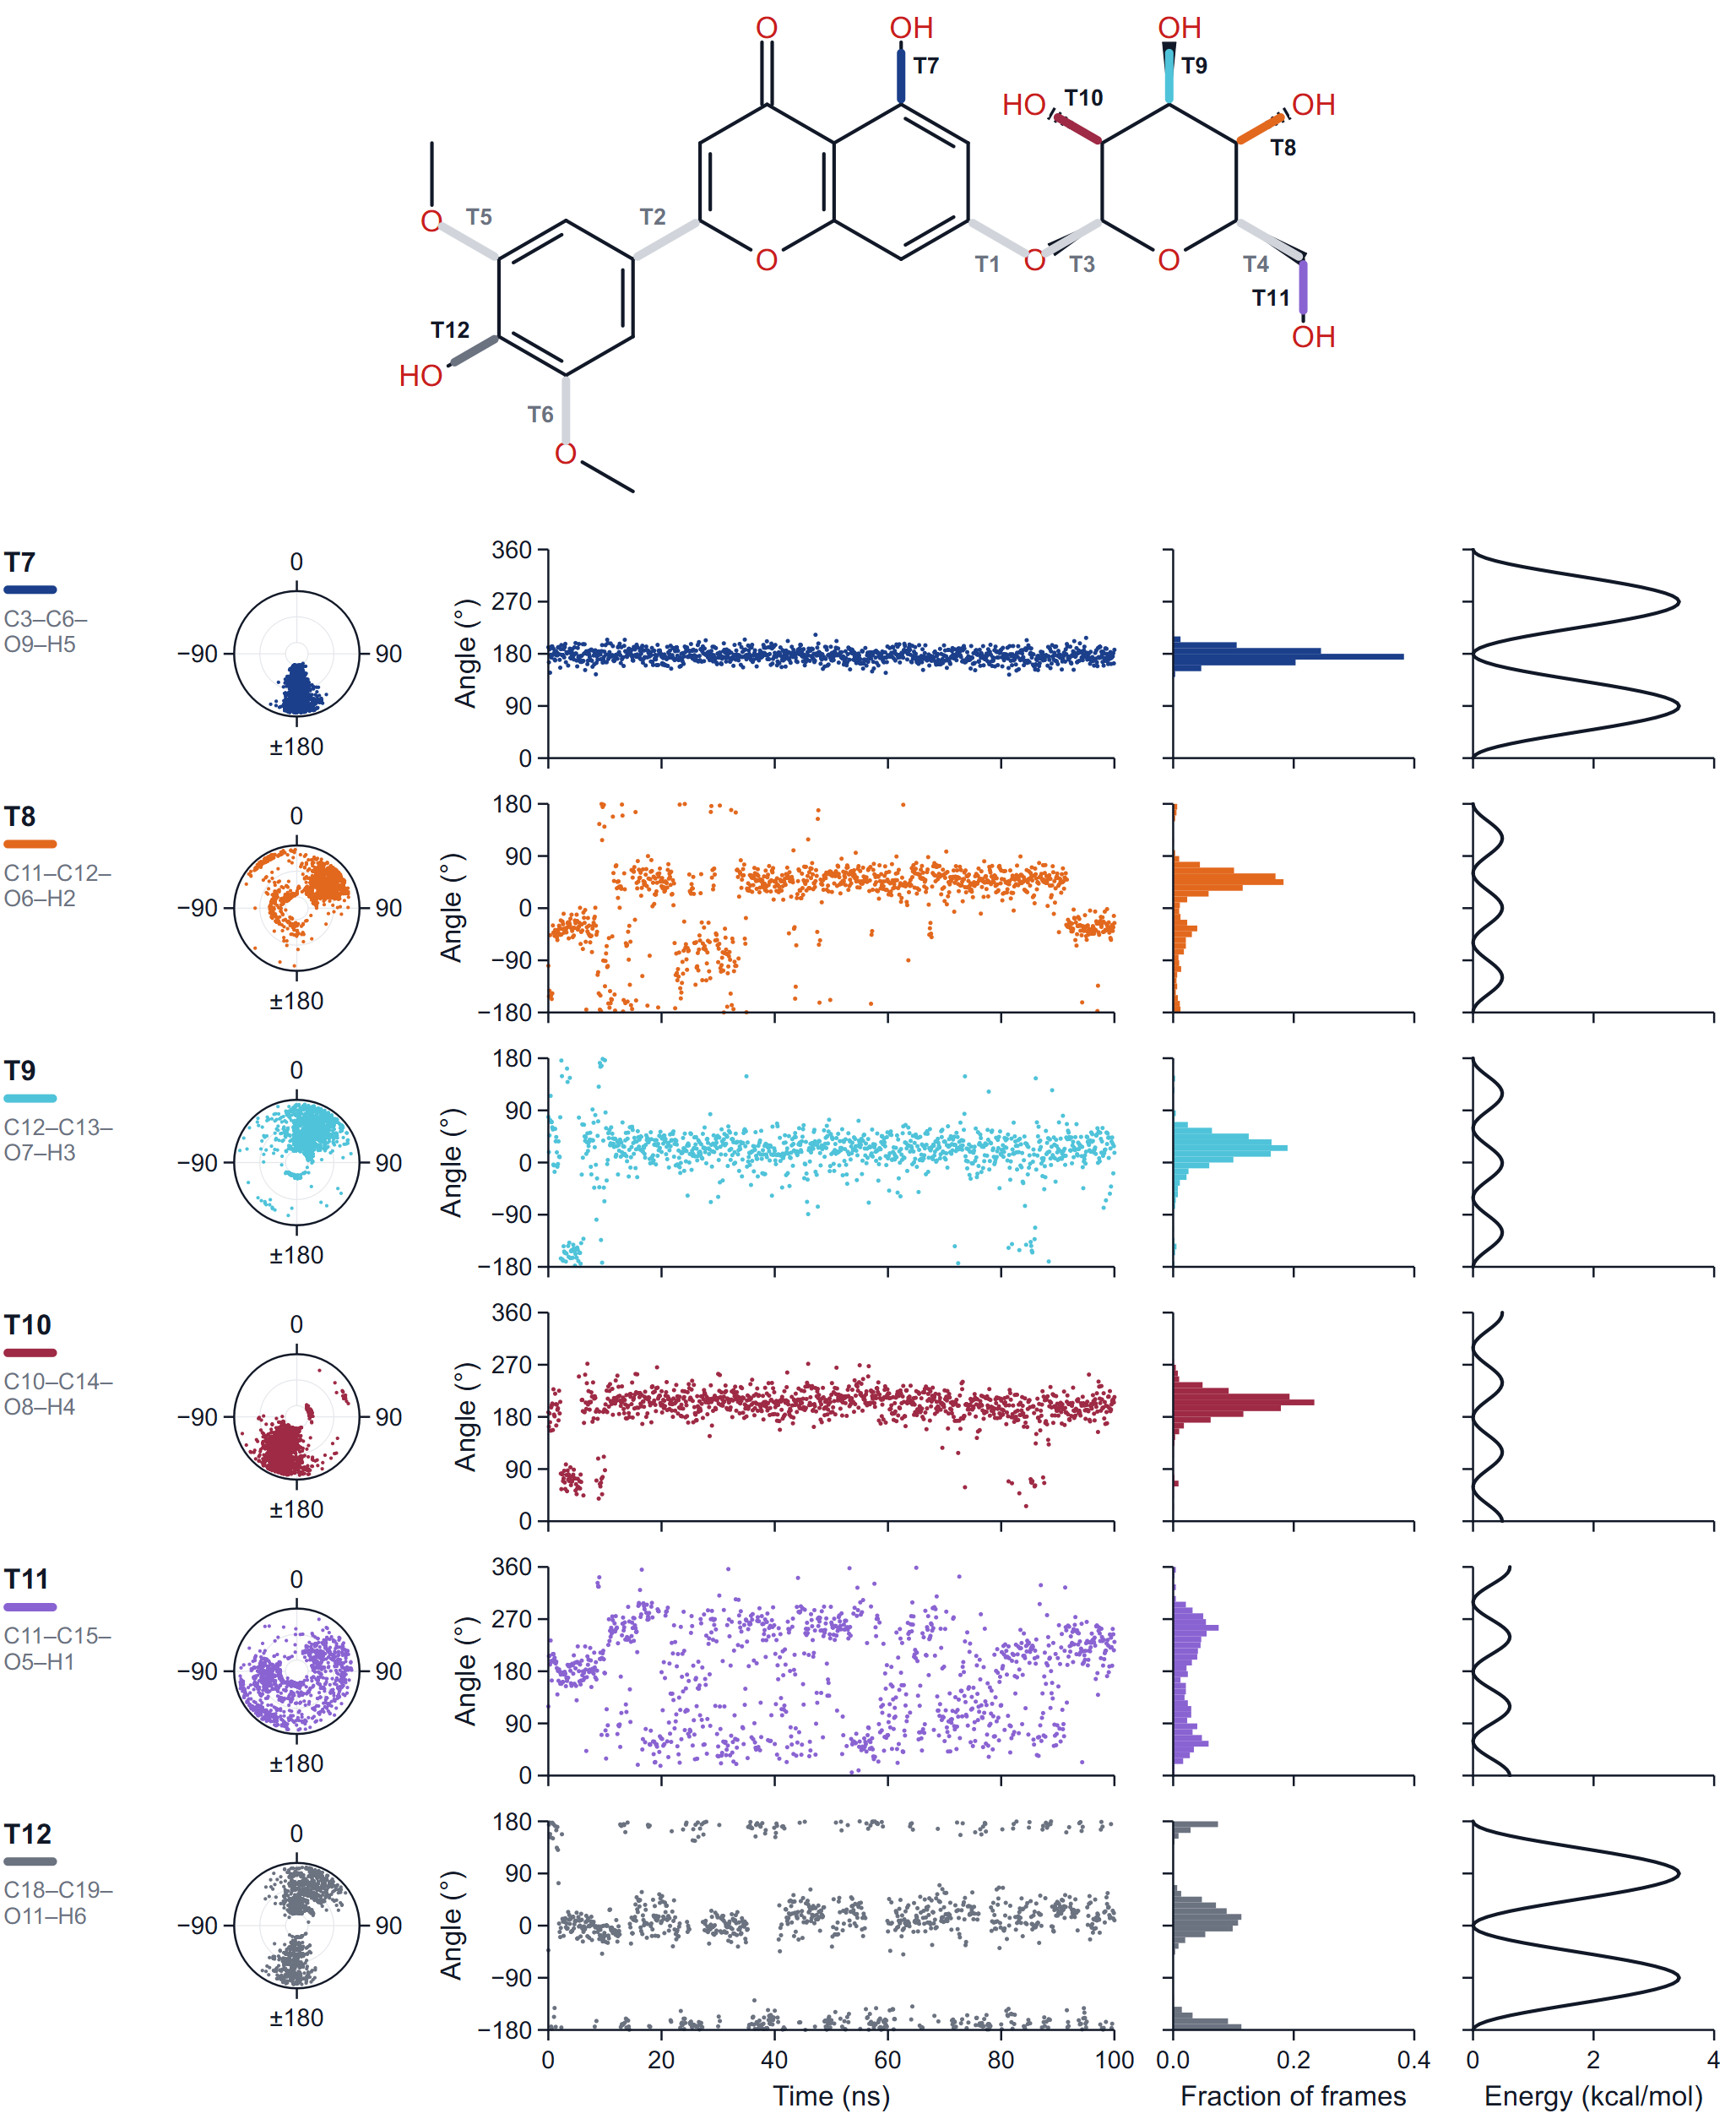
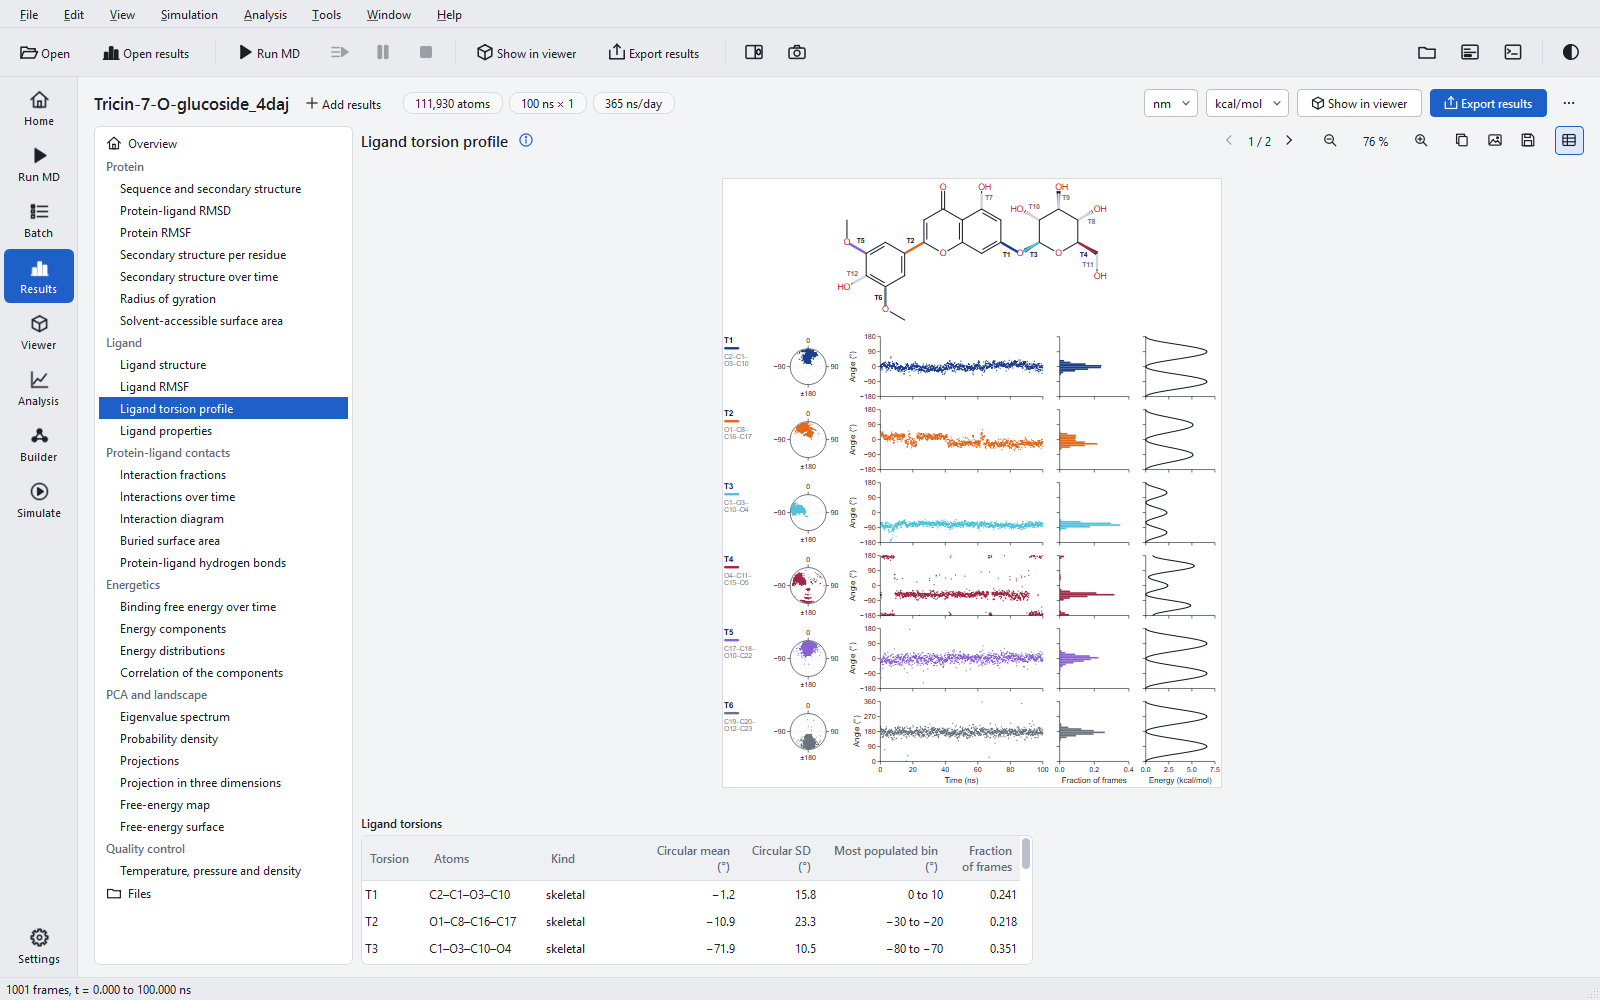
The profiled bonds are of two kinds, listed in this order:
- skeletal torsions, the rotatable bonds: single, not in a ring, both ends heavy atoms with at least two heavy neighbours, and not an amide C-N bond. This is the strict rotatable-bond count printed in the ligand table (6 for the example);
- polar-hydrogen rotors: a hydroxyl, thiol or primary amine group turning about its single bond. They are profiled but not counted as rotatable bonds ("6 (torsions profiled: 12)" in the overview).
Each torsion is named T1, T2 … and labelled with its four atoms, for example C2-C1-O3-C10; the bond is drawn on the structure in the colour of its row, and the figure comes in parts of six torsions. Per torsion the row shows:
| Panel | What it shows |
|---|---|
| Dial | The angle of every frame as a dot, measured clockwise from the top, with time running from the centre to the rim. A tight cluster is a torsion that stays put; a ring of dots, one that rotates; dots that move outward from one cluster to another, a switch during the run. |
| Angle over time | The dihedral angle in every frame. The axis runs from −180° to 180°, or from 0° to 360° for a torsion whose frames lie mostly beyond ±90°, so that a cluster near 180° is not split at the edge. |
| Distribution | The fraction of frames in each 10° bin. |
| Torsional potential | The energy of the proper dihedral terms of the force field for rigid rotation about the bond, in steps of 5°, relative to its minimum, in the energy unit of the export. "no torsional term" is shown when the force field has none for the bond. |
The table gives for every torsion its atoms, its kind, the circular mean and circular standard deviation of the angle, the most populated bin and the fraction of frames in it. Circular statistics are needed because −179° and +179° are 2° apart: an ordinary mean of those two angles would be 0°, which is wrong. With several replicas, the angle panel overlays the replicas in tints of the torsion colour and the distribution pools them.
Ligand properties
| Property | Definition |
|---|---|
| RMSD | Mass-weighted RMSD of the ligand heavy atoms after the fit on the same atoms: the change of shape of the ligand. |
| Radius of gyration | Mass-weighted radius of gyration of all ligand atoms: extended conformations have larger values than folded ones. |
| Intramolecular hydrogen bonds | Hydrogen bonds inside the ligand by the usual criteria (0.35 nm, 30°), between atoms at least three bonds apart. |
| Molecular surface area | The van der Waals surface of the isolated ligand (probe radius 0). |
| Solvent-accessible surface area | The surface of the ligand atoms in the complex (receptor + ligand, probe 0.14 nm). The table also gives the same quantity for the free ligand in the same conformation. |
| Polar surface area | The part of the molecular surface area that belongs to N and O atoms and the hydrogens bonded to them. |
How to read it: the RMSD and radius of gyration show conformational changes; two levels, as in the example, mean two shapes, and the torsion profile tells which bond made the change. Intramolecular hydrogen bonds that form and break change the polar surface the ligand presents. The ratio of the SASA in the complex to the SASA of the free ligand is the fraction of the ligand left exposed (0.58 / 7.63, about 8 %, in the example); a rise of the SASA in the complex is often the first sign that a ligand is leaving.