OptiGein Design
Plan an experiment, run it, and let the data tell you where the best settings are. This guide walks through every screen of the software, from picking a design to reporting the optimum you found.
OptiGein Design is a Design of Experiments (DOE) application for Windows and Linux, built by Geinforce Technology Private Limited. It covers the whole cycle of an experiment: choosing a design that answers your question with as few runs as possible, entering the results, fitting and checking a model, and then reading the optimum settings off that model.
Start here
Install the software
What the installer does, where files go, the .ogdx file type, and how to update later.
Activate your license
Enter your keys or sign in, work offline, move to a new computer, or renew when the period ends.
Take the tour
The welcome screen, the design wizard, the run sheet, and the analysis workspace.
Pick the right design
Screening, characterisation or optimisation? A short decision guide with run counts.
What the software does
Build a design
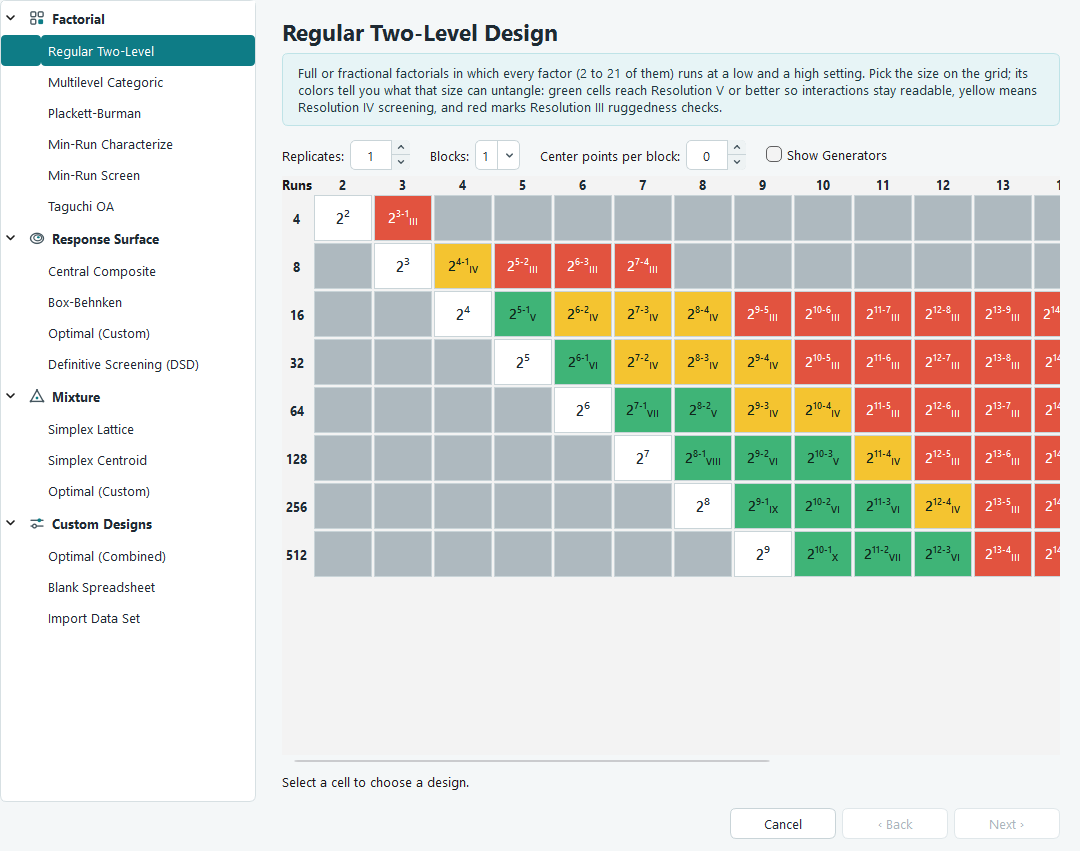
Sixteen design types are grouped into four families. Factorial designs sort the important factors from the unimportant ones. Response surface designs map curvature and locate an optimum. Mixture designs handle recipes, where the ingredients must add up to a fixed total. Custom designs cover everything else, including a blank sheet and importing data you already have.
Analyse the results
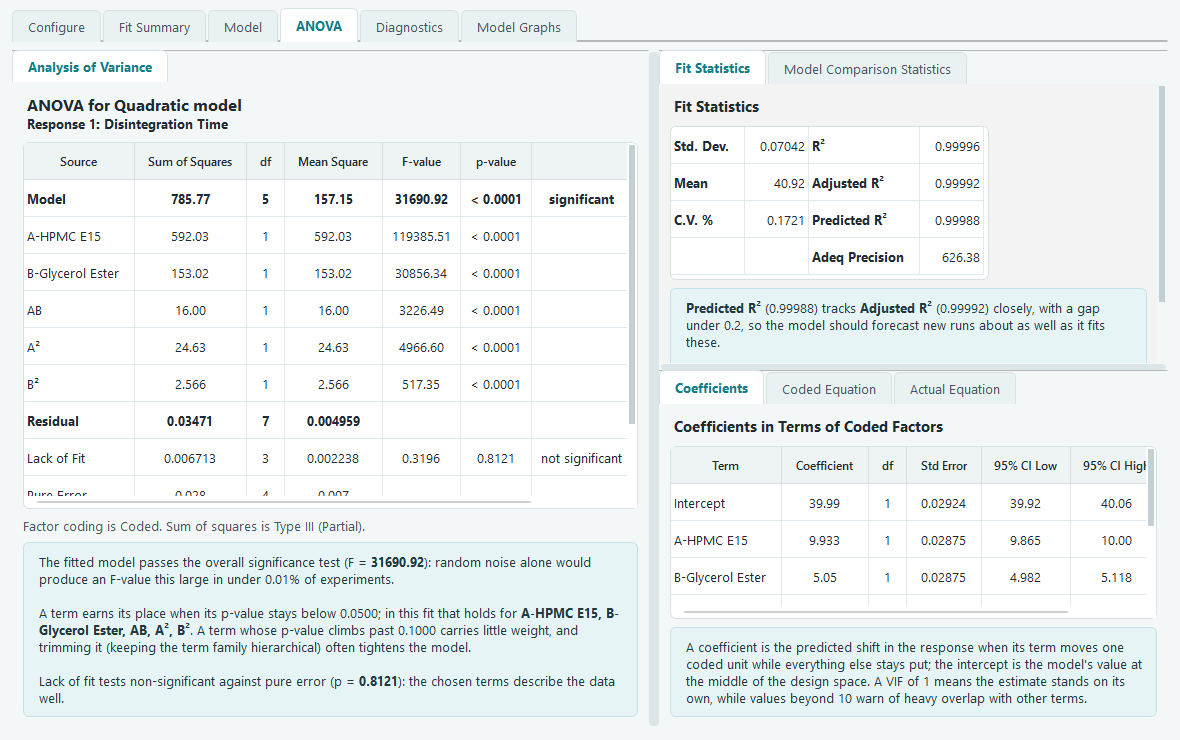
Type your measurements into the run sheet, press Start Analysis, and the software fits a model, suggests the order that the data supports, and lays out the ANOVA table with plain language notes telling you what each number means. Residual diagnostics tell you whether the model can be trusted.
Find the best settings
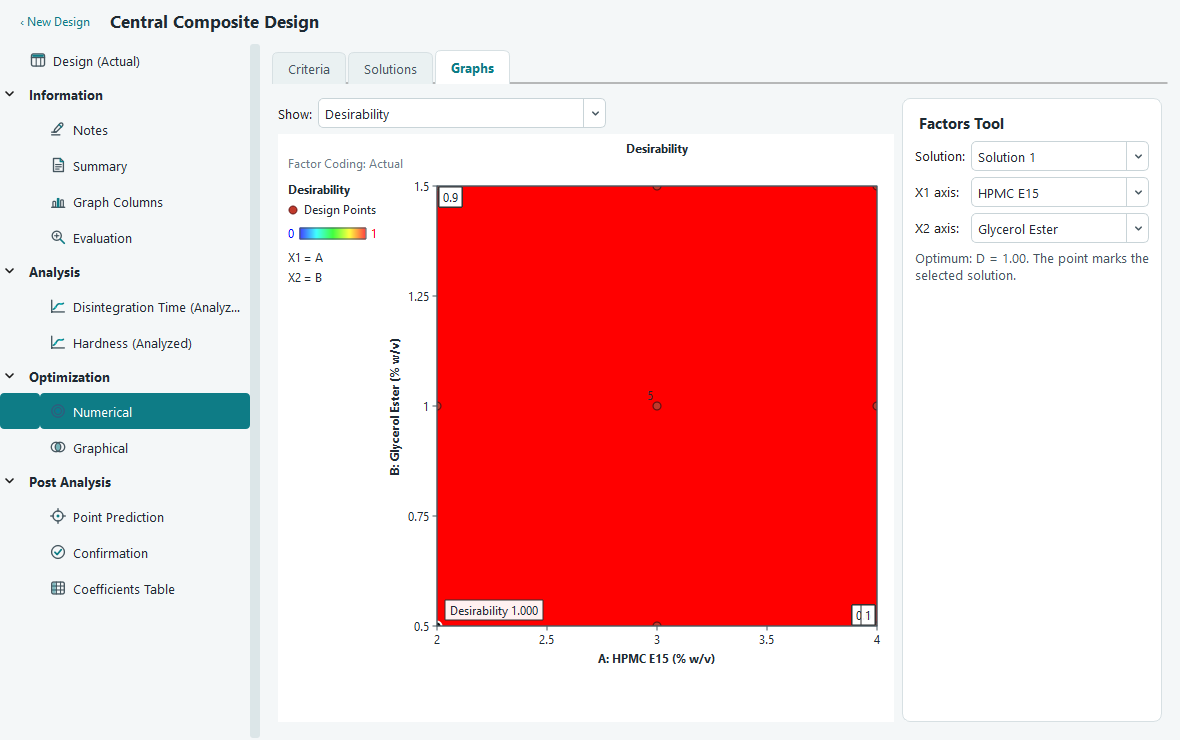
Set a goal for each response, such as maximise yield while holding cost in range, and the optimizer searches the fitted models for the settings that satisfy all of them at once. The graphical route shades the region where every response stays inside its limits.
How this guide is organised
| If you want to | Read |
|---|---|
| Install and activate the software | Installing and Activation |
| Understand what each screen is for | A tour of the software |
| Decide which design fits your question | Which design do I need? |
| Look up the settings of one design type | The four design pages, starting with Factorial |
| Read an ANOVA table with confidence | Fit summary, model and ANOVA |
| Check whether your model is trustworthy | Diagnostics |
| Explain the model to somebody else | Model graphs and Exporting |
| Get numbers for the best settings | Numerical optimization |
| Follow a complete worked example | Response surface tutorial |
| Watch it done on screen | Video tutorials |
| Move to a newer version | Keeping the software up to date |
Getting help
If something in the software does not behave the way this guide describes, please tell us.
Include the design type and, if you can, the saved .ogdx file.
- Email: [email protected]
- Phone: +91 9960867592
- Web: geinforce.com