Saving, printing and exporting
Your experiment is worth keeping and worth sharing. This page covers the design file you save to disk, and every way OptiGein Design hands your work to other programs: a spreadsheet, a printer, Word and PowerPoint.
Saving your work as a design file
OptiGein Design stores each experiment in a single file with the extension .ogdx.
One file holds the whole project, so there is nothing else to keep track of. Use File ›
Save (Ctrl + S) once you have built or opened a design. The first time
you save, the software asks where to put the file and adds the .ogdx ending for you if
you leave it off. After that, Save writes straight back to the same file. File › Save
As (Ctrl + Shift + S) makes a fresh copy under a new name,
which is handy before you try a different model or a what-if change.
A design file is a complete snapshot, not just the run sheet. When you save, it records:
- the design type and its structure, including any blocking and, for fractional designs, the defining relation and alias information;
- every factor with its letter, its name, its units and its low and high settings, and every response with its name and units;
- all runs in both standard and run order, the coded values, and any response values you have measured and typed in;
- your notes for the design;
- the analysis choices you made for each response, such as the model order, any response transform, and which terms you kept in the model.
Because the analysis choices travel with the file, reopening a design puts you back exactly where you left off, not at a blank slate. The file itself is plain text in a readable JSON layout, which keeps it small and easy to archive alongside your lab records.
Opening a design again
Use File › Open Design (Ctrl + O) to browse for an
.ogdx file. The files you worked on most recently are quicker to reach: they are listed
under File › Open Recent and on the welcome screen, so a click reopens them.
If a recent file has since been moved or deleted, the software tells you and offers to drop it from
the list.
You do not have to start from inside the program at all. If you allowed it during installation,
the .ogdx type is registered with Windows, so double clicking a design file in
File Explorer opens it directly in OptiGein Design. Design files also carry the application
icon so they are easy to spot in a folder. The installer offers this as the option Open .ogdx
design files with OptiGein Design by default, which is switched on unless you clear it.
Exporting the run sheet to a spreadsheet
Sometimes you want the raw table in Excel, or in a colleague's tool that does not read
.ogdx files. File › Export Run Sheet to CSV writes the run sheet
as a comma separated file that any spreadsheet opens. This command becomes available as soon as a
design is open, and it suggests a file name based on your design file so the two sit together.
The exported table starts with a Std column (standard order) and a Run column
(the randomised run order), and a Block column when the design is blocked. Then come the
factor columns, headed the same way you see them in the run sheet, for example
A:HPMC E15 (% w/v), and finally the response columns, such as
Disintegration Time (sec) and Hardness (N). Rows are written in run order,
the order you would actually perform the experiments. Text that contains a comma or a quotation mark
is quoted correctly, and the file is written in UTF-8, so units and special characters survive the
trip.
.ogdx file as well.
Printing and print preview
Every screen in the workspace can go straight to paper or to a PDF printer. File › Print (Ctrl + P) prints the view you are currently looking at, whether that is the run sheet, an ANOVA table, a diagnostic plot or a contour graph. The page is rendered at high resolution and scaled to fit the paper, so it stays sharp. File › Print Preview shows the same output first, so you can check the fit and pick a printer or page size before committing.
Copying and exporting a graph
Any graph in the software carries its own menu. Right click the graph and you can send it out in a few ways:
| Menu item | What it does |
|---|---|
| Copy | Places the graph on the clipboard as a high resolution image. Paste it into almost any program with Ctrl + V. |
| Export › Export Graph to Word | Inserts the graph into your open Word document, or a new one if none is open. |
| Export › Export Graph to PowerPoint | Adds the graph to the current PowerPoint slide, or a new presentation, sized to sit neatly on the slide. |
| Export › Export Graph to File | Saves the graph as a PNG or JPEG image at a location you choose. |
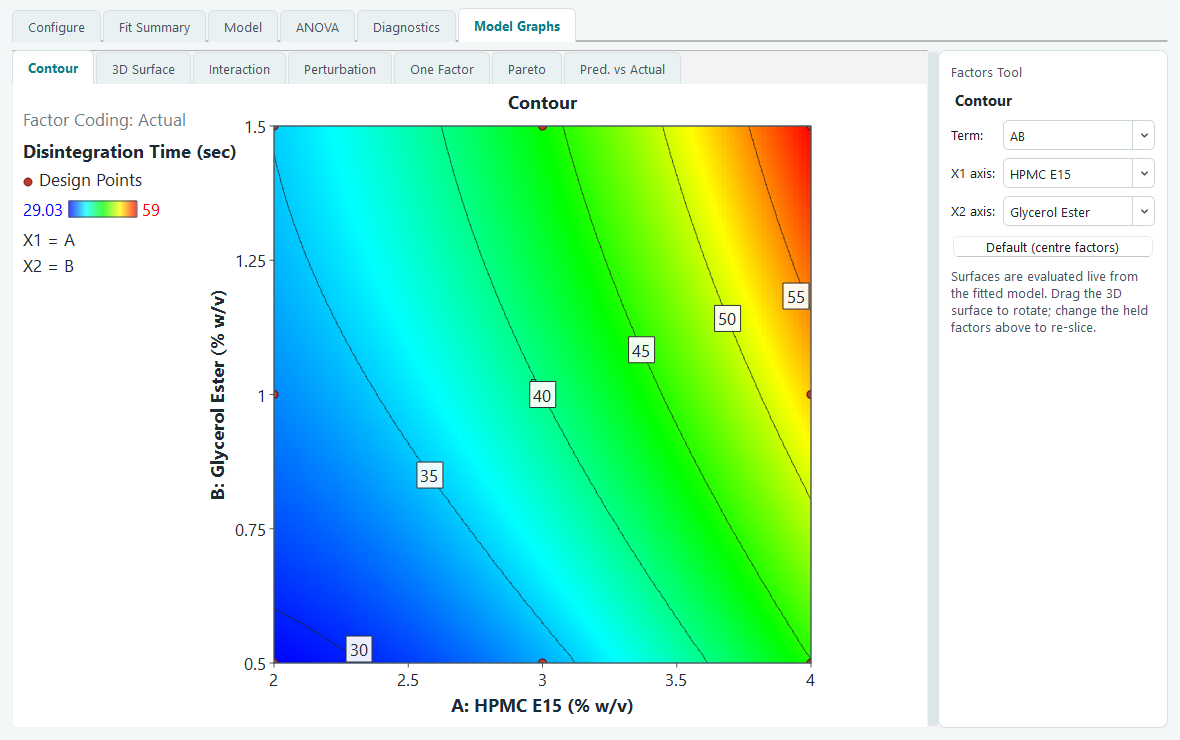
There is an important detail behind all of these. A graph is not simply screenshotted from the window. Before it is copied or exported, OptiGein Design re-renders it at a fixed, readable size and a high resolution, independent of your window size. So a graph copied from a small or cramped window still comes out with full axis titles, no overlapping labels and crisp lines in the finished document. The image also carries its true resolution, so Word and PowerPoint place it at a sensible size rather than blowing it up.
Copying and exporting a results table
The tables on the analysis and optimization screens work the same way. Right click a results table to reach these commands:
| Menu item | What it does |
|---|---|
| Copy | Copies the cells you have selected. Paste them into a spreadsheet or document and they land as a real table, not run-together text. |
| Copy With Headings | The same, but includes the column headings above the copied cells. |
| Export Table to Word | Sends the whole table, with headings, into Word as a formatted table you can edit. |
| Export Table to PowerPoint | Places the whole table, with headings, onto a PowerPoint slide as a formatted table. |
Copy and Copy With Headings put the table on the clipboard in a rich form as well as plain text, so pasting into Word, Excel or PowerPoint gives you a genuine table with rows and columns, ready to restyle. The two Export commands go a step further and build the table directly in a formatted layout, with a shaded heading row, so numbers from your ANOVA or coefficients table drop into a report already looking tidy.
What to read next
These commands live in the File menu and the right click menus. For the full list of menu items and their shortcuts, see Menus and shortcuts. For what each analysis table and graph means before you export it, see Fit summary, model and ANOVA and Model graphs.