A tour of the window
The five regions of the window, what each is for, and how a calculation moves from the left of the window to the right.
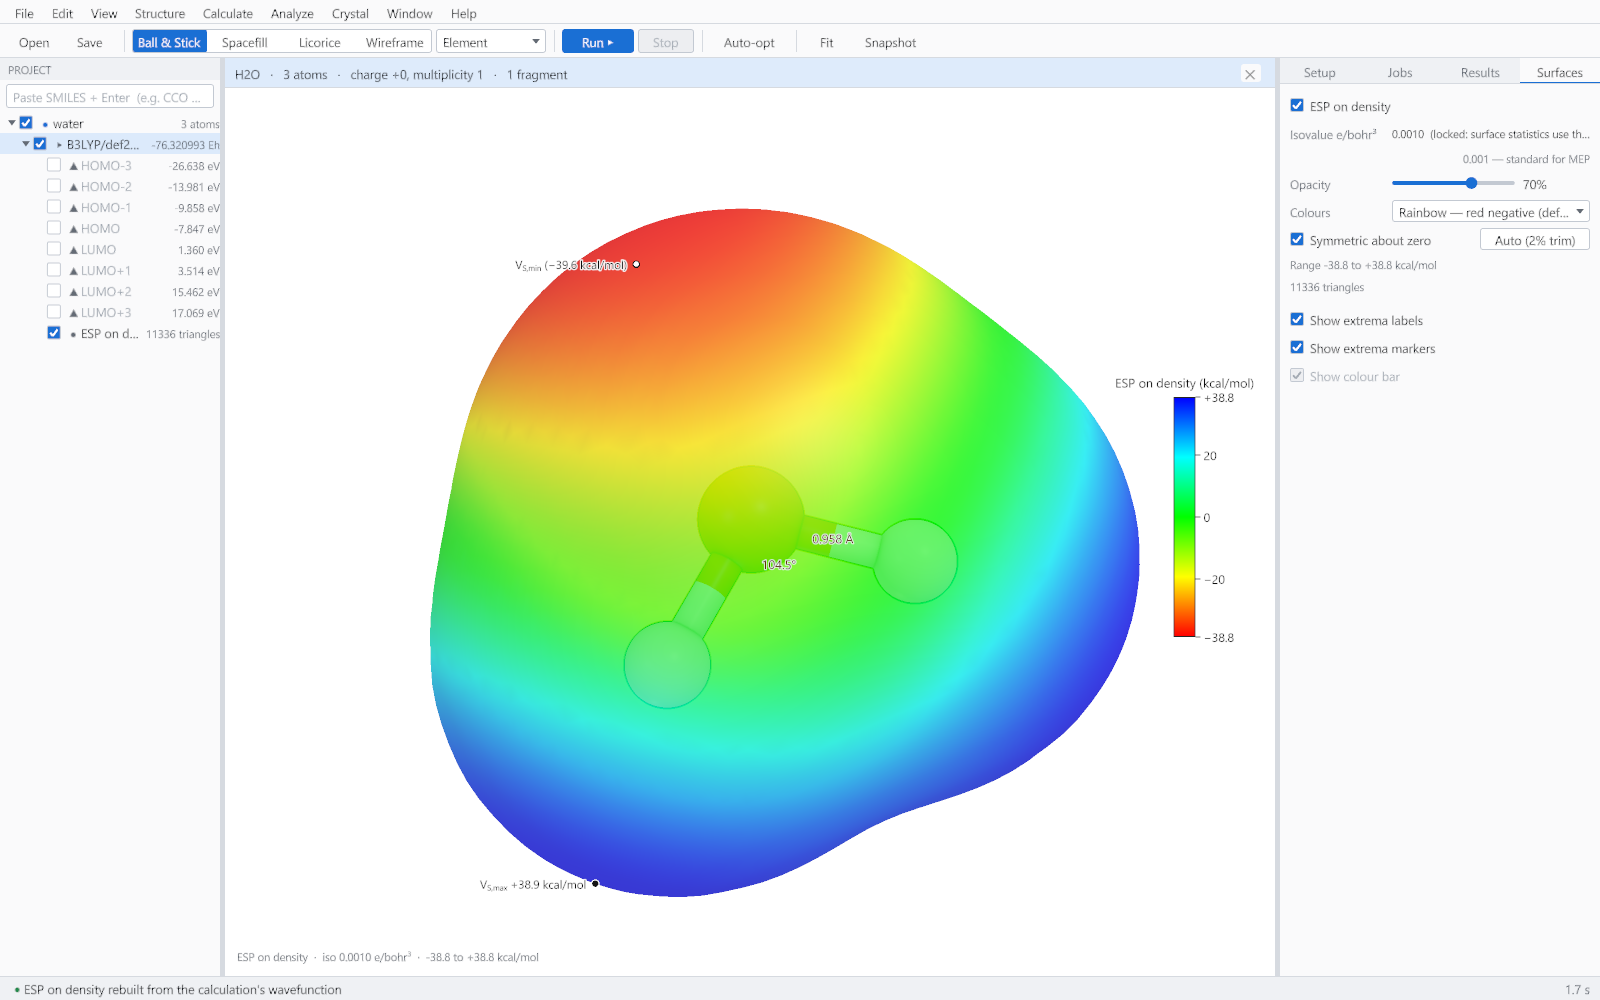
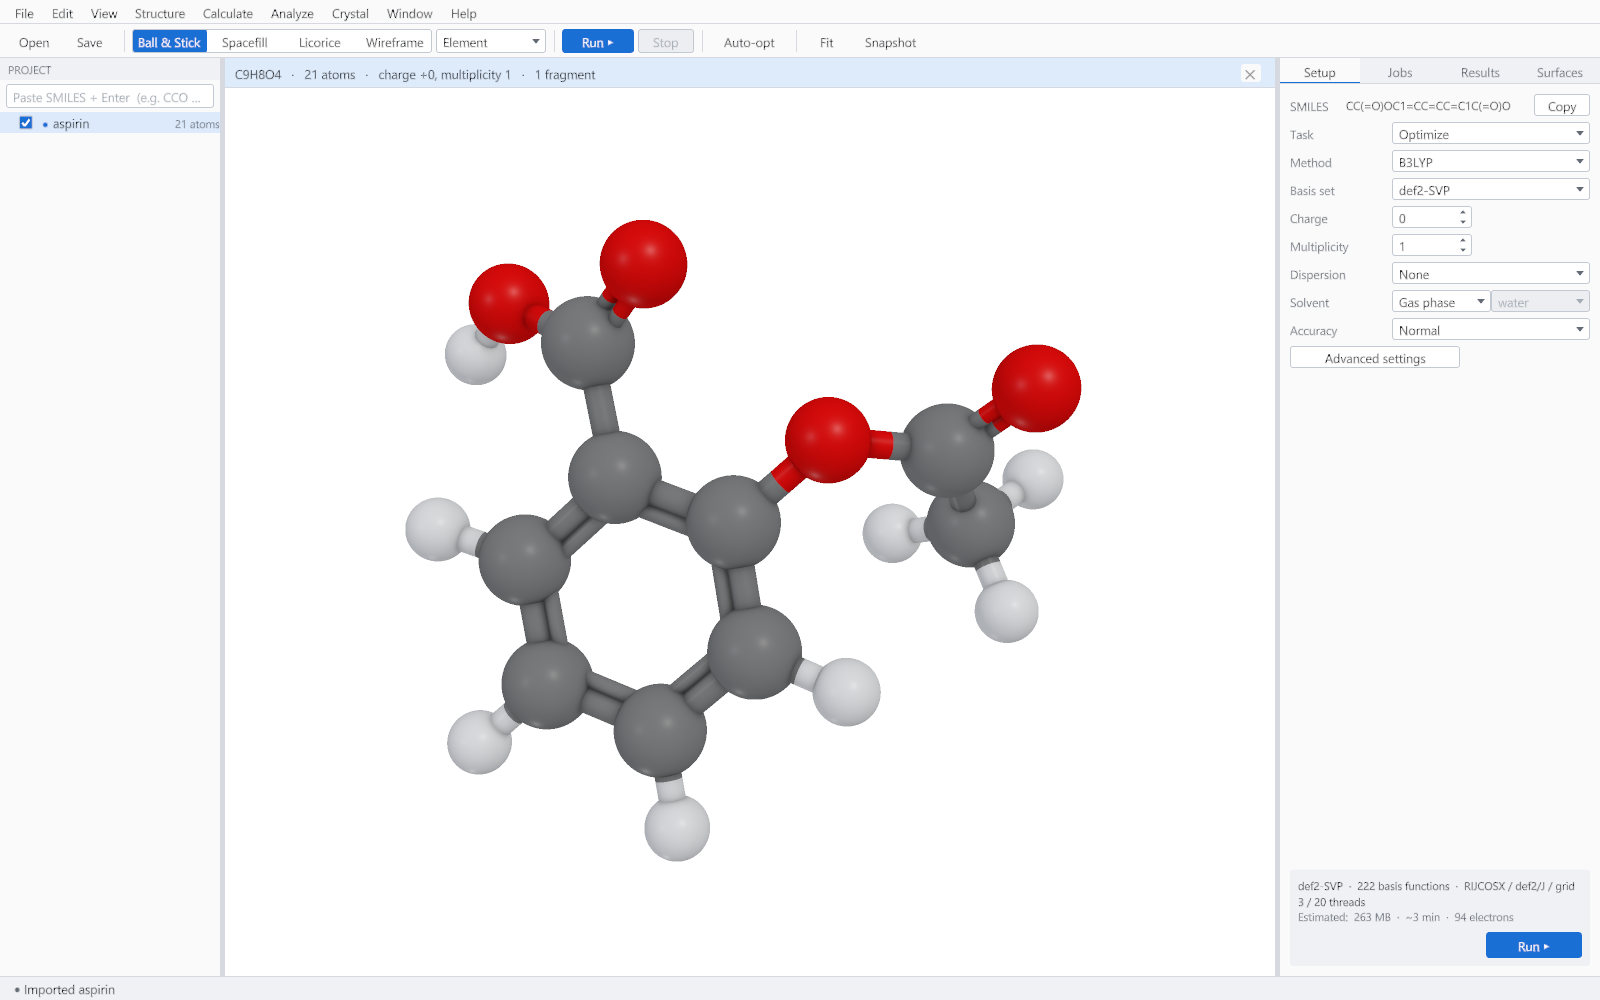
The window is arranged in the order the work happens. A structure arrives on the left, is drawn in the centre, and is set up, run and interpreted on the right. Once that is clear, the rest of the application follows from it.
The five regions
| Region | What it is for |
|---|---|
| Menu bar | Every command the application has, grouped by subject. A command that cannot run yet is greyed rather than hidden, and the status bar says what is missing when you highlight it. |
| Toolbar | The commands used constantly: opening and saving, the four display styles, the colouring scheme, Run and Stop, the force-field Auto-opt toggle, Fit, and Snapshot. |
| Project tree | Every structure that is open, with its calculations beneath it and, beneath those, the orbitals and surfaces that can be drawn. Ticking an entry shows it in the viewer. |
| Viewer | A full molecular viewer rather than a preview. It selects, measures, restyles, rotates and exports, and it keeps drawing while a calculation runs. |
| Task panel | Four tabs in the order a calculation passes through them: Setup, Jobs, Results and Surfaces. |
The task panel, in order
| Tab | What it holds |
|---|---|
| Setup | Task, method, basis set, charge and multiplicity, dispersion, solvent and accuracy, with the preflight summary that estimates the cost before you commit. |
| Jobs | The running calculation: its phase, elapsed time, live energy and convergence plot, and the record of jobs that have finished or failed. |
| Results | The summary numbers, the orbital energy diagram and the property tables. |
| Surfaces | Everything that can be drawn from the finished calculation, with its isovalue, colouring and opacity. |
The status bar
The bar along the bottom reports what the program is doing and what it last did: the iteration and energy of a running calculation, the isovalue of a surface that has just been shown, the result of a measurement, or the reason a command refused to run.
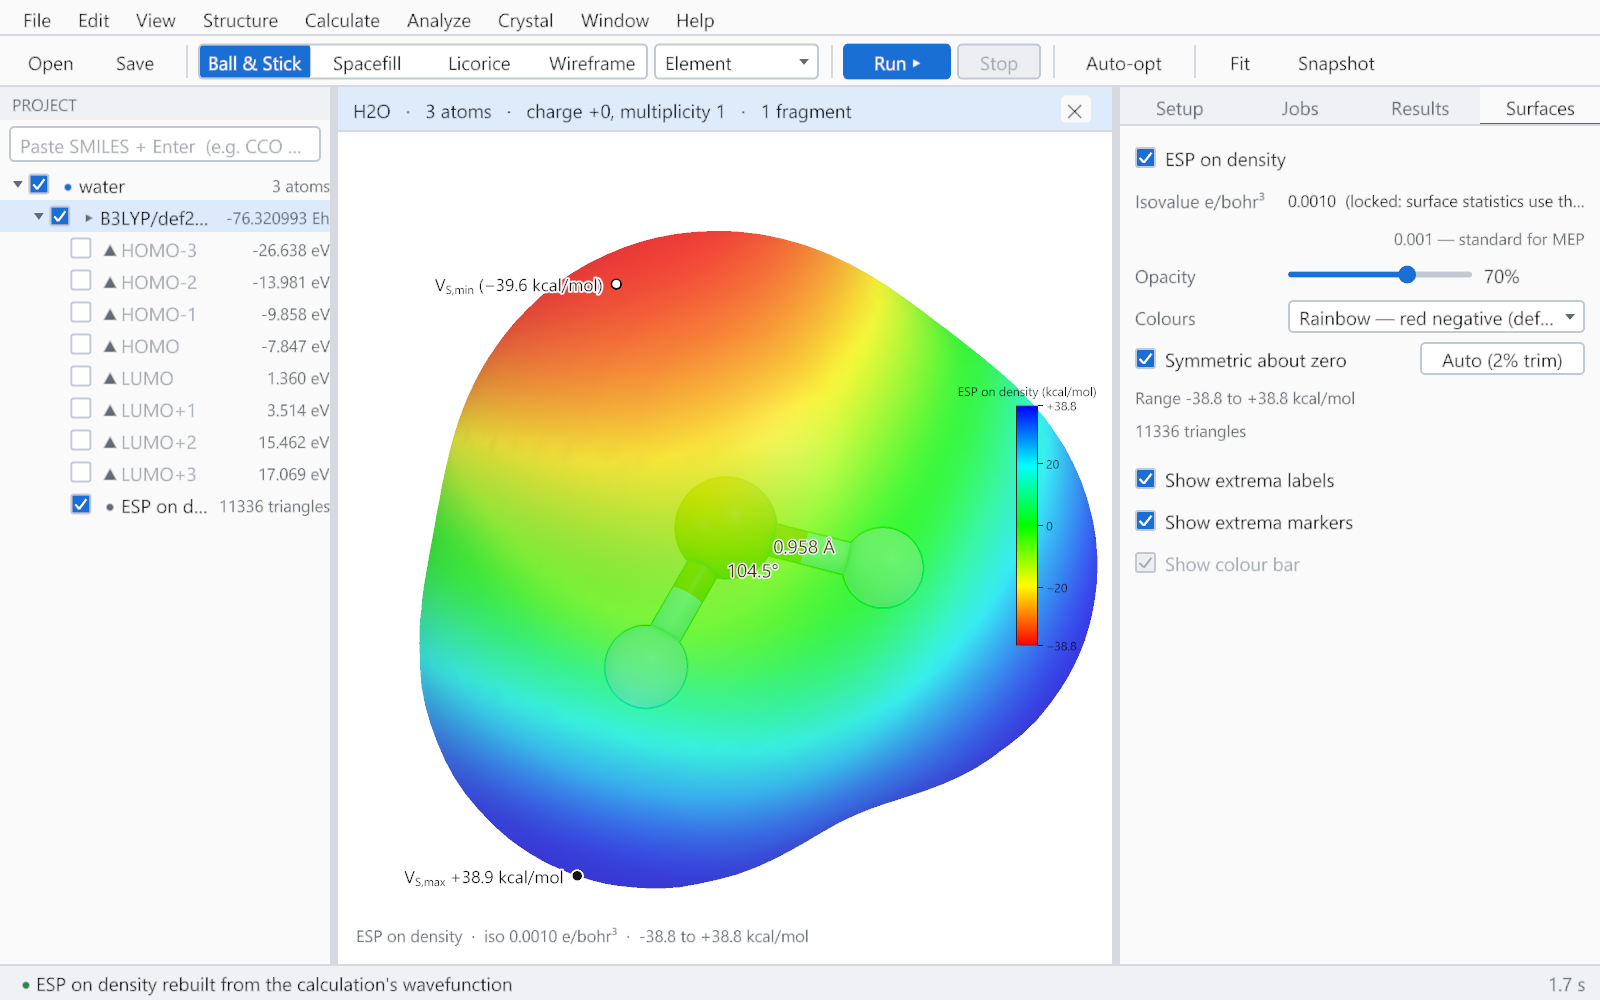
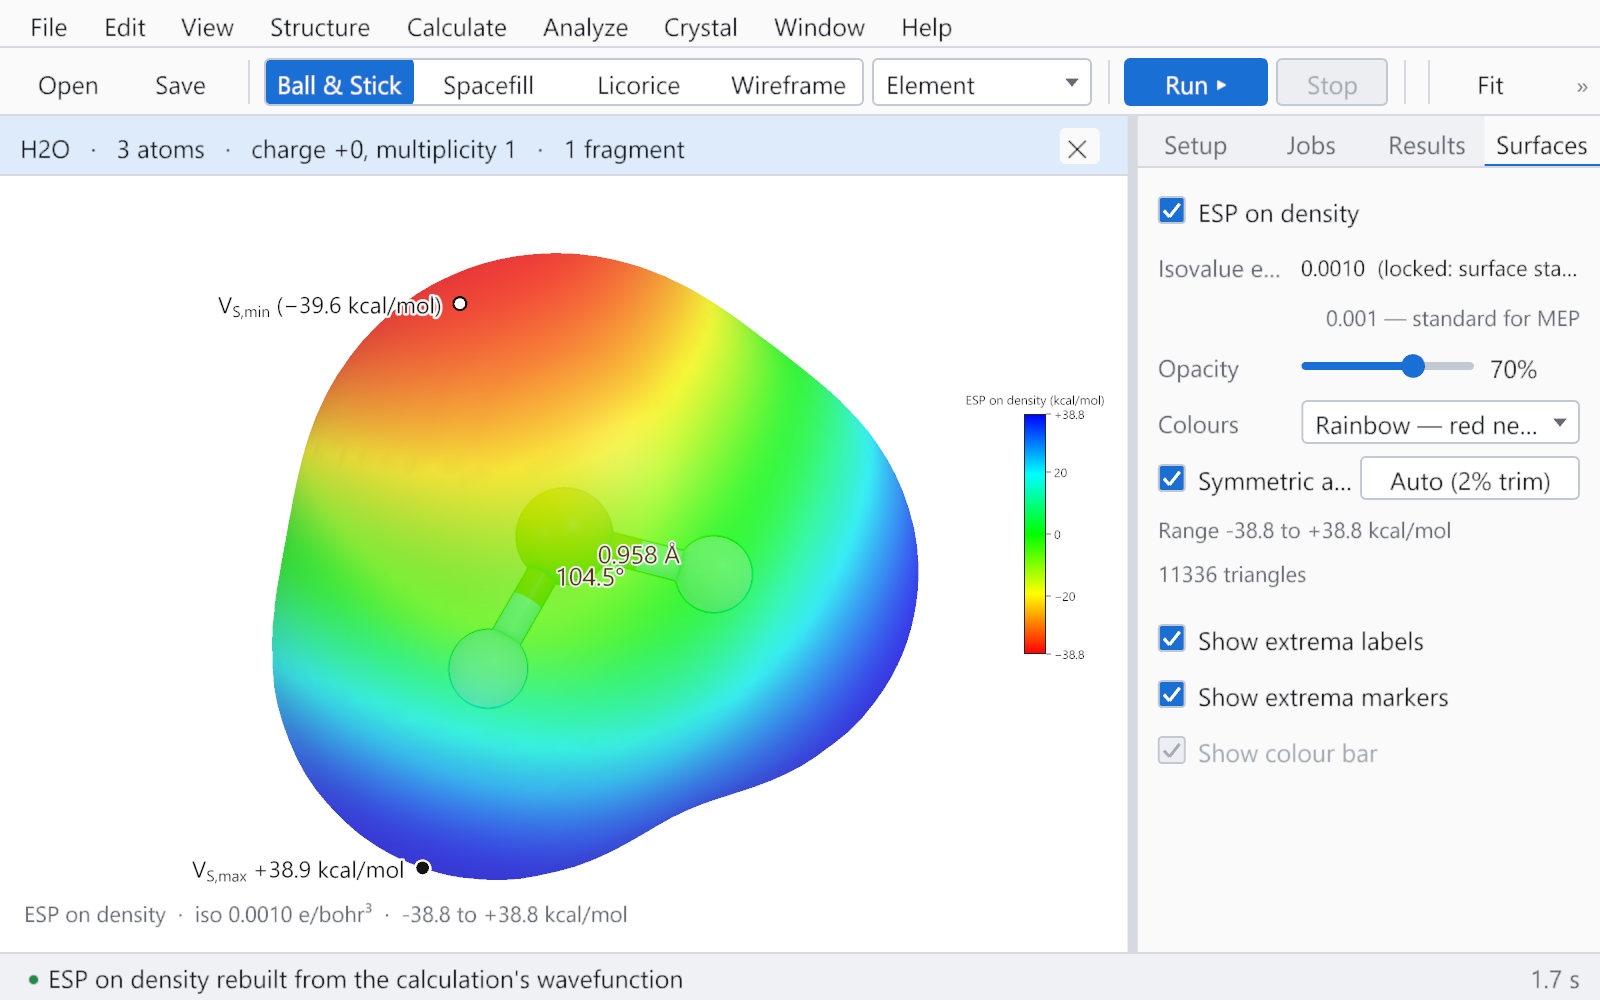
High resolution displays
The window is laid out in logical units and scales with the display setting, so it is usable on a laptop at 100 per cent and on a high resolution monitor at 200 per cent. At the larger scales the toolbar ends with a chevron, and the commands it cannot show are reached from the menus, which carry all of them.