Electrostatic potential surfaces
The molecular electrostatic potential mapped on the density surface: how it is computed, what the colours mean, and what the extrema are good for.
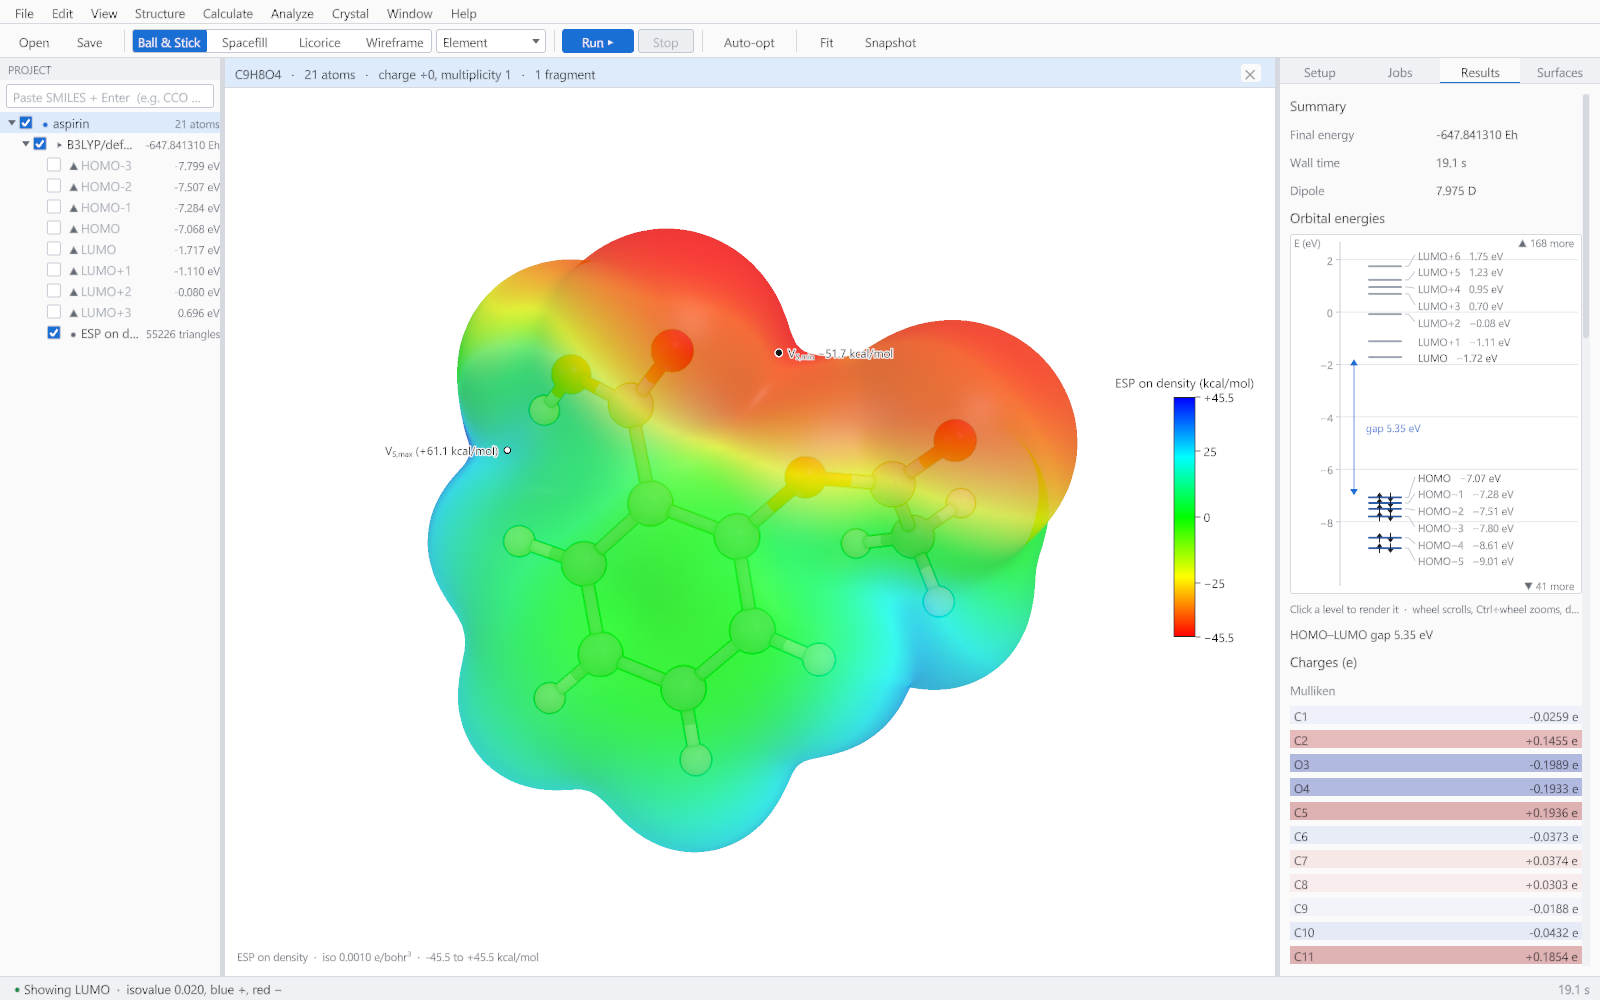
The electrostatic potential at a point is the energy a unit positive charge would have there, from the nuclei and the electrons together. Mapped onto the surface of the molecule it shows where an approaching electrophile or nucleophile is attracted, which is why it is the most used picture in the whole of applied quantum chemistry.
How GeinDFT computes it
| Step | What is done | Why it matters |
|---|---|---|
| The surface | The isosurface of the electron density at 0.001 electrons per cubic bohr. | This is the standard definition of a molecular surface in this context, and it corresponds roughly to the van der Waals contact surface. |
| The potential | Evaluated analytically at every vertex of the mesh, not interpolated from a grid. | The potential varies sharply near the nuclei, so interpolation introduces error exactly where the surface is most interesting. |
| The statistics | The most positive and most negative values, the averages over the positive and negative regions, and the surface area. | These numbers are the quantitative part. They can be compared between molecules in a way that a picture cannot. |
Reading the colours
| Colour | Meaning | Chemistry |
|---|---|---|
| Red | Negative potential | Lone pairs, carbonyl and hydroxyl oxygens, pi systems of electron-rich rings. Where an electrophile or a hydrogen-bond donor is attracted. |
| Green | Near zero | Saturated carbon frameworks and most carbon-bound hydrogens. |
| Blue | Positive potential | Acidic hydrogens, metal centres, the sigma hole on a heavy halogen. Where a nucleophile or a hydrogen-bond acceptor is attracted. |
The extrema
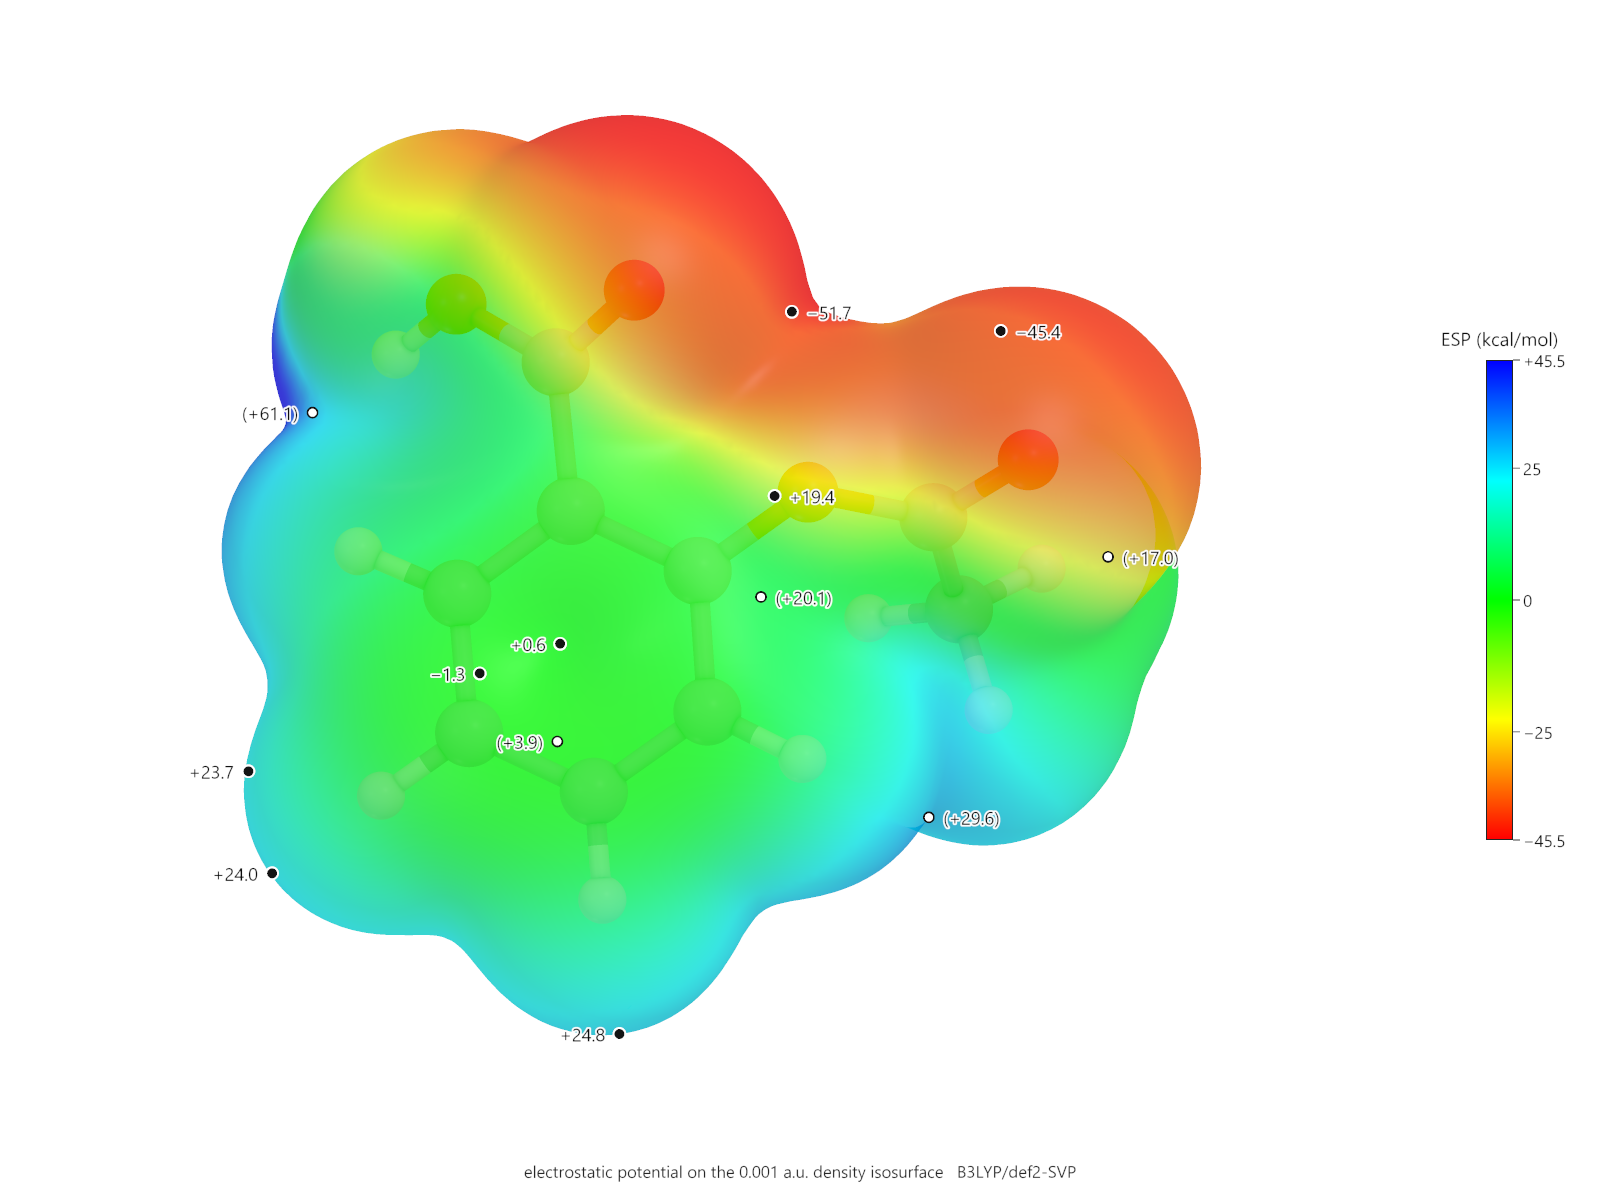
The labelled points are the surface minimum and maximum, usually written VS,min and VS,max. They are the single most useful numbers on the surface: the minimum ranks hydrogen-bond acceptors and the maximum ranks donors, and both can be compared across a series computed the same way.
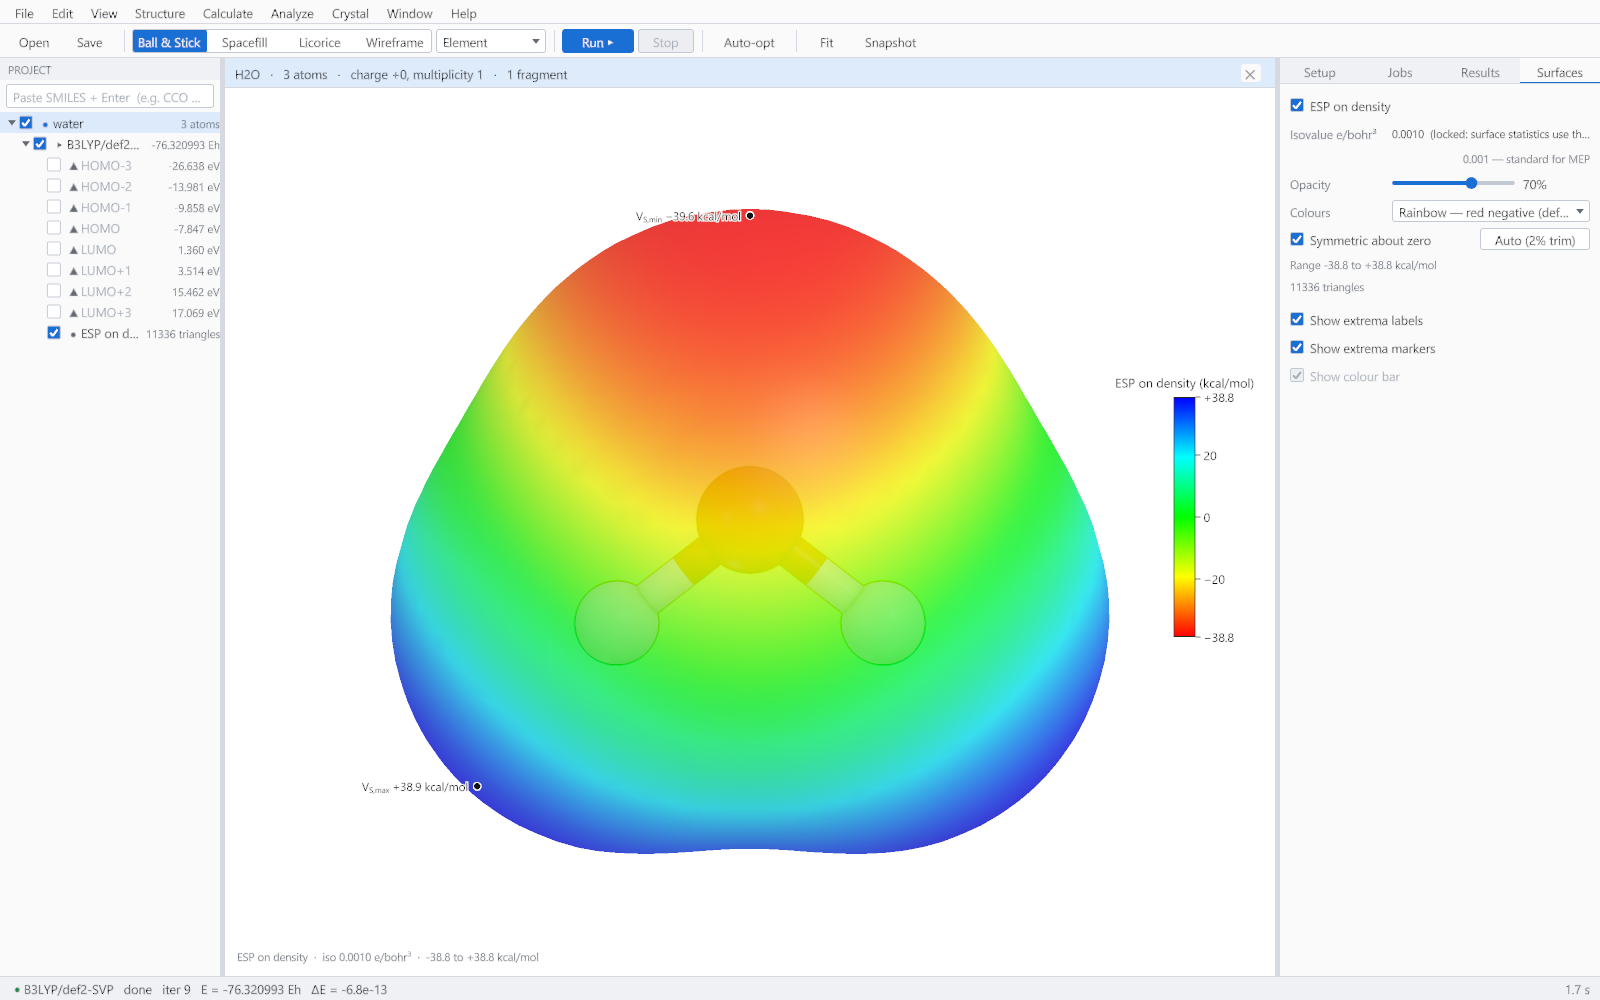
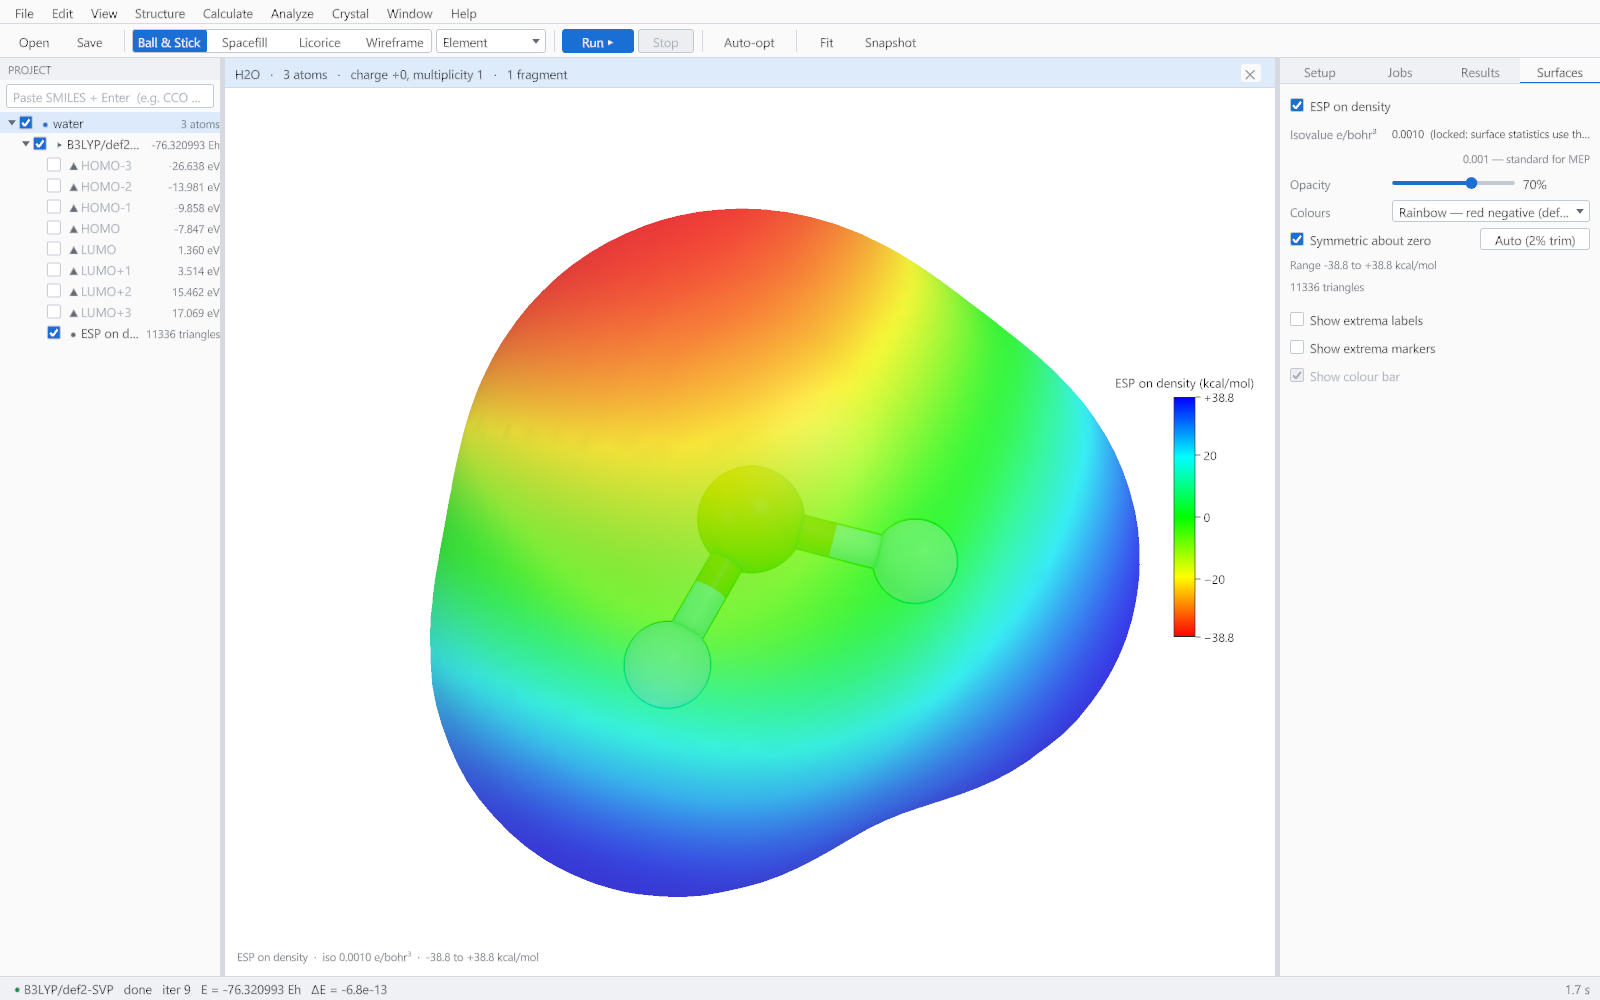
The labels stay attached to their points as the molecule is rotated, and a point that passes behind the surface is drawn hollow rather than left floating over the front of the picture.
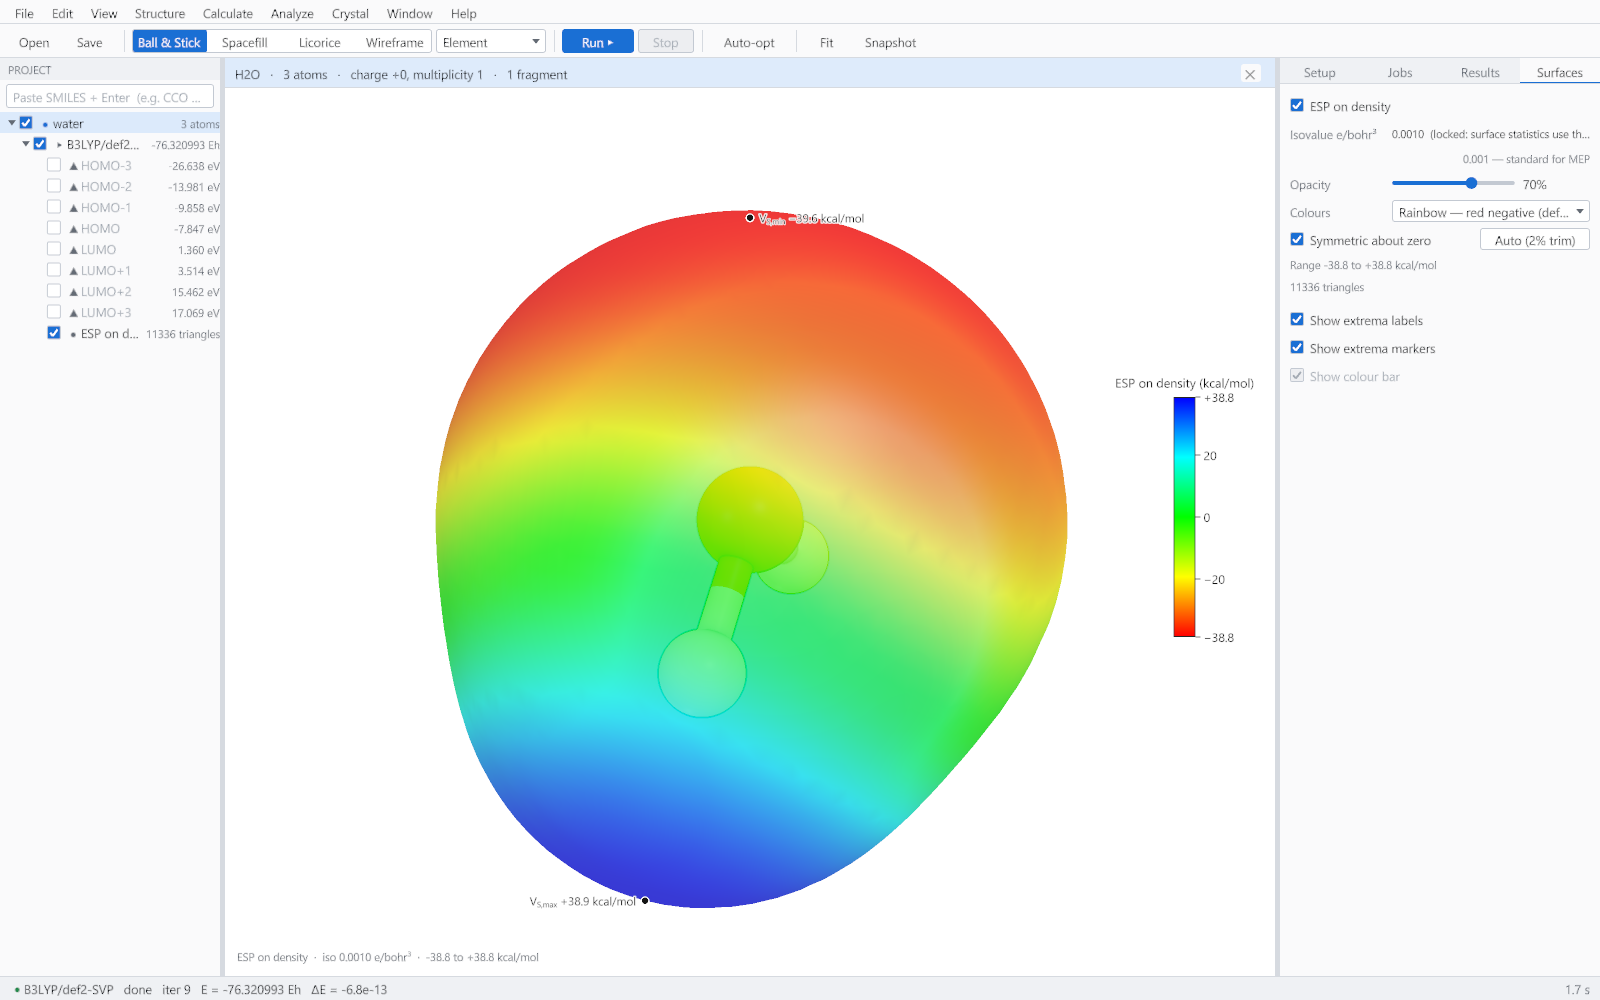
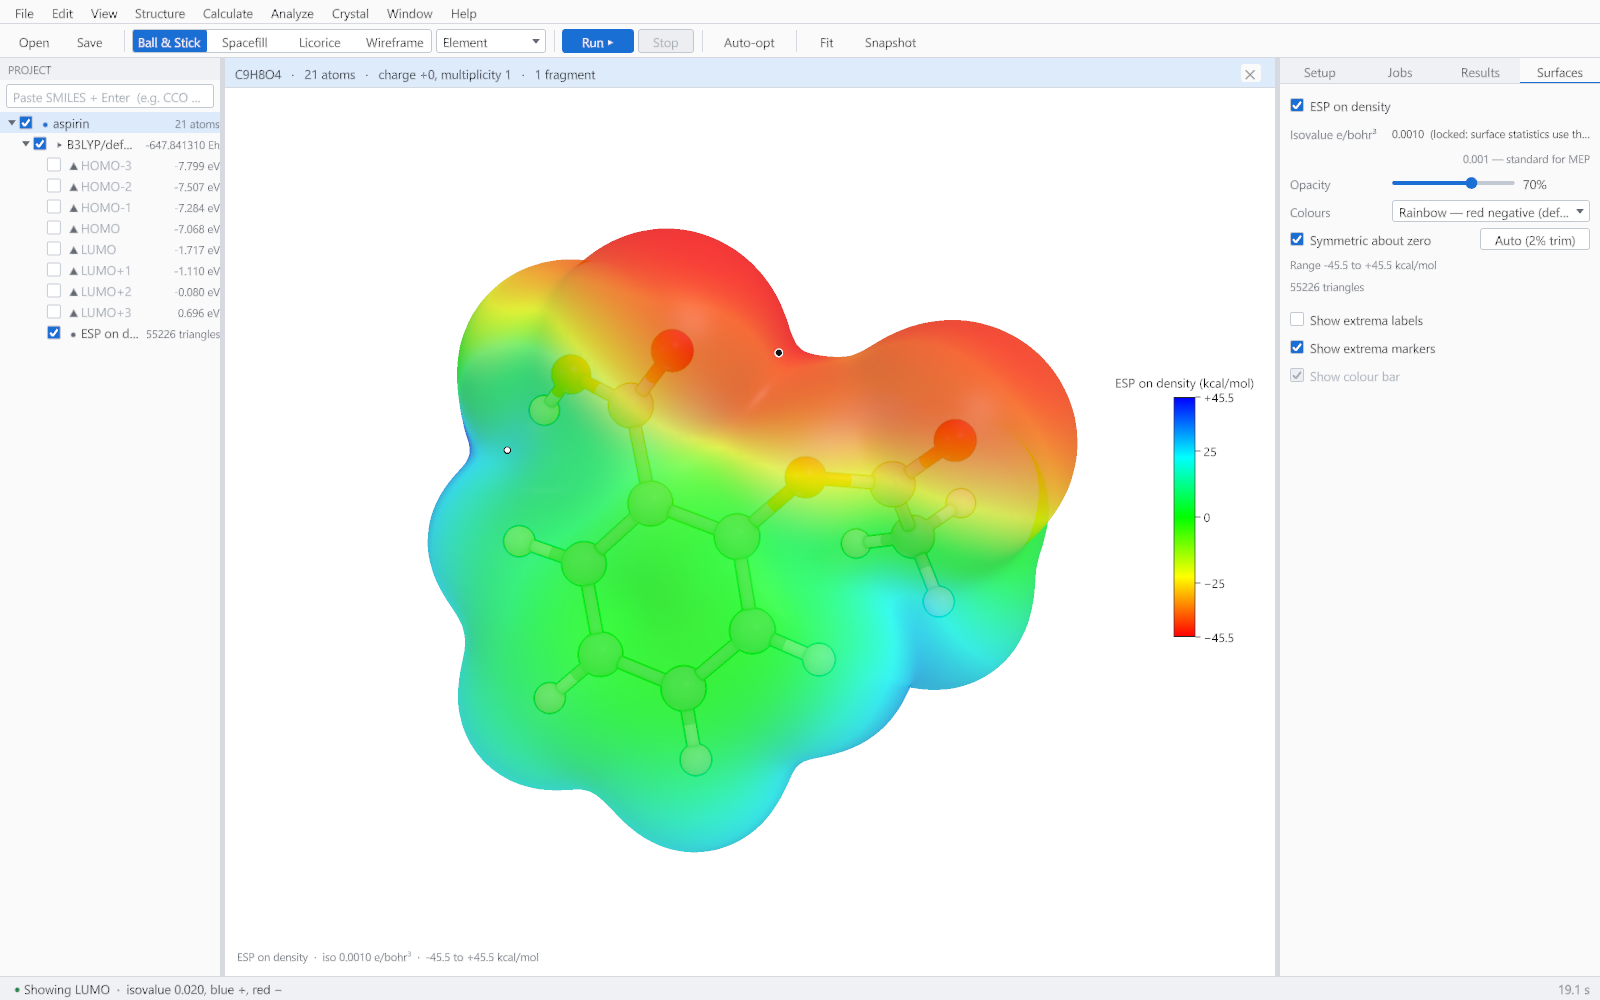
The same surface as a publication figure
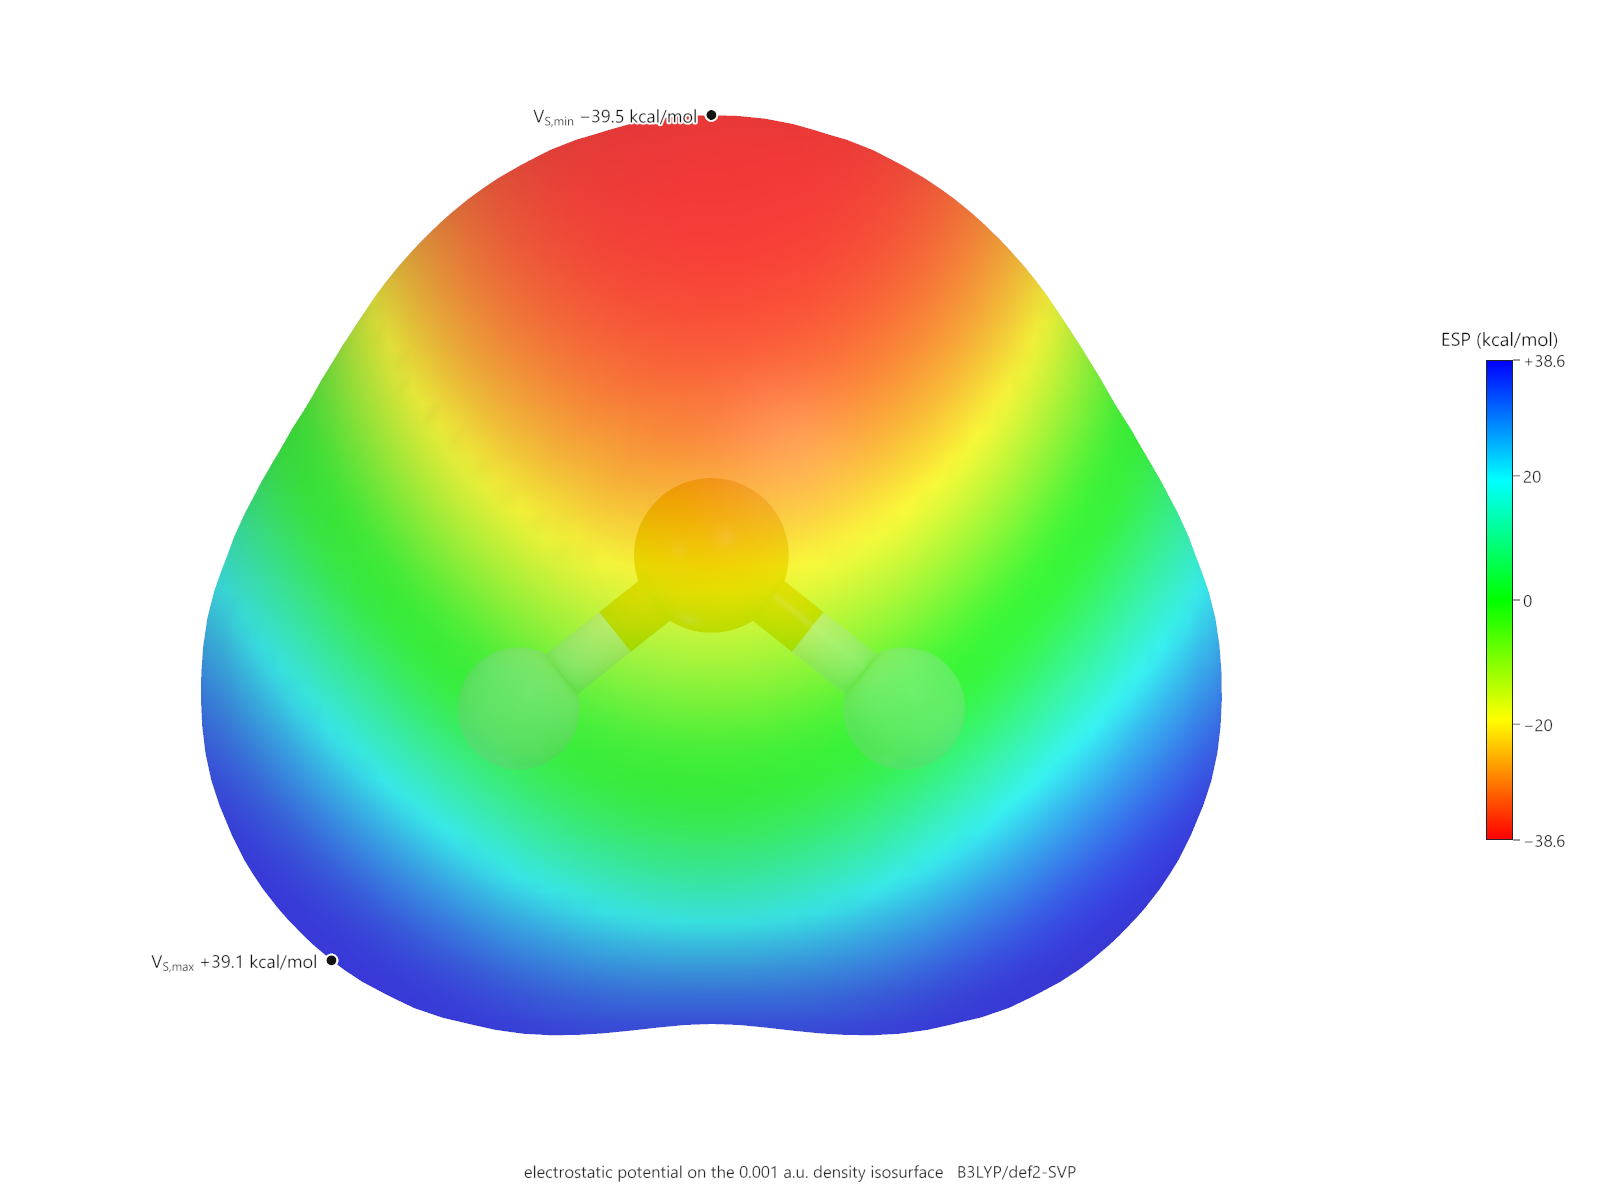
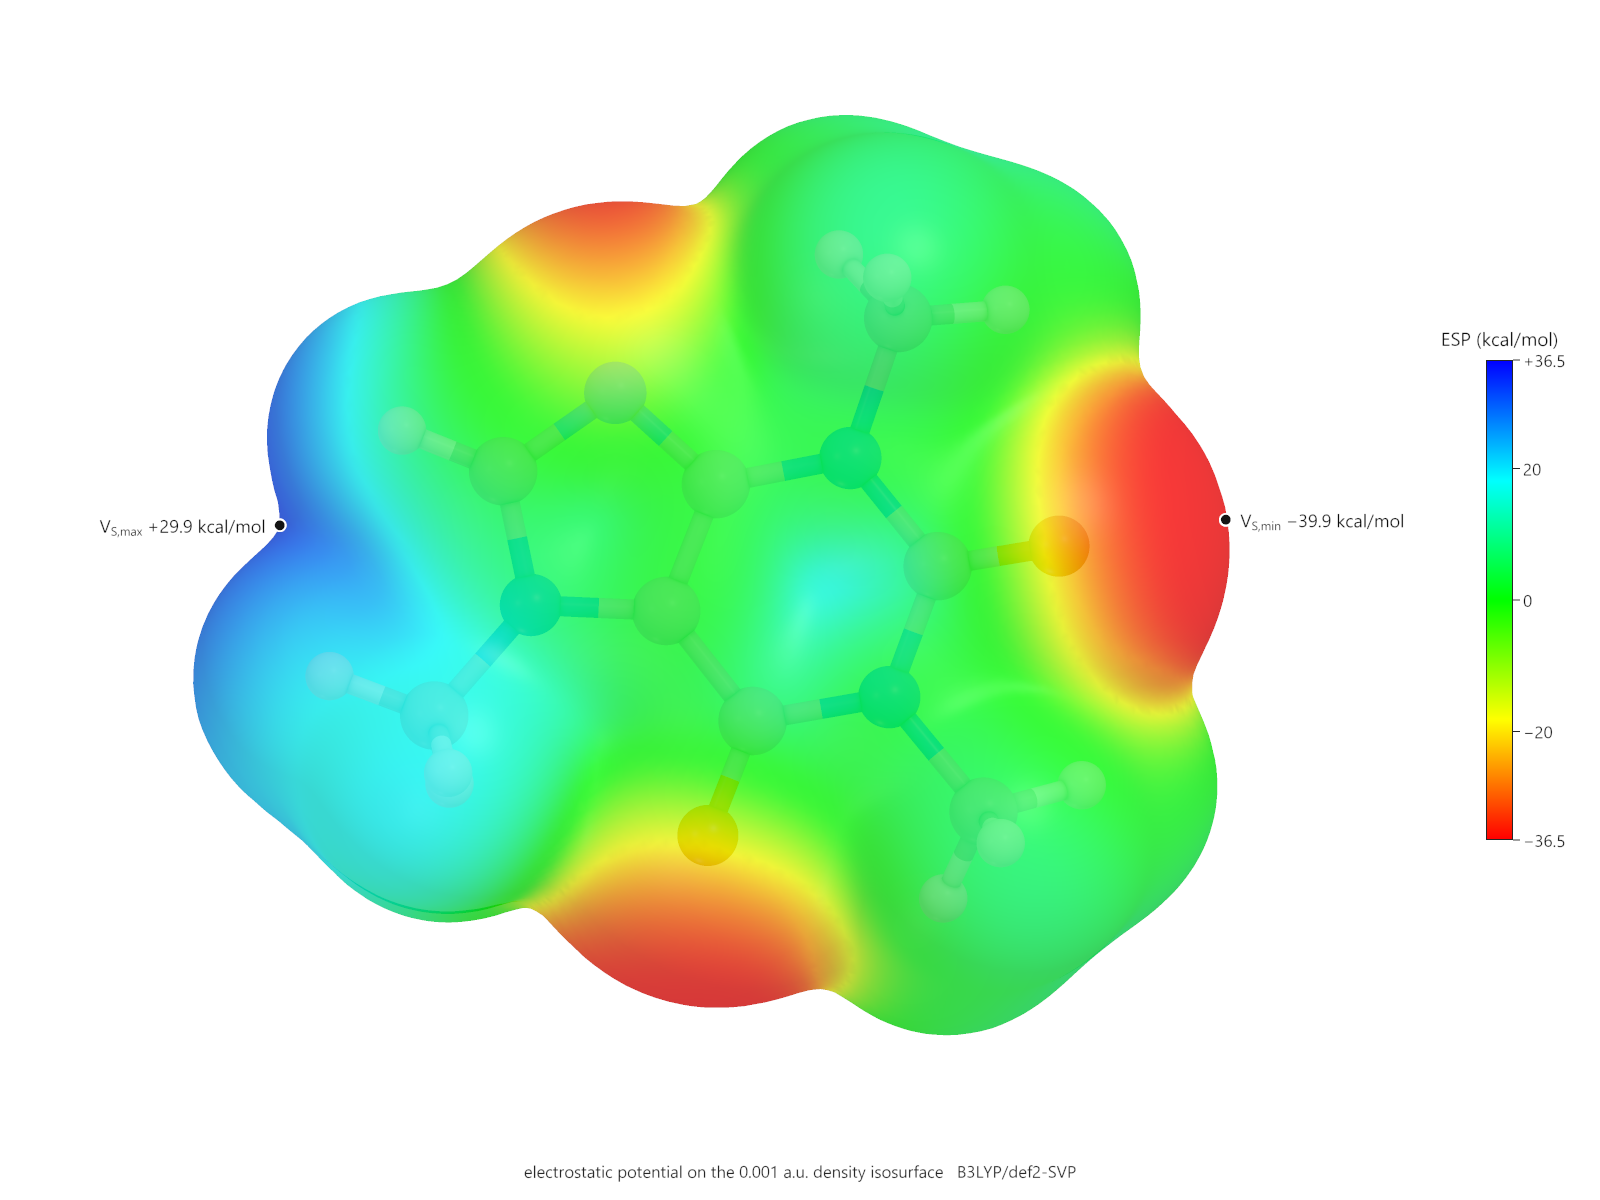
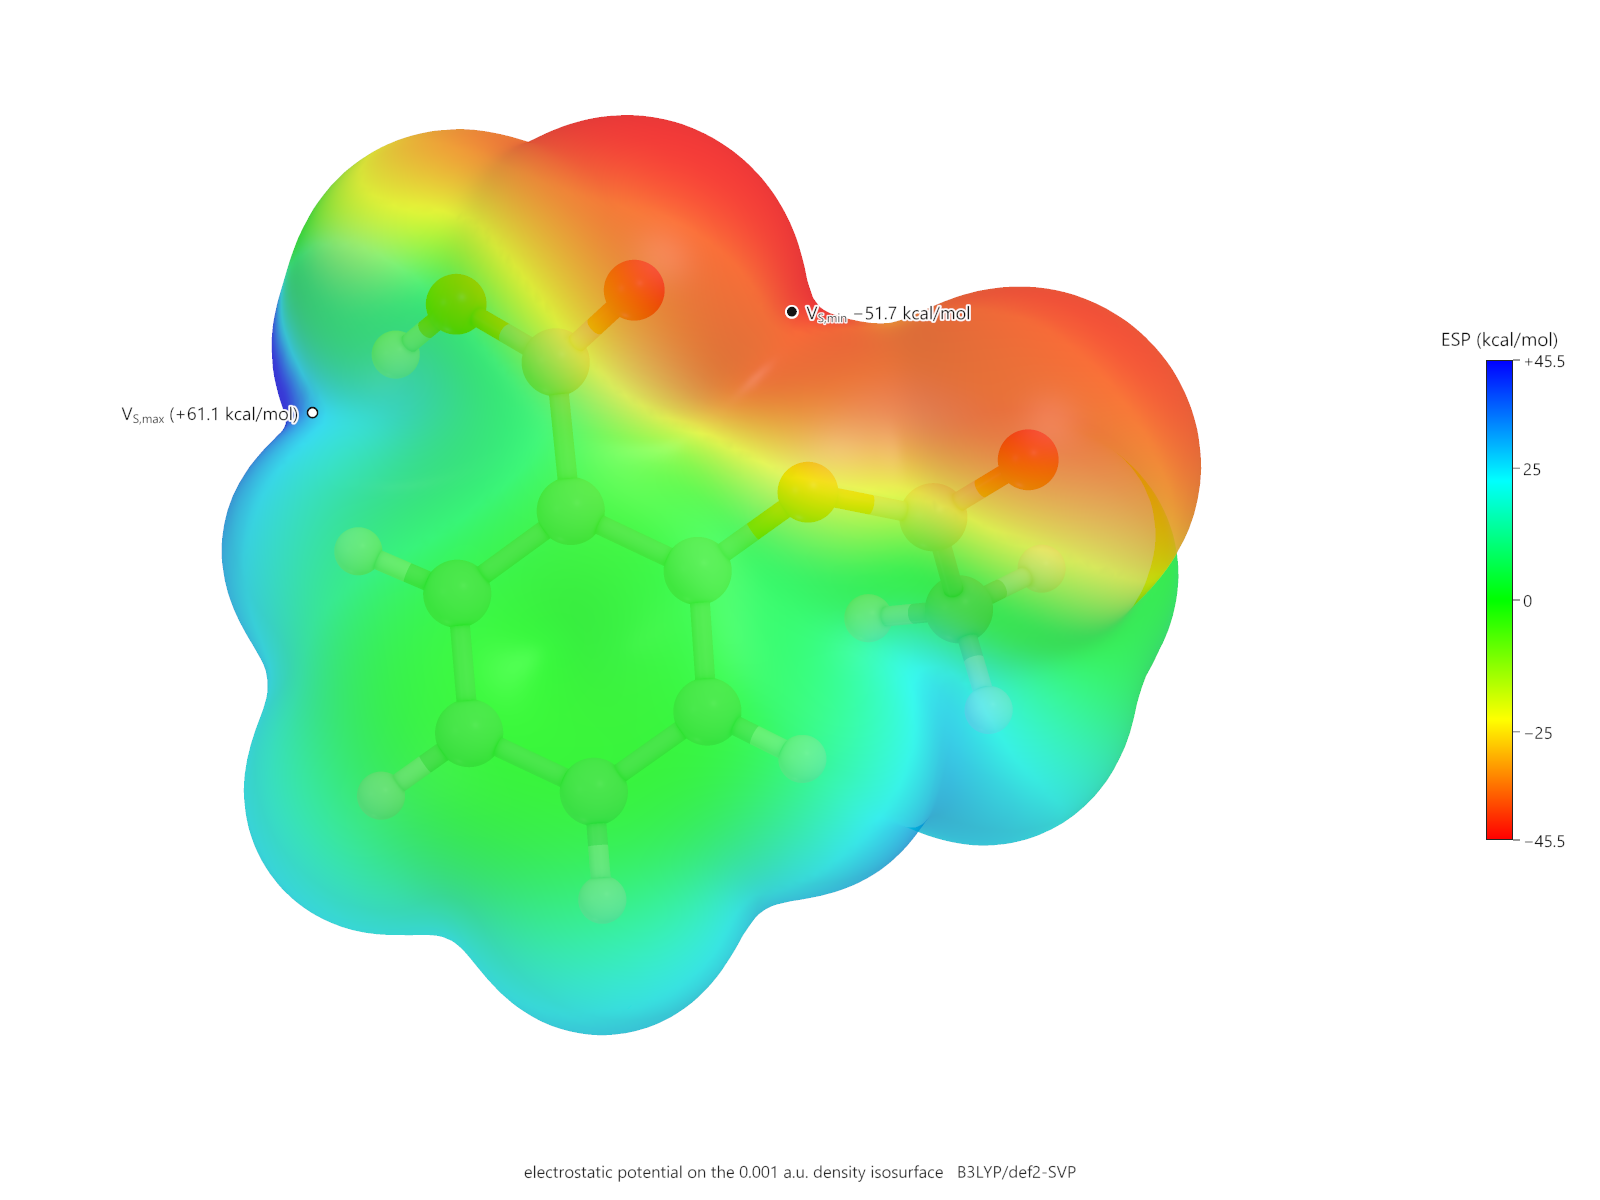
The figures below came from the same calculations, exported through the figure renderer rather than captured from the window. The colour bar, the extrema labels and the caption are part of the image, so the figure explains itself wherever it is reproduced.
Typical values
| Molecule | VS,min | VS,max | Reading |
|---|---|---|---|
| Water | -36 kcal/mol | +43 kcal/mol | A strong acceptor at the oxygen lone pairs and a strong donor at the hydrogens. |
| Aspirin | -52 kcal/mol | +61 kcal/mol | The carboxylic acid dominates both ends of the scale. |
| Caffeine | -40 kcal/mol | +30 kcal/mol | Carbonyl oxygens accept; no acidic hydrogen, so the maximum is modest. |