Home › Orbital energies and orbitals
Orbital energies and orbitals
The level diagram, what its labels mean, and how to draw any orbital in the viewer.
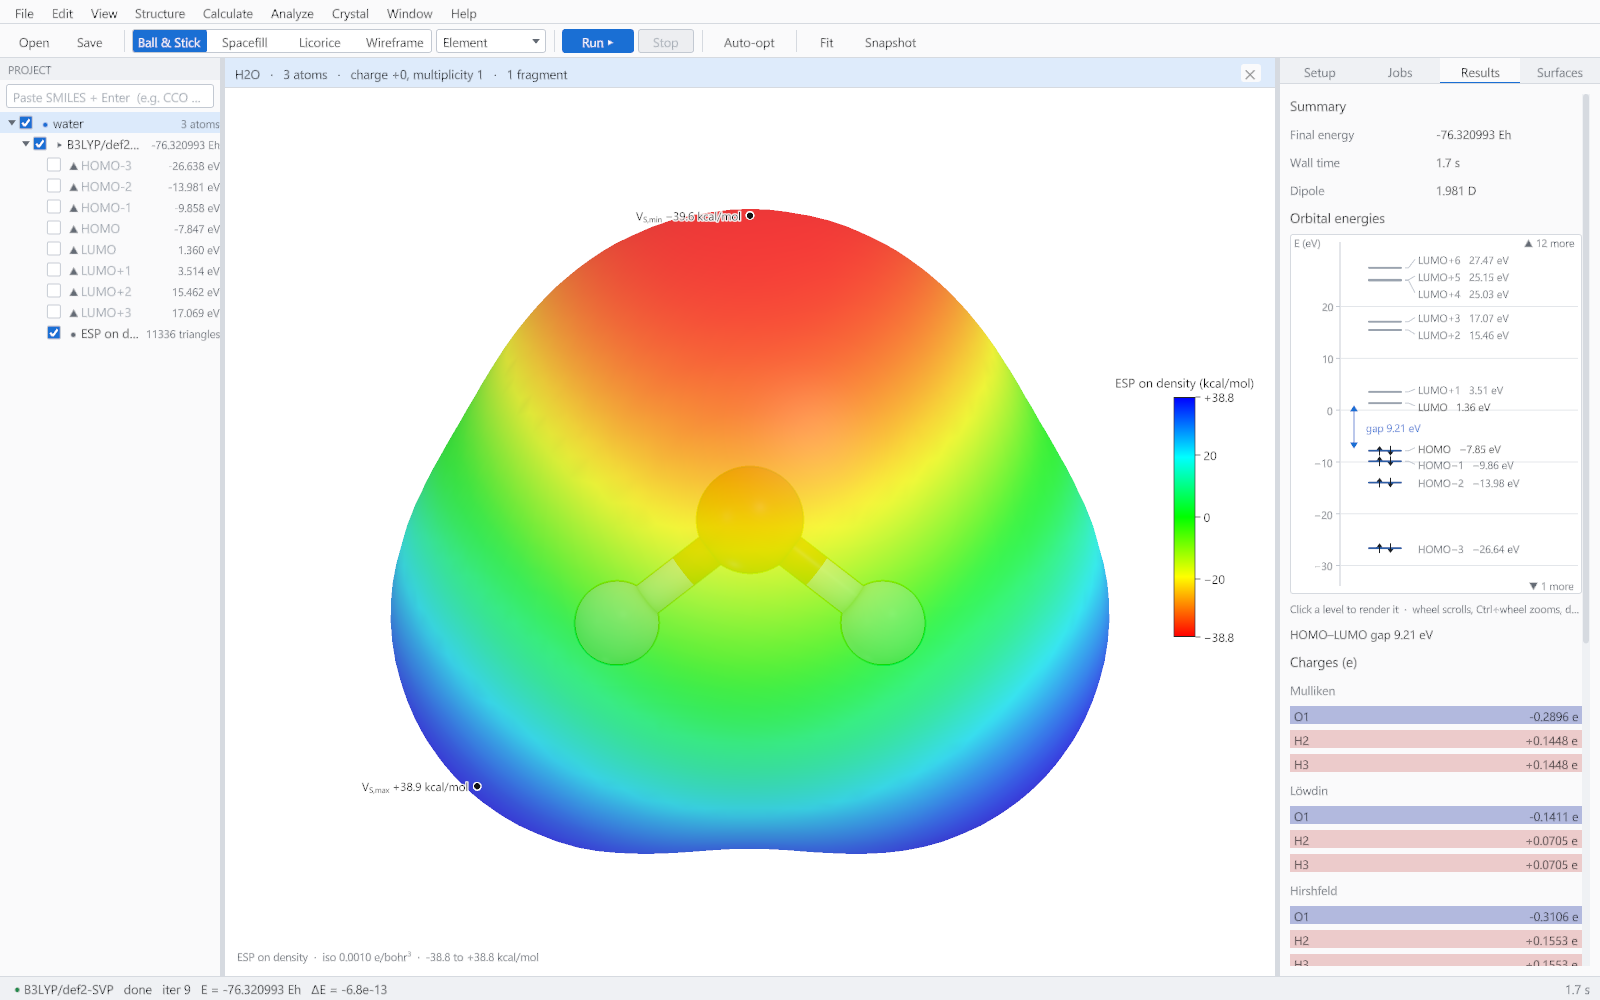
Reading the diagram
| Feature | Meaning |
|---|---|
| The axis | Orbital energy in electronvolts. Zero is the vacuum level, so occupied orbitals are negative. |
| Occupied levels | Drawn with their electrons. The highest is labelled HOMO, and the ones below it HOMO-1, HOMO-2 and so on. |
| Empty levels | Drawn without electrons, the lowest labelled LUMO. |
| The gap | The HOMO to LUMO separation, marked between the two levels and repeated as a number underneath. |
| Near-degenerate levels | Drawn side by side rather than on top of one another, so two orbitals a few millielectronvolts apart are still two visible levels. |
| The counts | The levels not currently in view, above and below. The diagram opens on the frontier region because that is where the chemistry is, and scrolls to the core levels when you want them. |
Working with the diagram
| Action | Result |
|---|---|
| Hover a level | Its label, energy in both electronvolts and hartree, and occupancy. |
| Click a level | Renders that orbital in the viewer. |
| Wheel | Scrolls through the levels. |
| Ctrl and wheel | Zooms the energy axis about the cursor. |
| Double click | Returns to the default view. |
Drawing an orbital
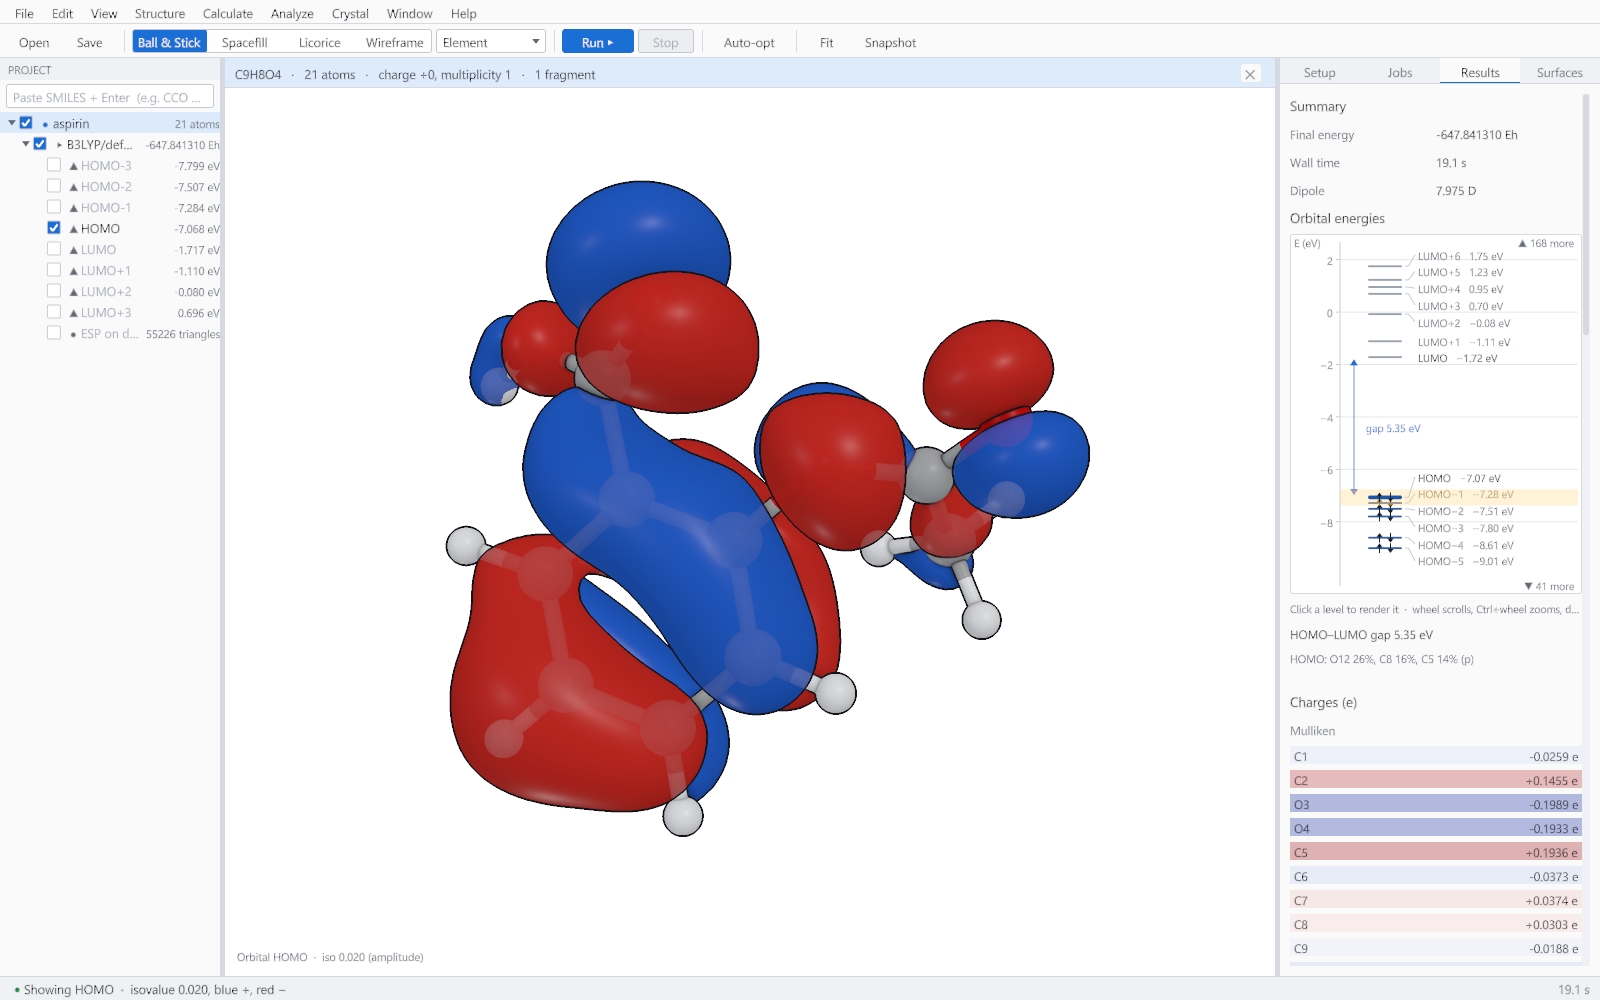
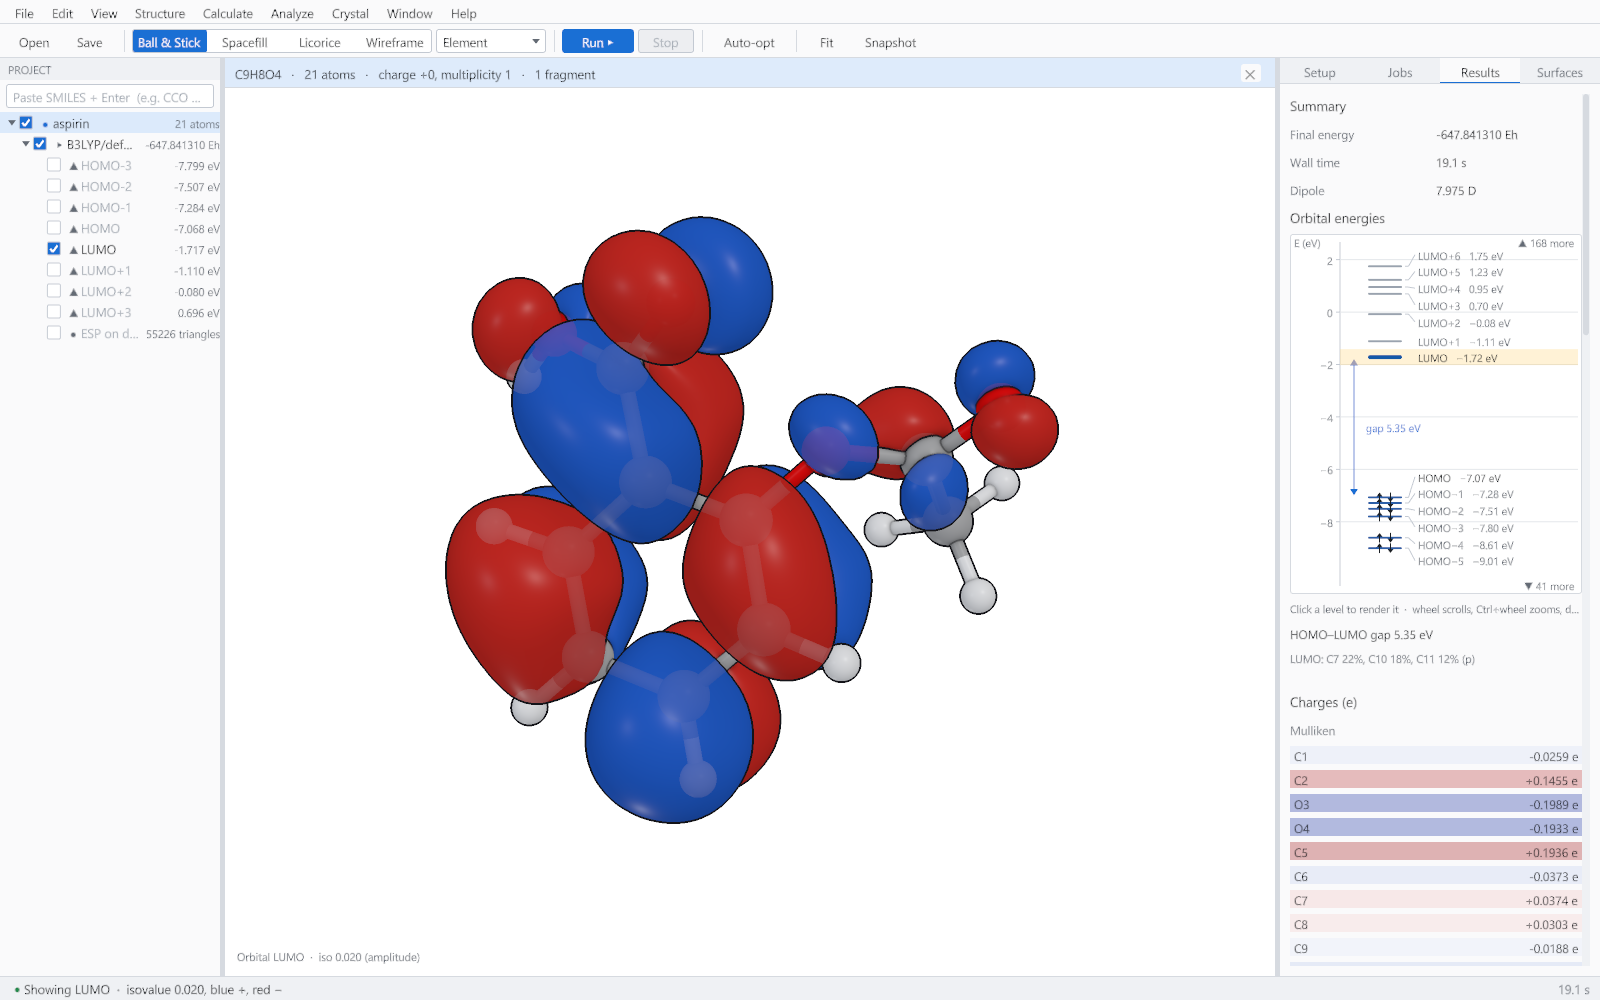
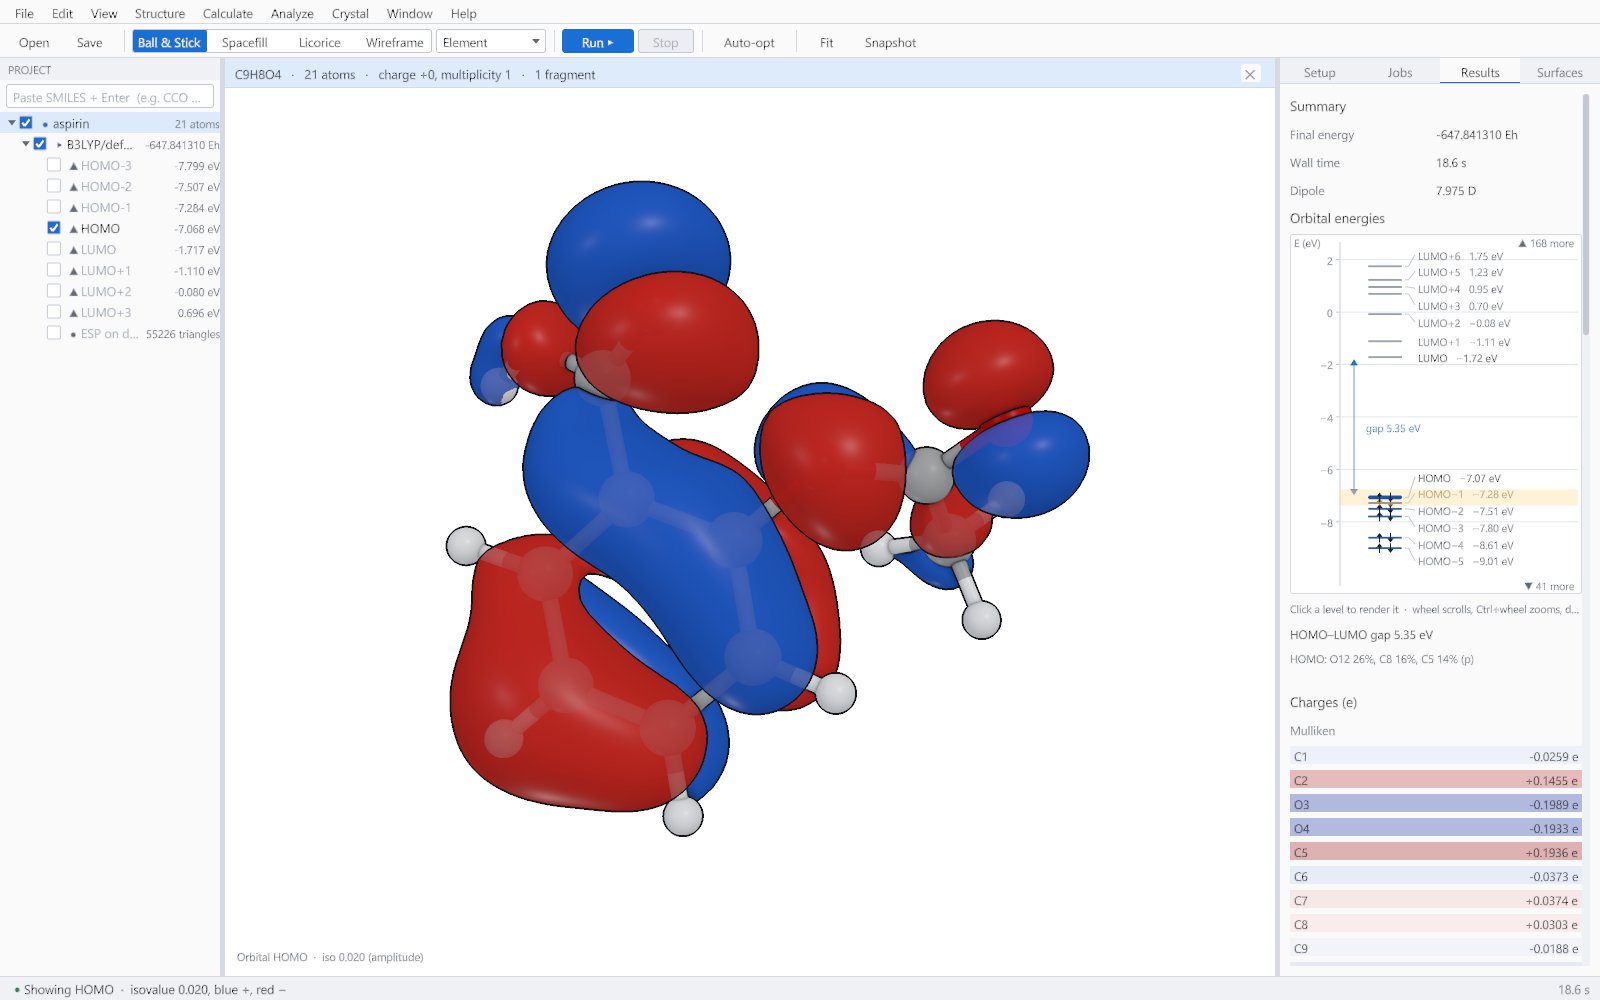
Analyze > Show HOMO and Show LUMO are the quick route, and any orbital in the list can be ticked in the project tree. The two lobes are the two signs of the wavefunction, drawn blue for positive and red for negative at an isovalue of 0.020, which is the convention most readers will expect.
Orbital composition
Under the diagram the frontier orbitals are broken down by the atoms that contribute to them, as percentages, with the dominant angular character in brackets. This is what turns a picture into a statement: not merely that the HOMO is on one side of the molecule, but that it is twenty-six per cent on one oxygen.
An orbital is a one-electron function from a particular calculation, not an observable. Its shape is a sound guide to where the reactive density sits; its energy is a far rougher guide to an ionisation potential, and only Hartree-Fock orbital energies have that interpretation directly.