GeinDFT
Home › Crystal analysis

Crystal analysis

Reading a crystal structure, generating the packing, and analysing the intermolecular contacts with Hirshfeld surfaces and fingerprint plots.

A CIF describes one asymmetric unit together with the symmetry that generates the rest. GeinDFT expands it, reconstructs whole molecules across the cell boundaries, and provides the standard tools for describing how the molecules touch one another.
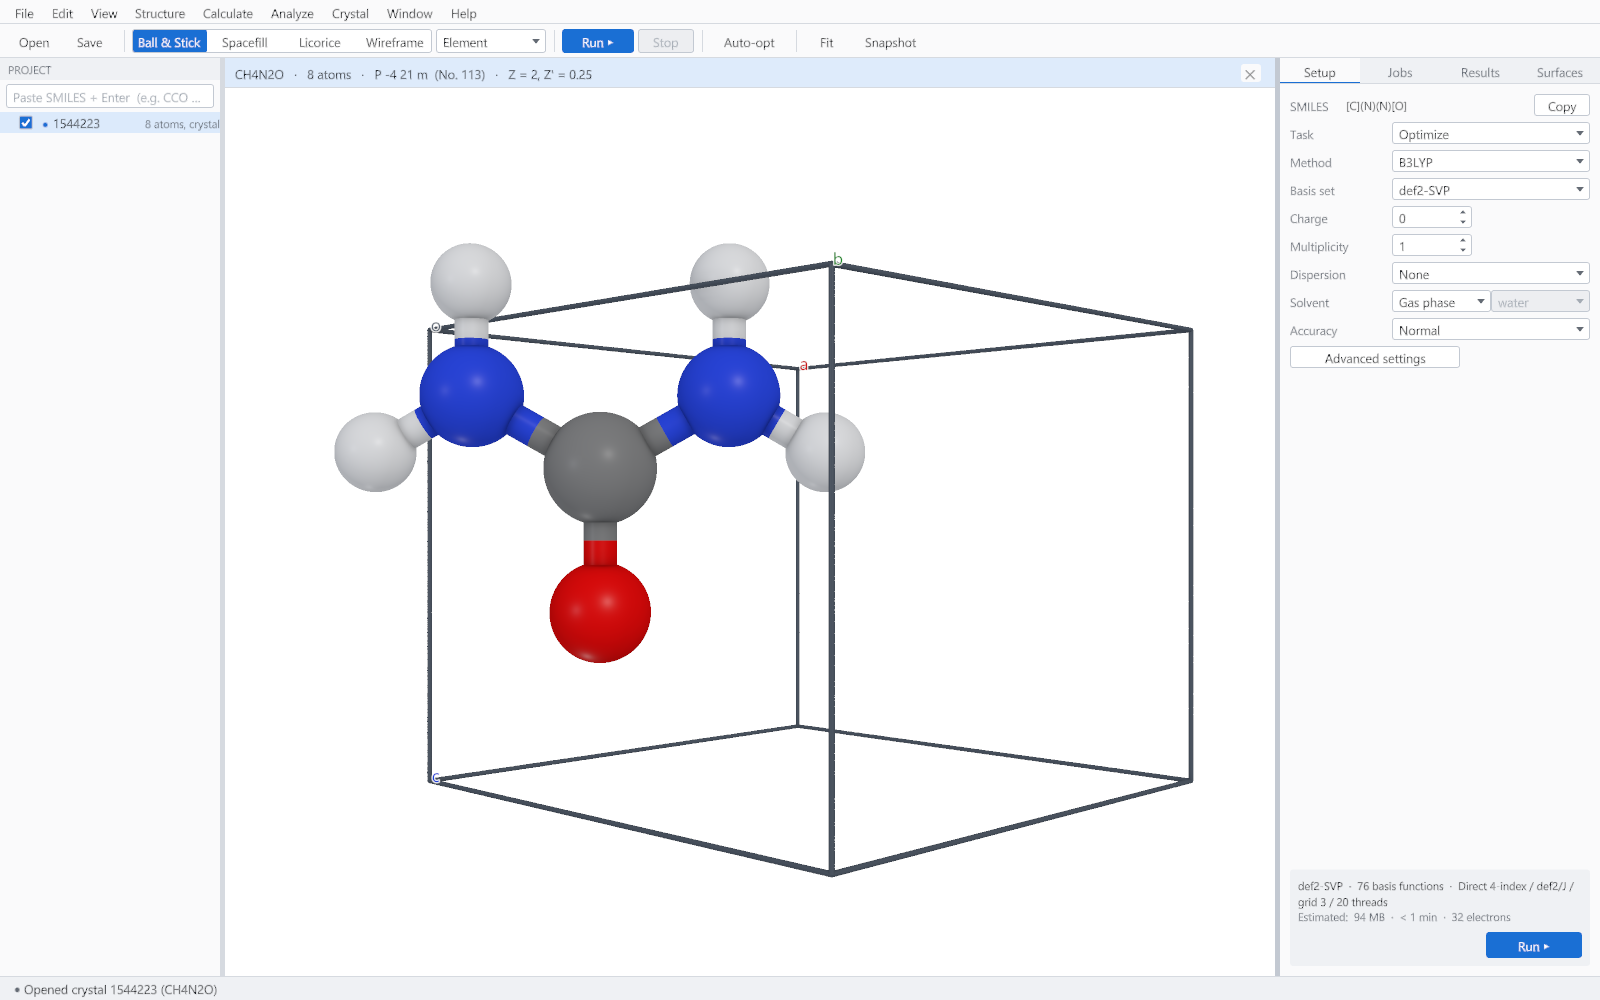
A molecule reconstructed from a crystal structure. The fragments that the asymmetric unit split across cell boundaries have been rejoined.

The Crystal menu

CommandWhat it does
Unit CellDraws the cell edges around the structure.
PackingFills the cell with every symmetry-generated molecule.
ClusterBuilds a cluster of the molecules surrounding a chosen one, which is what an interaction analysis needs.
ContactsFinds hydrogen bonds, halogen bonds, pi stacking, carbon-hydrogen to pi contacts, metal coordination and short contacts generally.
Export ContactsWrites the contact table for a spreadsheet.

Hirshfeld surfaces

A Hirshfeld surface divides space between a molecule and its neighbours: it is the surface where the molecule contributes half of the total promolecular electron density. It is therefore a description of the environment, not of the molecule alone, and the quantities mapped on it describe contact.

Mapped quantityShows
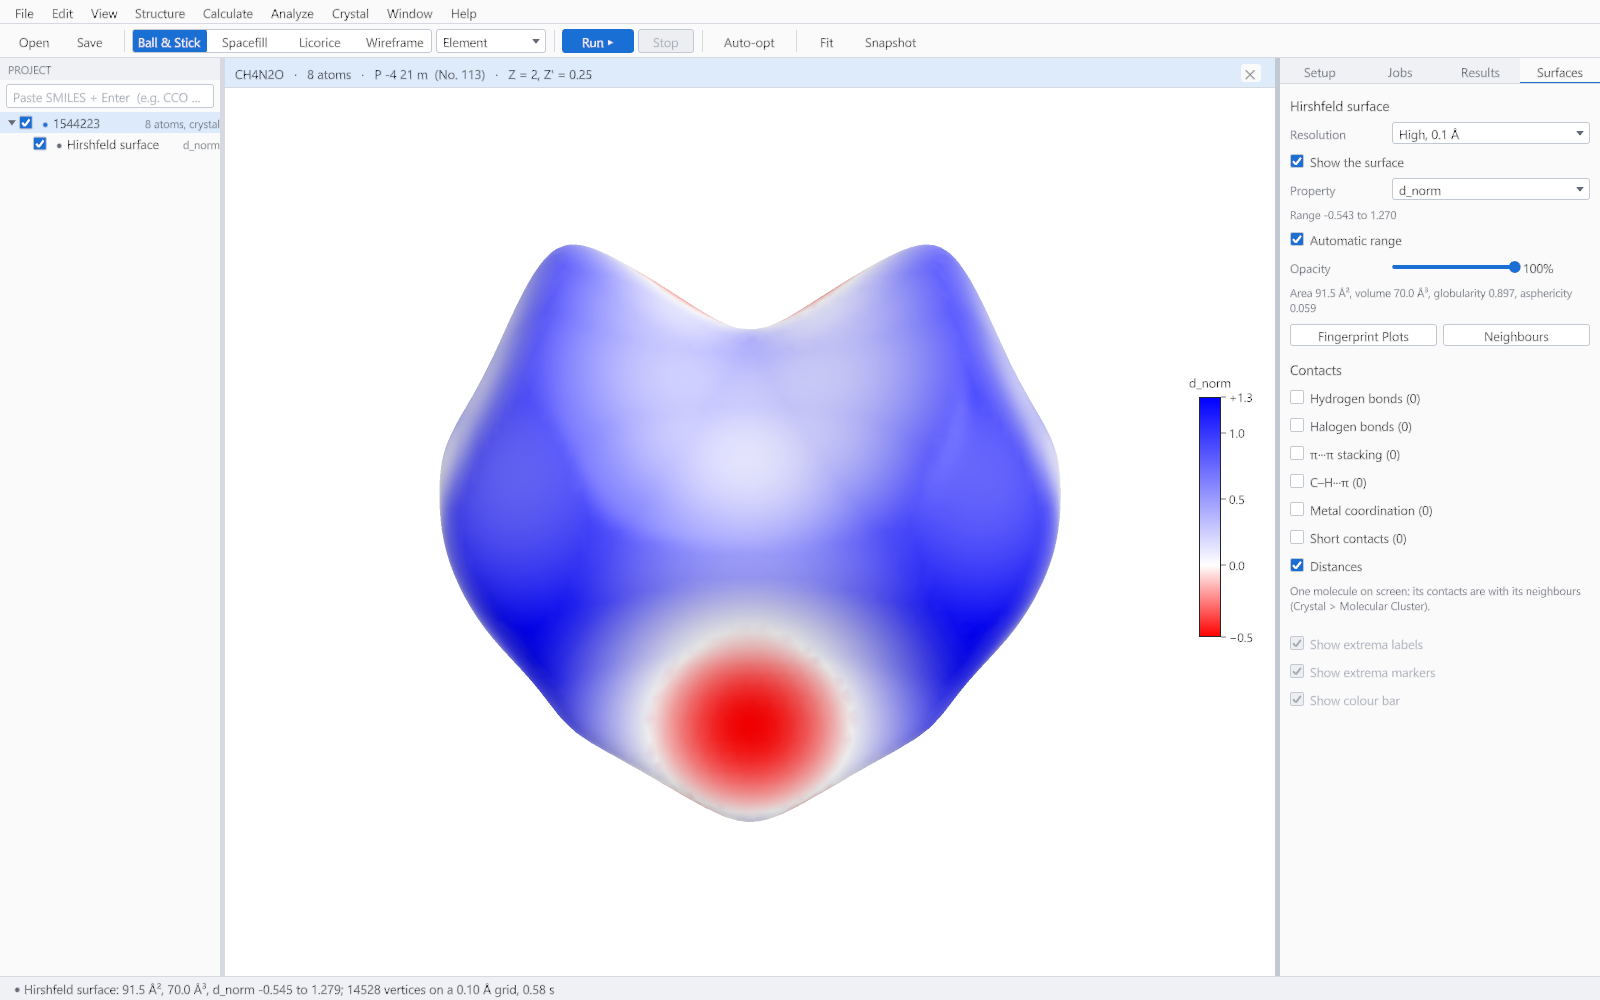
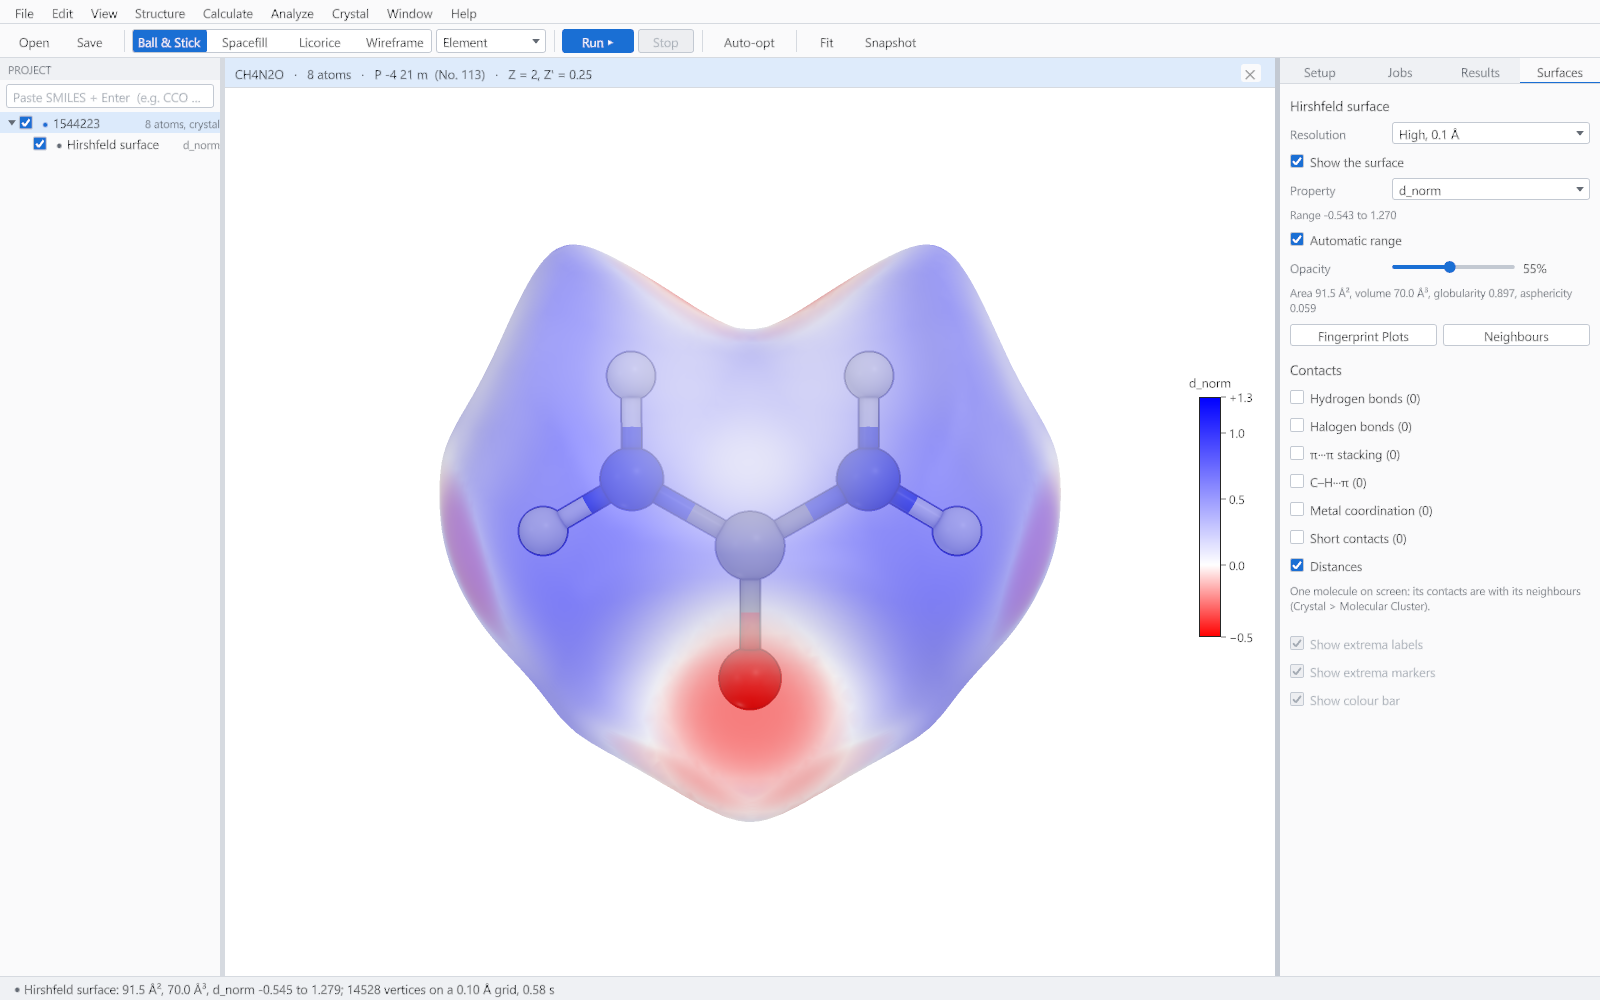
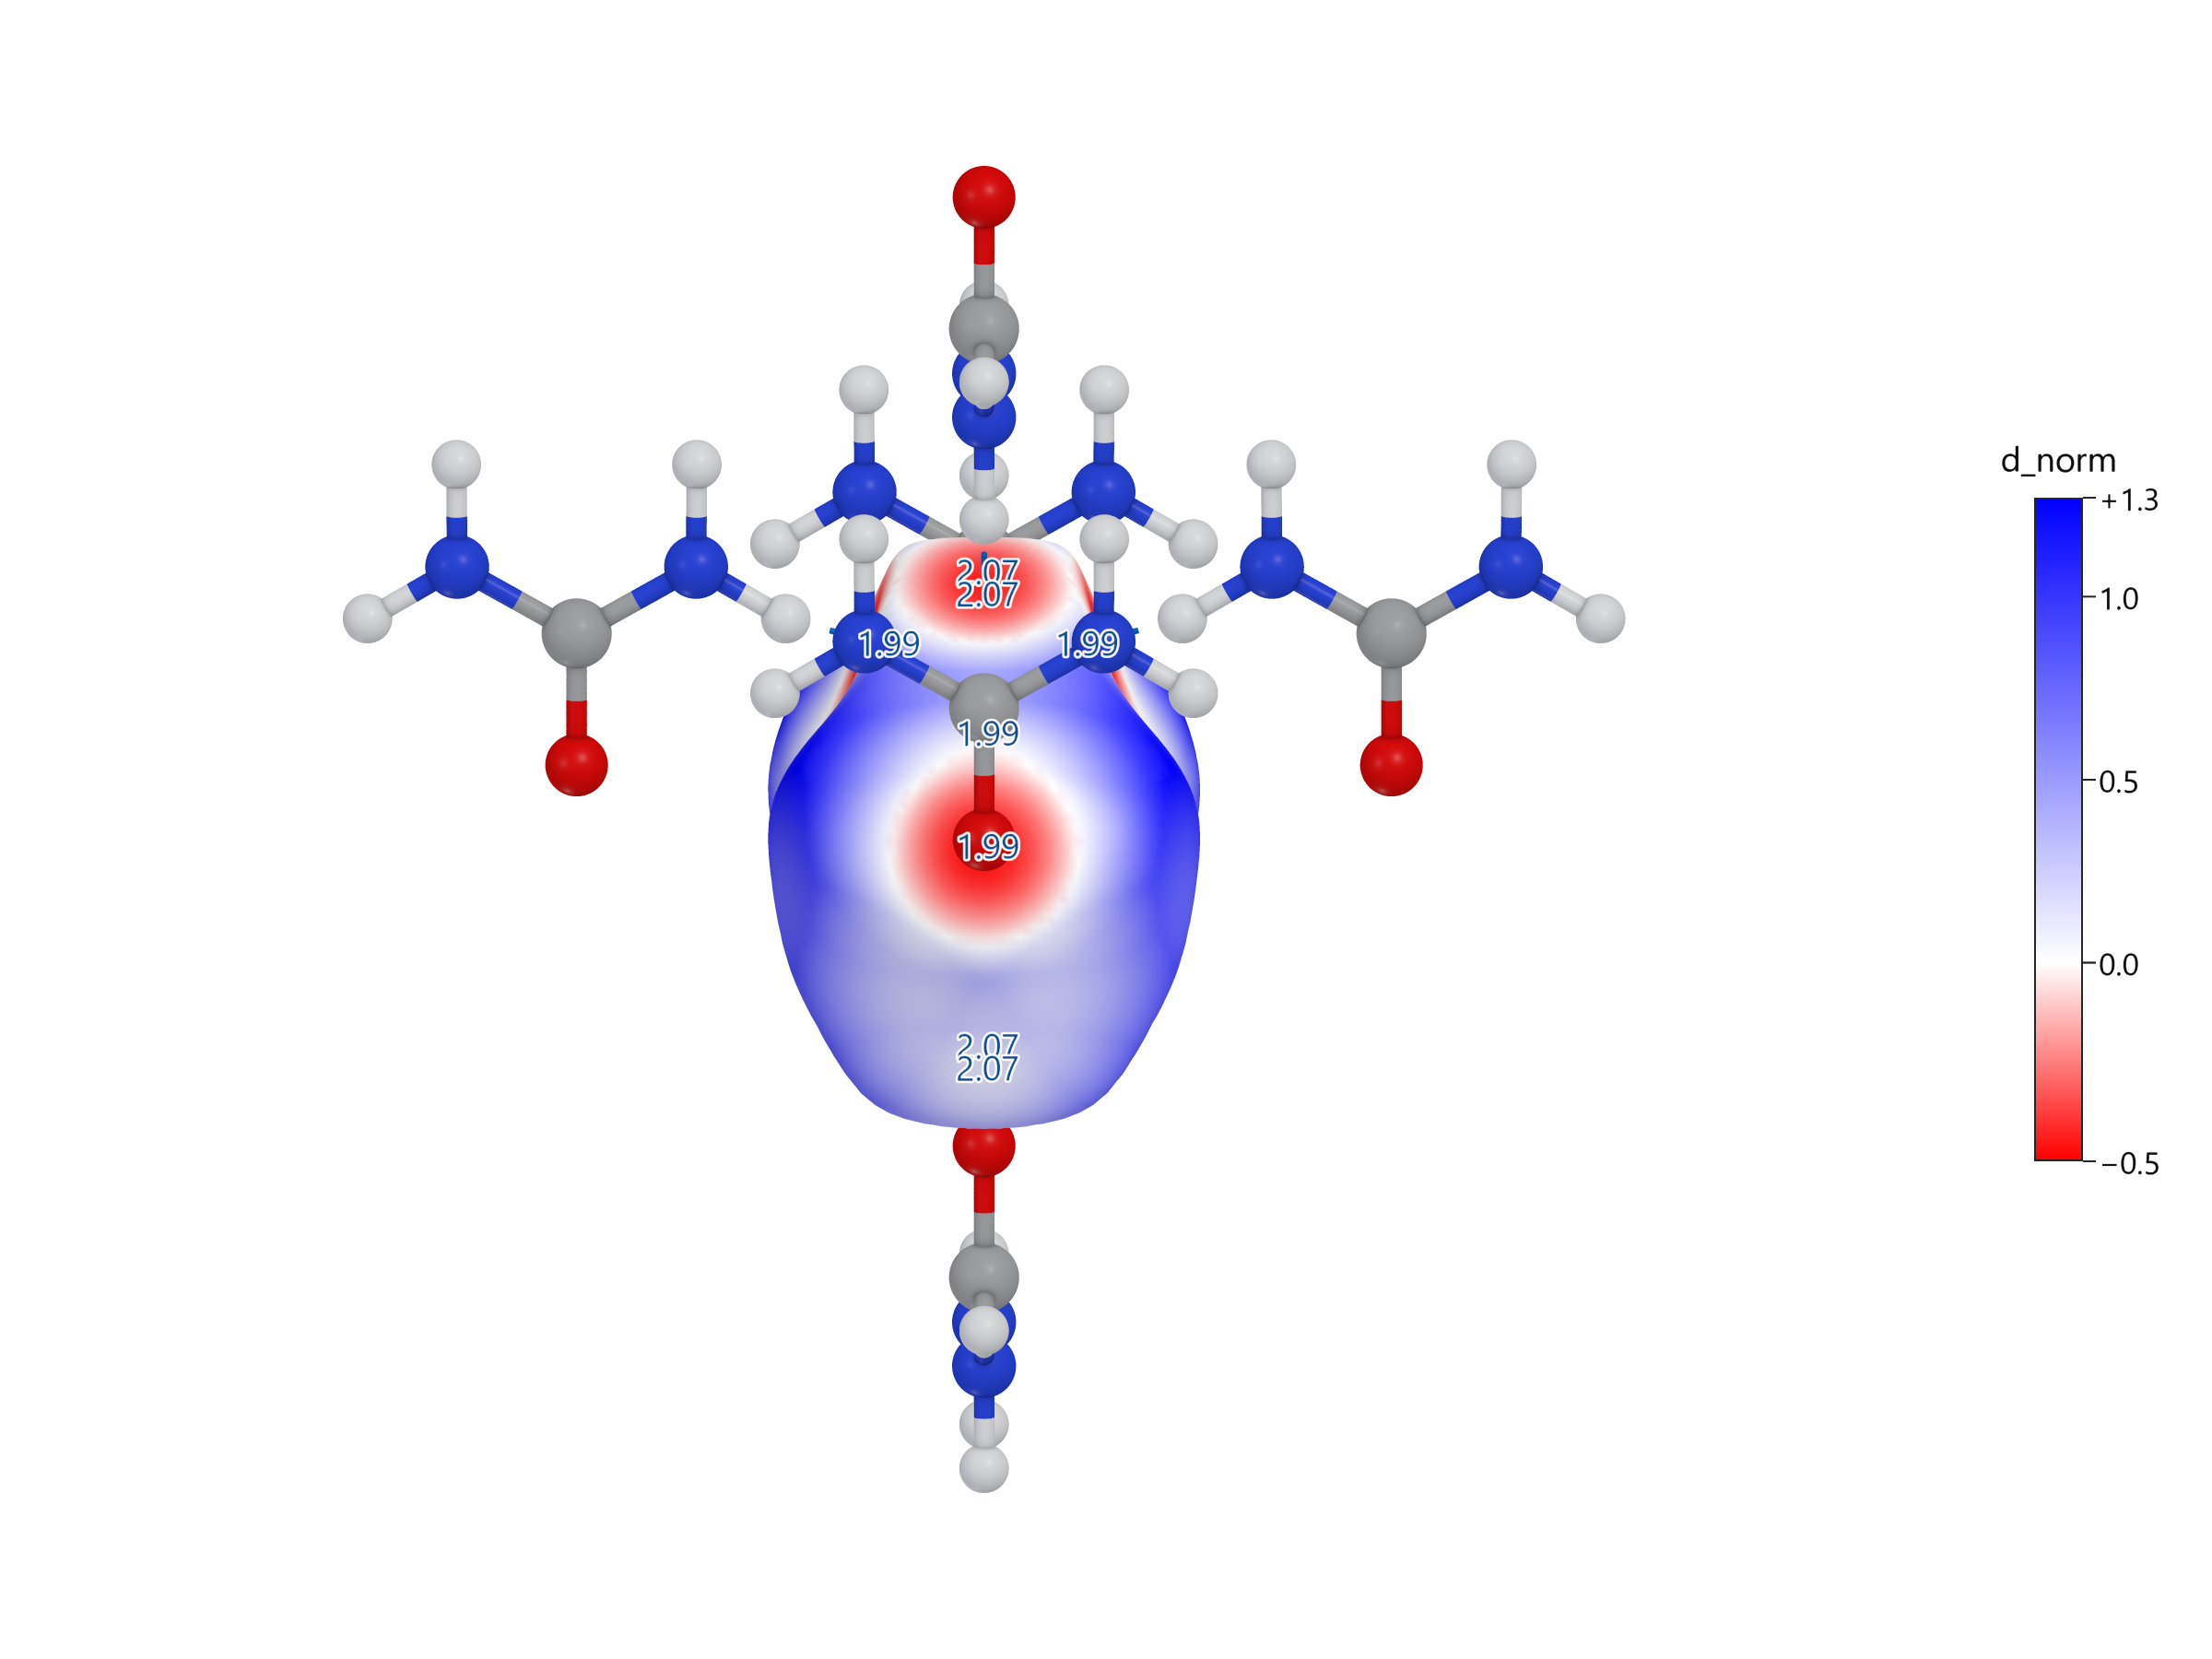
dnormContacts normalised by the van der Waals radii. Red spots mark contacts closer than the sum of the radii, which is the standard way to locate hydrogen bonds at a glance.
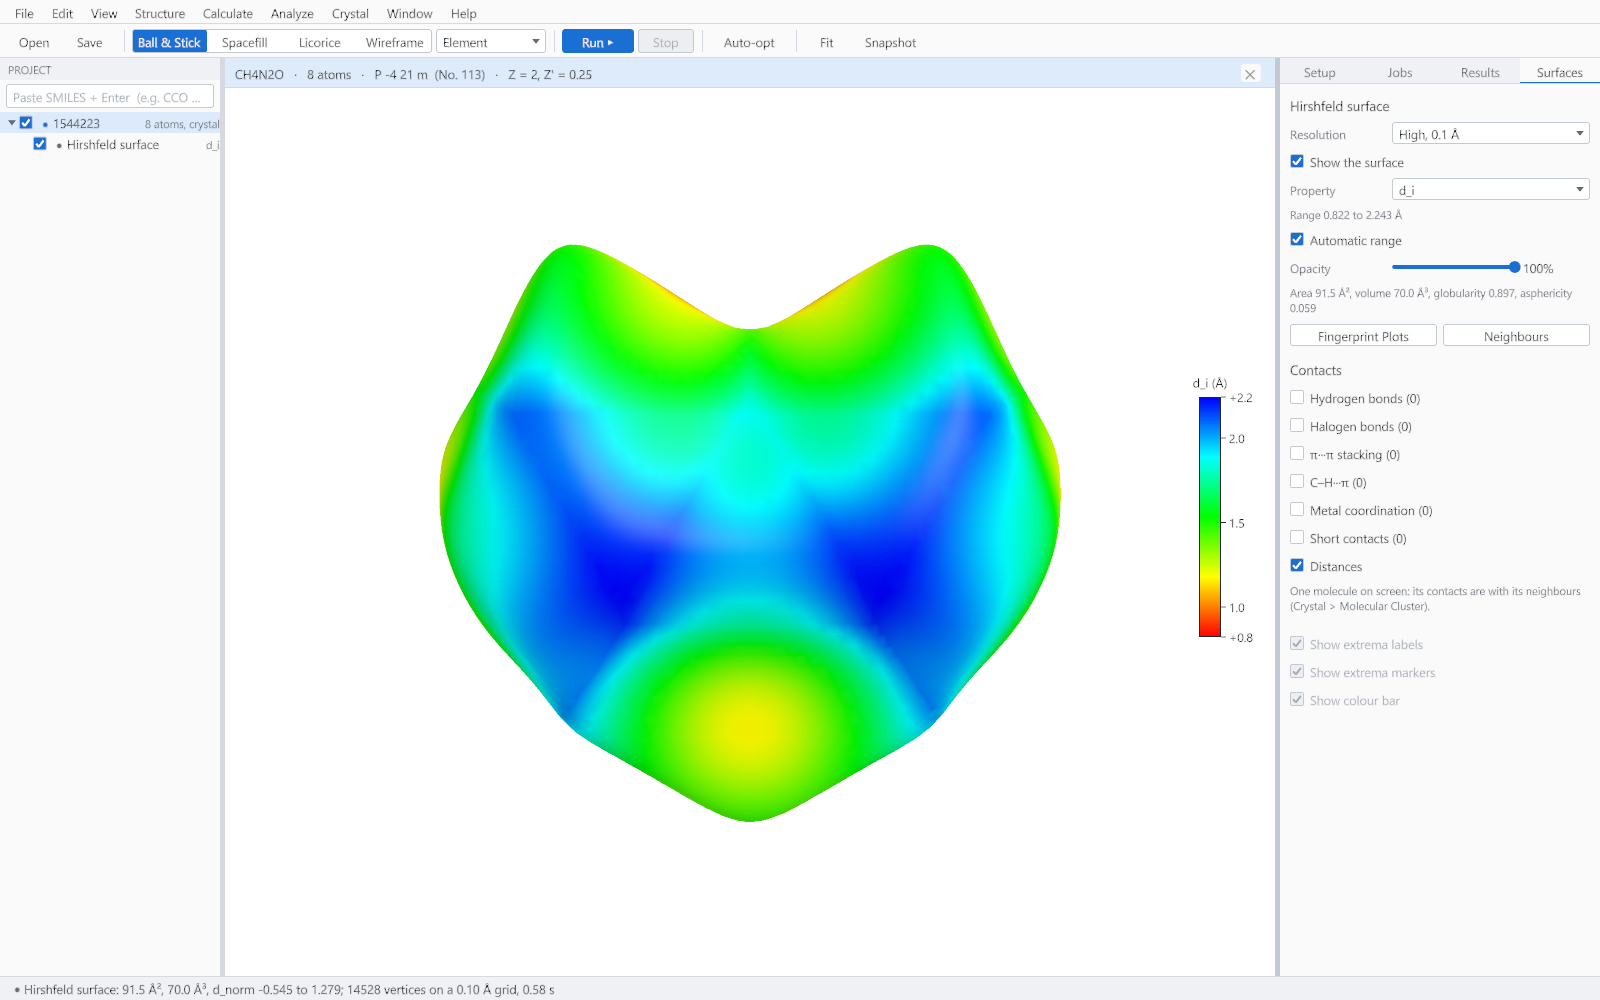
diDistance from the surface to the nearest nucleus inside.
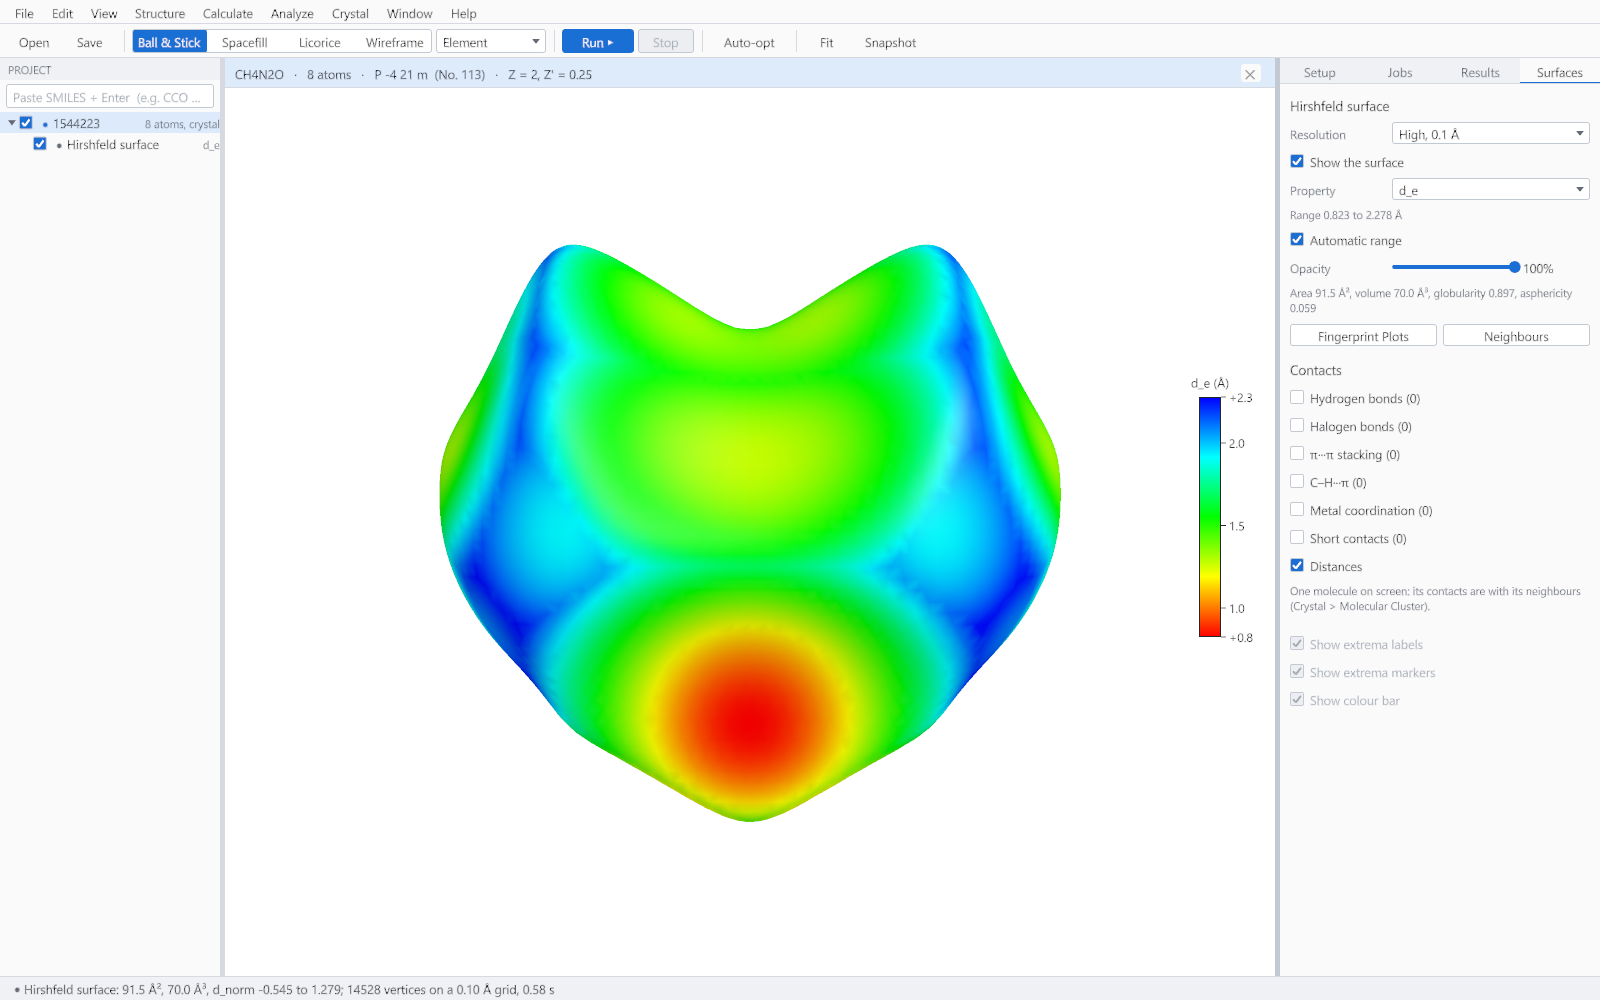
deDistance from the surface to the nearest nucleus outside.
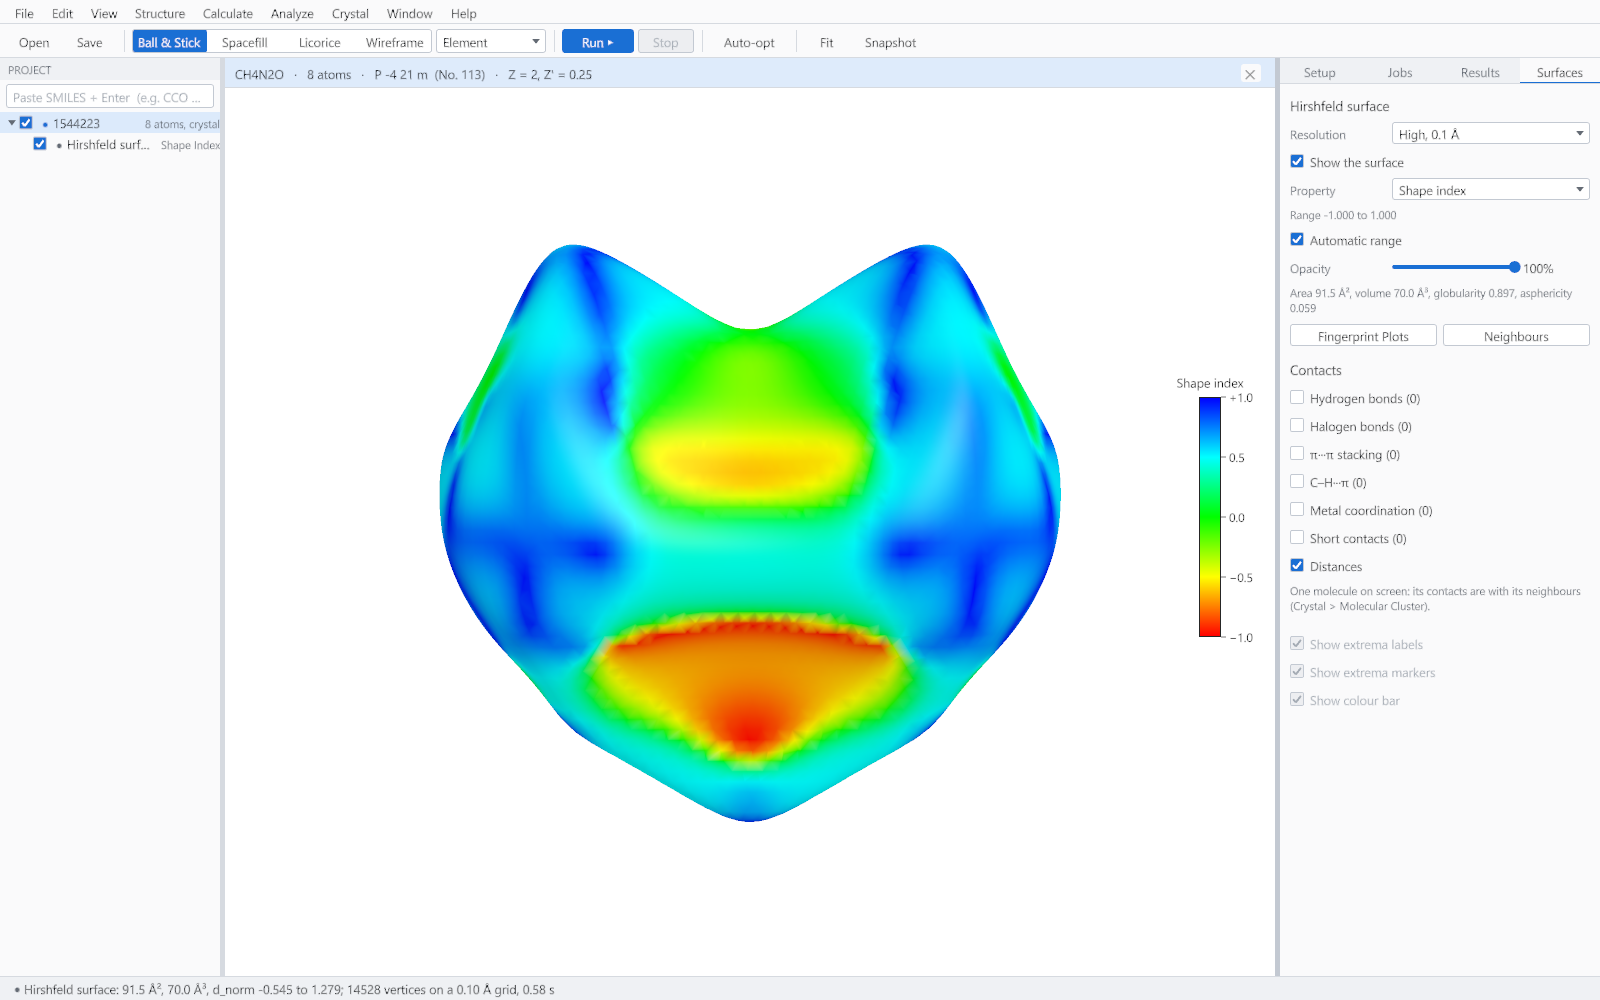
Shape indexThe local shape. Adjacent red and blue triangles are the signature of pi stacking.
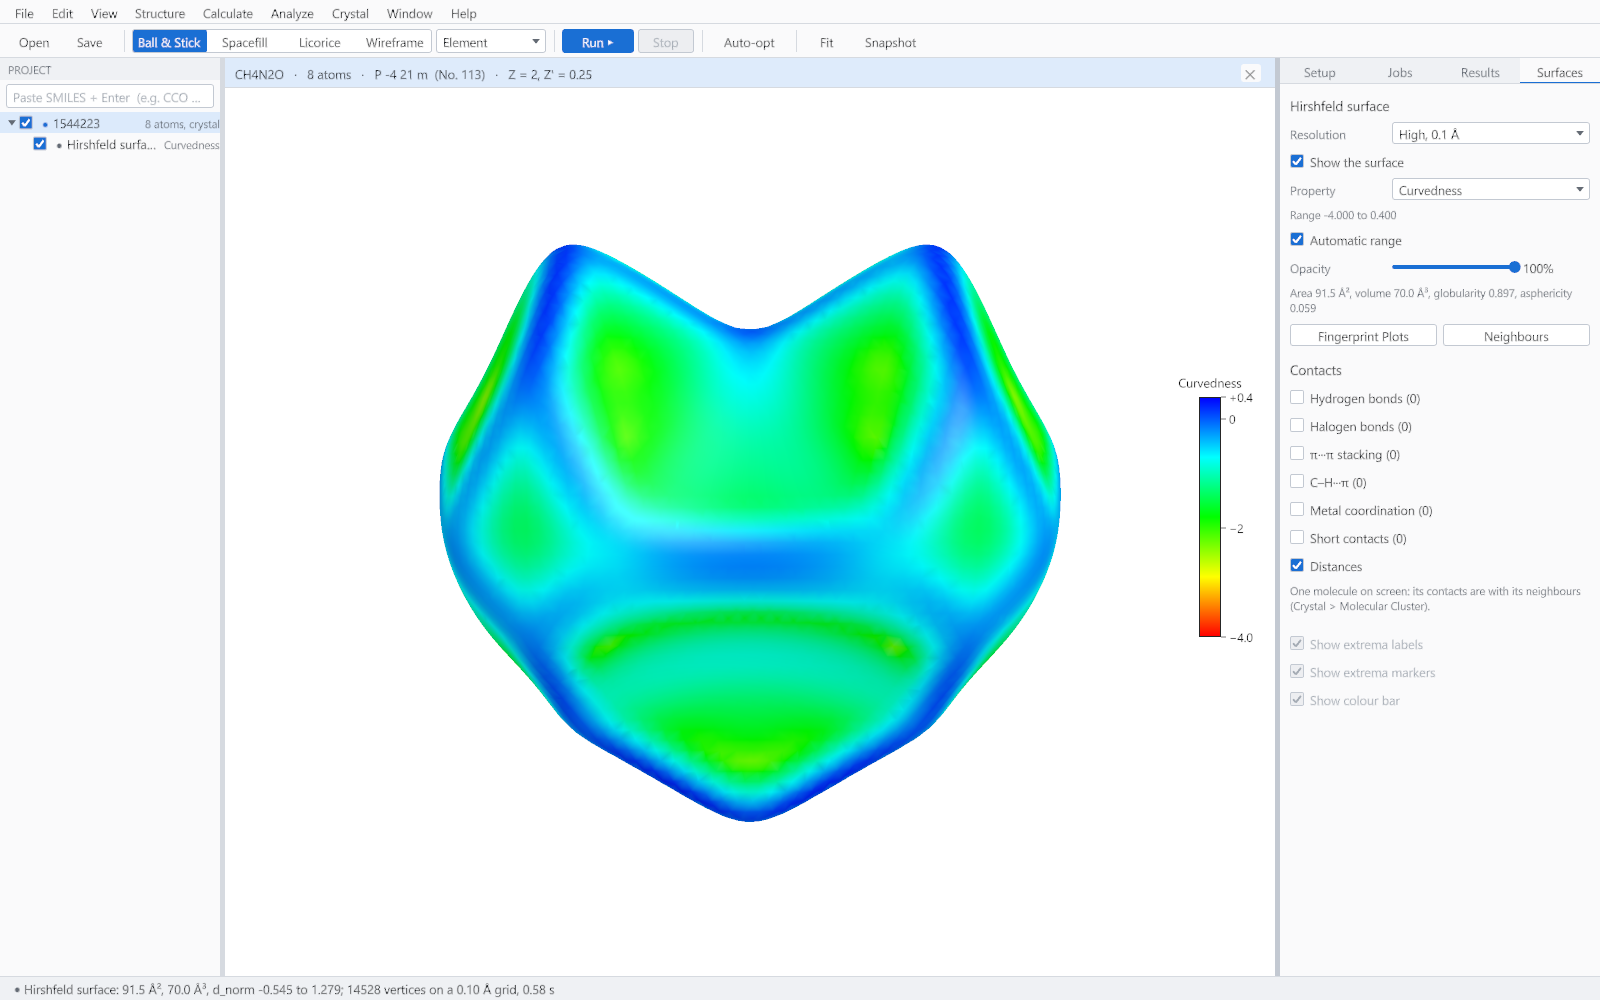
CurvednessHow flat the surface is. Large flat regions indicate stacking.
The d<sub>norm</sub> surface. The red spots are the close contacts, each one a hydrogen bond or a short contact.
The dnorm surface. The red spots are the close contacts, each one a hydrogen bond or a short contact.
The shape index, whose red and blue triangular patches indicate stacked aromatic rings.
d<sub>i</sub>, the distance inward to the nearest nucleus.
di, the distance inward to the nearest nucleus.
d<sub>e</sub>, the distance outward to the nearest neighbouring nucleus.
de, the distance outward to the nearest neighbouring nucleus.
The same surface drawn transparently over the molecule, which relates each contact to the group that makes it.
Curvedness. The large flat green regions are where molecules stack face to face.
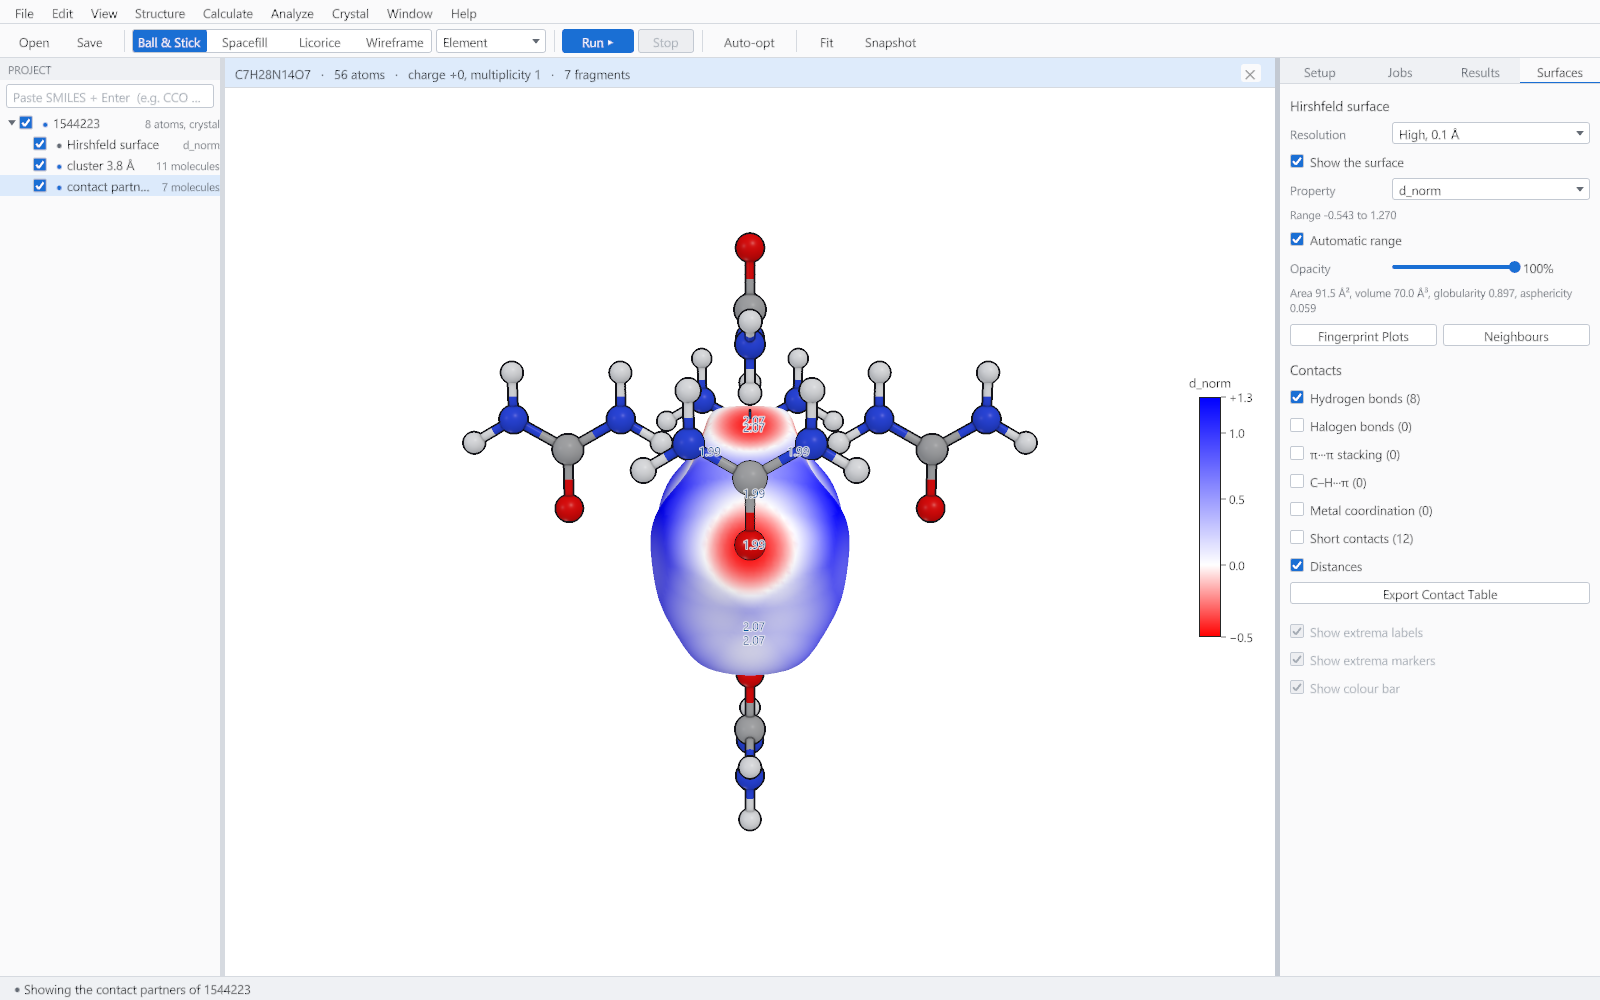
The neighbouring molecules that make the closest contacts, drawn with the surface they touch.

Fingerprint plots

A fingerprint plot is the two-dimensional histogram of di against de over the whole Hirshfeld surface. Every crystal gives a characteristic pattern, and the features are read rather than measured: a pair of sharp spikes means hydrogen bonding, wings mean carbon-hydrogen to pi contacts, and a green patch on the diagonal at about 1.8 angstroms means pi stacking.
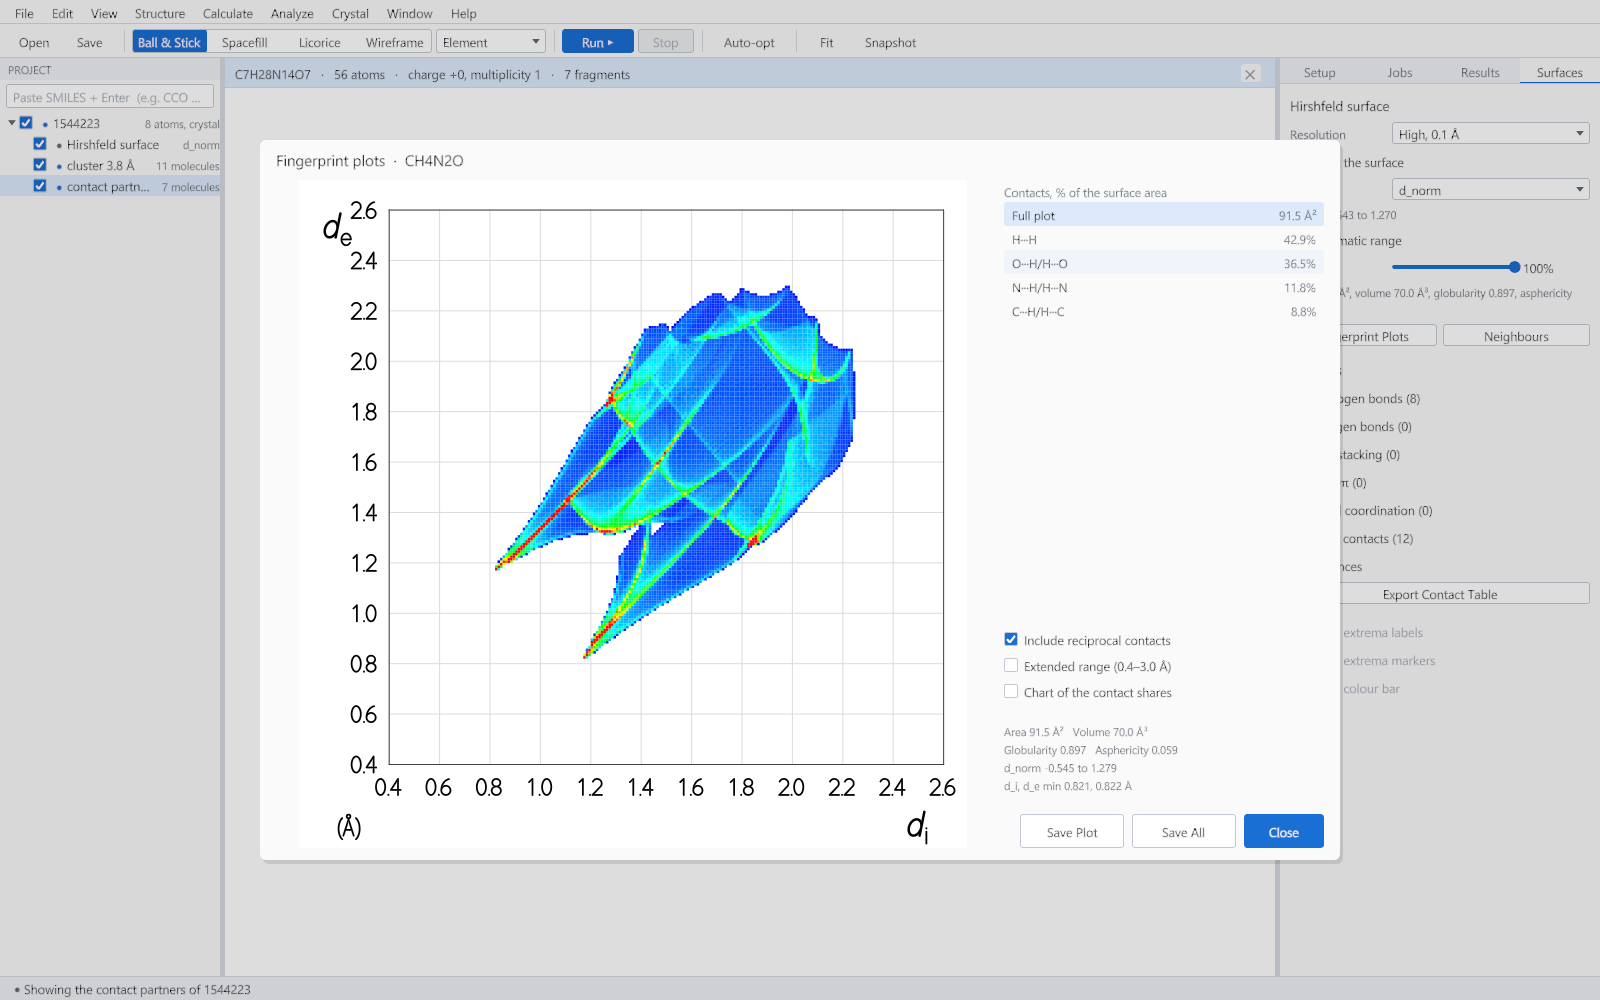
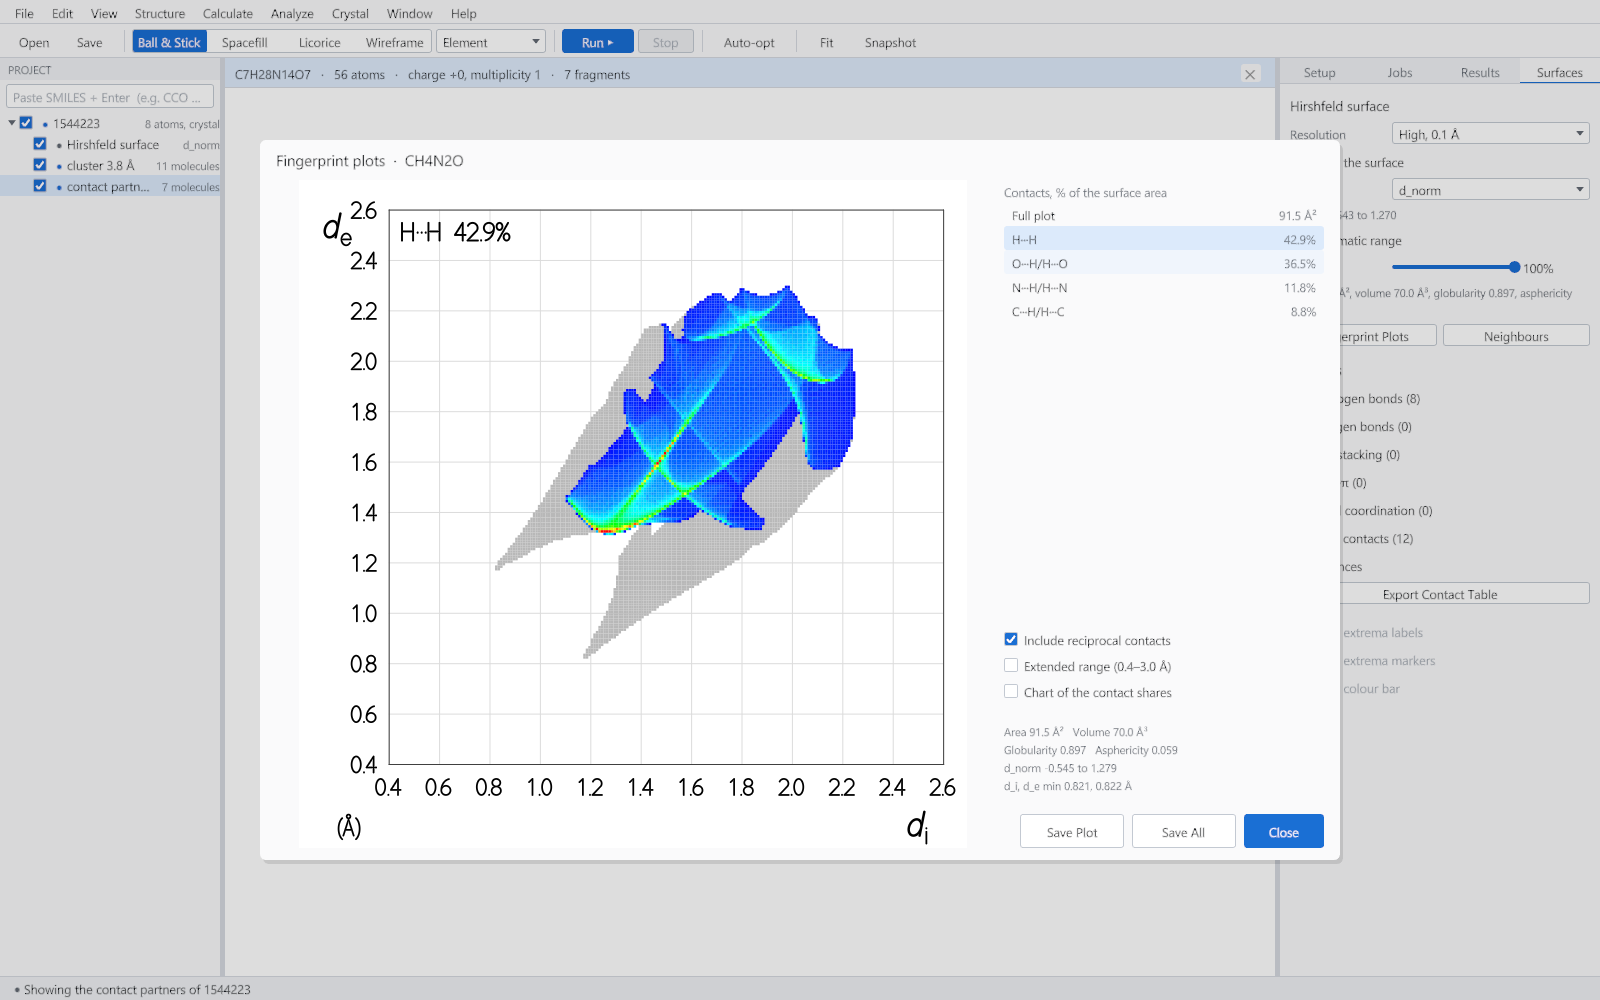
The fingerprint plot of the whole surface.
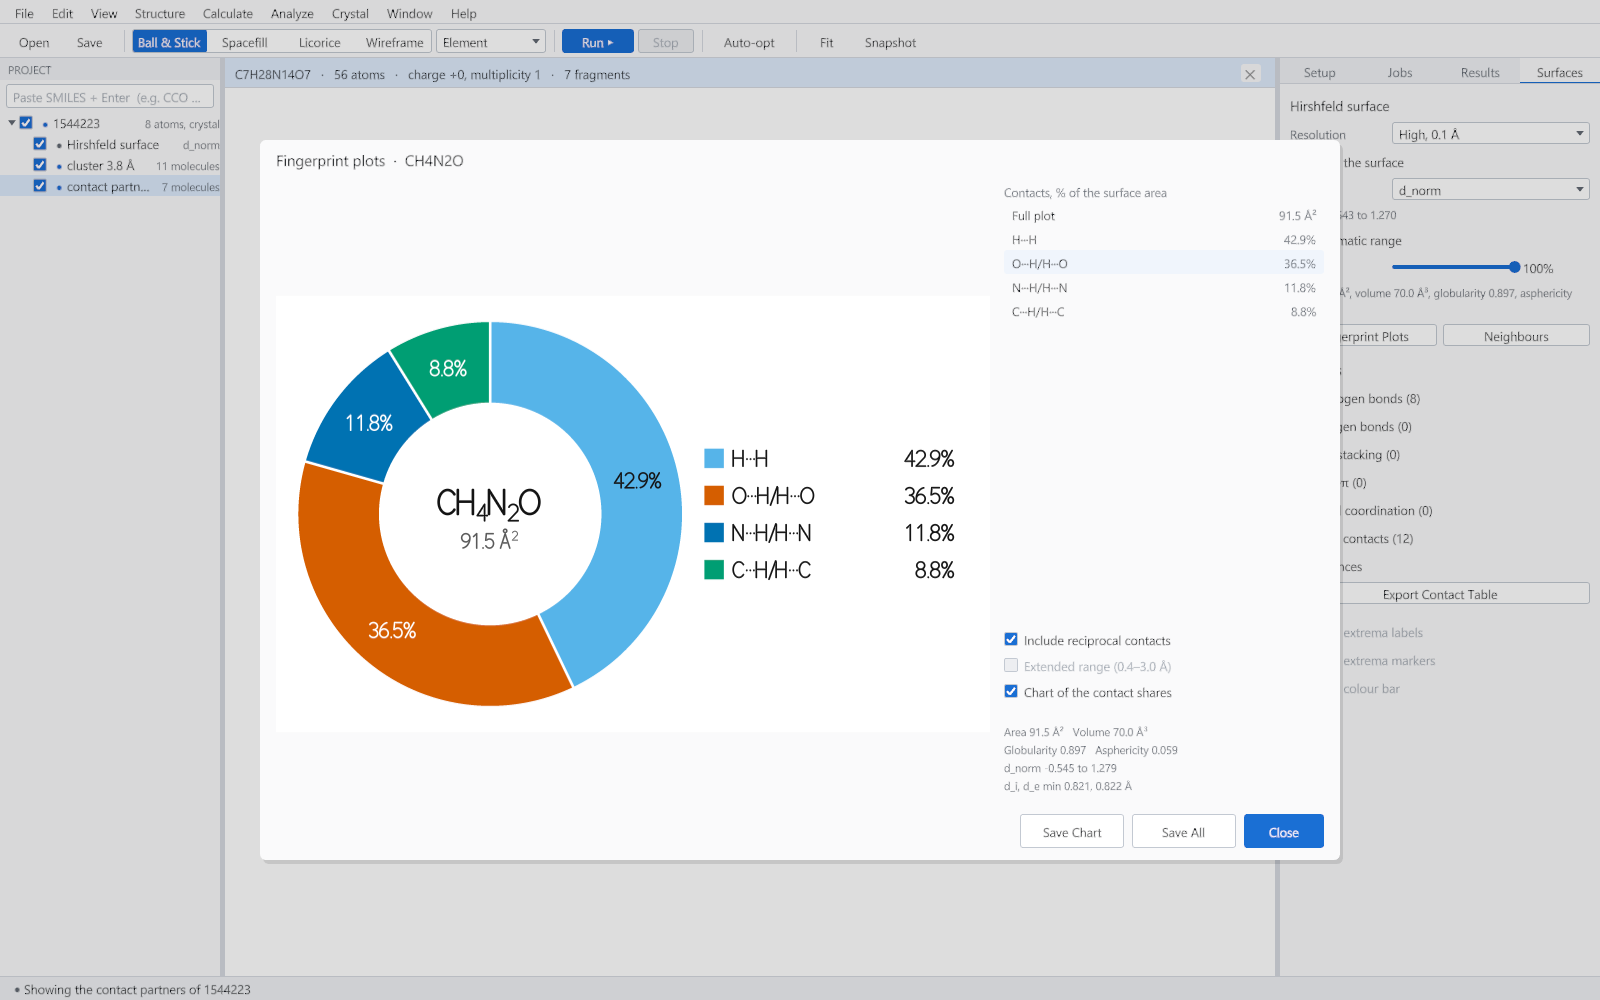
The same plot decomposed by contact type, which quantifies how much of the surface each kind of contact accounts for.
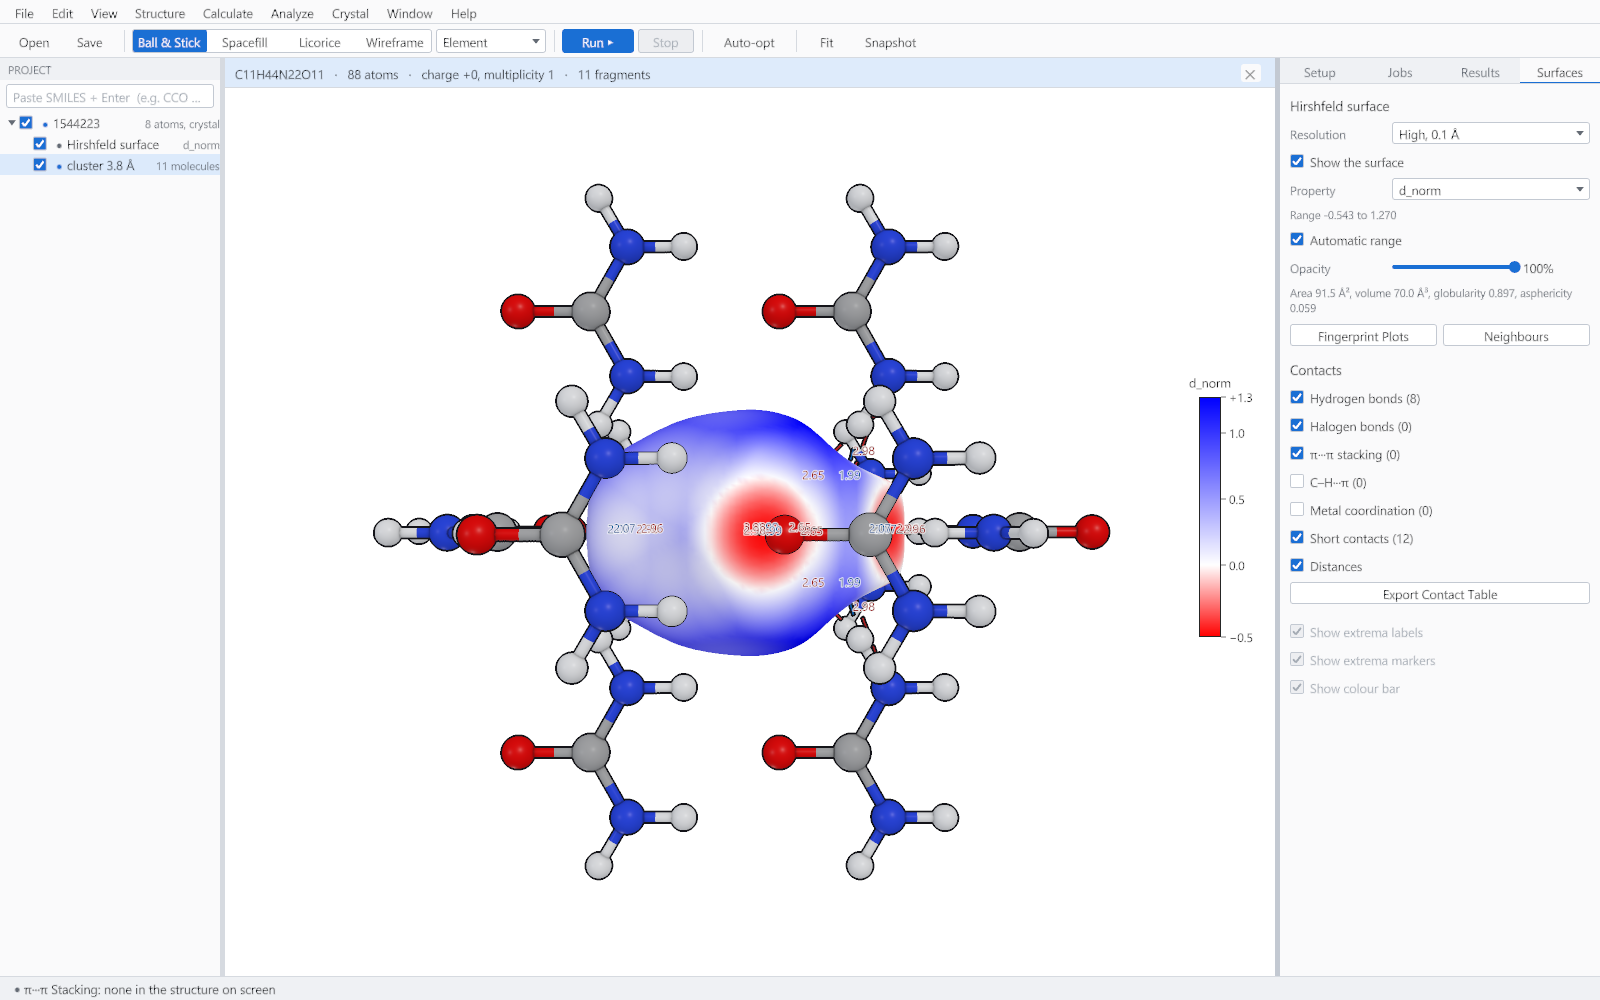
The close contacts in a cluster, drawn in the viewer with their distances.
The contact composition as a chart: the percentage of the Hirshfeld surface belonging to each kind of atom pair.
A crystal figure exported at publication resolution.